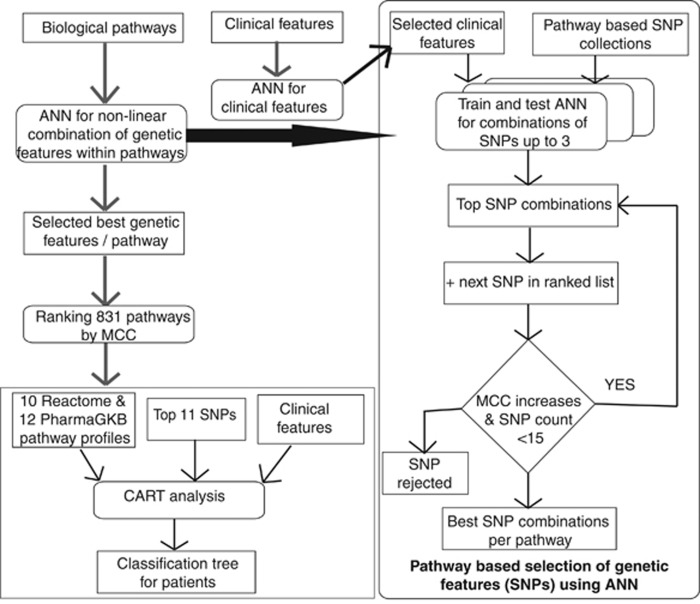
Figure 2.
Flow diagram of the ANN models and CART (see also Supplementary Online Material). For pathway analysis, we included all nonsynonymous coding, frameshift coding, stop codon and splice site SNPs genotyped in this study with MAF above 0.005 residing in the pathway genes for pathways in Reactome database and for the 12-drug metabolism pathways from the PharmGKB database. Each pathway had between 1 and 193 SNPs, and each SNP was encoded by three values between 0 and 1 corresponding to likelihood of each genotype calculated from VCF file produced by SAMtools (see Supplementary Online Material). Associations with relapse risk were performed by training feedforward ANNs with backpropagation on subsets of SNPs from each pathway with threefold cross-validation. For each pathway, all combinations of up to three SNPs were assessed by means of MCC. The combinations were then further iteratively increased up to 15 SNPs by adding another SNP to the top 20 previous combinations of SNPs, if the MCC increased by at least 0.01. Pathways were then ranked by MCC of the best combination of SNPs for each pathway, and the most predictive pathways for relapse were then included in the CART analysis. This included the 426 patients with complete information on sex, age and WBC at diagnosis, immunophenotype, karyotype, end of induction MRD and risk group. For the large group of patients with low MRD, the SNP profiles of the top Reactome/PharmGKB pathways were included to explore their relapse prediction for this patient subset.

