

Abstract
Heparins have been reported to cause elevations in serum alanine aminotransferase (ALT) and aspartate aminotransferase (AST) but have not been associated with clinically significant liver injury. The mechanisms underlying these benign laboratory abnormalities are unknown. Forty-eight healthy men were randomized to receive subcutaneous injections of unfractionated heparin (UFH; 150 U/kg), enoxaparin sodium (1 mg/kg), dalteparin sodium (120 IU/kg), or adomiparin sodium (125 IU/kg; a novel heparin) every 12 h for 4.5 days. Asymptomatic elevations in serum ALT or AST were observed in >90% of the subjects. Elevations were also observed in the levels of serum sorbitol dehydrogenase (SDH), glutamate dehydrogenase (GLDH), miR-122, high-mobility group box-1 protein (including the acetylated form), full-length keratin 18, and DNA. Keratin 18 fragments, which are apoptosis biomarkers, were not detected. Biomarker profiles did not differ significantly across heparin treatments. We conclude that heparins as a class cause self-limited and mild hepatocyte necrosis with secondary activation of an innate immune response.
The association between administration of unfractionated heparin sodium (UFH) and elevations in serum aminotransferases was first reported more than 25 years ago, and subsequent studies have validated this association.1–4 Further case reports and clinical studies have indicated that this property is not unique to UFH and that similar aminotransferase elevations occur after administration of low-molecular-weight heparin products.5–7 These elevations in serum aminotransferases are characteristically asymptomatic and reverse with continued treatment;8 serious liver injury due to heparins has not been reported.5 Accordingly, there are currently no guidelines requiring the monitoring of liver parameters in patients on any heparin therapy.9
Adomiparin sodium (adomiparin),10,11 a novel, rationally designed low-molecular-weight heparin, is currently under evaluation for the treatment of acute coronary syndrome (ACS). Early clinical studies indicated an unexpectedly high incidence and magnitude of ALT elevations associated with the use of this compound. However, there is little published information regarding the time course, magnitude, and incidence of aminotransferase elevations when heparins are used to treat ACS, which necessitates relatively high daily doses administered over several days. To compare the effects of adomiparin on the liver relative to the effects of currently approved heparin products, we conducted a phase I, randomized study in healthy volunteers.
Although the primary objective of the study was to compare the time-dependent incidence and magnitude of serum aminotransferase levels across treatments with UFH, enoxaparin, dalteparin, and adomiparin administered at doses typically used in ACS, the study also provided an opportunity to utilize additional biomarkers to gain insight into the mechanisms underlying these effects.
Results
A total of 48 healthy men 19–49 years of age were enrolled in the study and randomly assigned to receive UFH, dalteparin, enoxaparin, or adomiparin twice daily for 4 consecutive days plus the morning of the fifth day (a total of nine doses). All data obtained for each subject are listed in Supplementary Table S1 online.
Aminotransferase elevations
Treatment-emergent elevations in serum alanine aminotransferase (ALT) and aspartate aminotransferase (AST) values above the upper limits of normal were observed in 94% (45/48) and 90% (43/48) of the subjects, respectively. During each of the treatments, the values generally began to rise by day 3, reaching their peaks on day 7, 2 days after the end of the heparin course (Figure 1, AST data not shown). There were no significant intergroup differences in ALT or AST values at any of the time points tested (P < 0.05). The mean peak values of ALT and AST, expressed as multiples of the upper limit of normal, were 3.4 ± 0.4 and 2.1 ± 0.2 (mean ± SEM), respectively.
Figure 1.
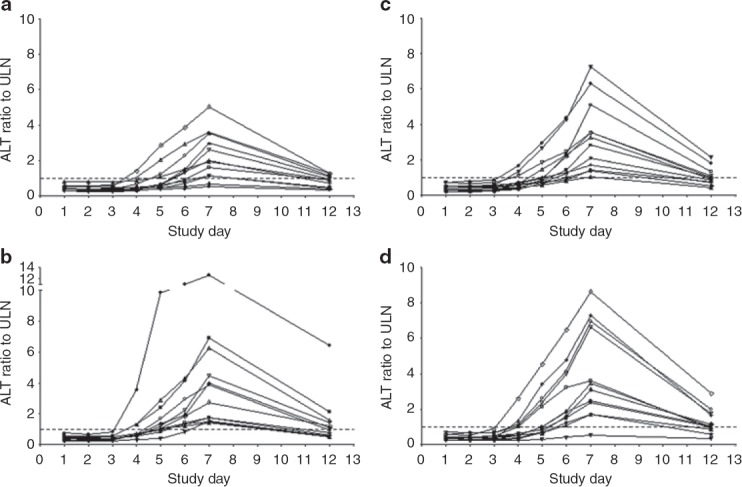
Serum alanine aminotransferase (ALT) levels in each study subject before, during, and after twice-daily subcutaneous injections of (a) unfractionated heparin (150 U/kg), (b) dalteparin sodium (120 IU/kg), (c) enoxaparin sodium (1 mg/kg), and (d) adomiparin sodium (125 IU/kg). The subjects received the first dose on the morning of day 1 and the final dose on the morning of day 5. The upper limit of the normal reference range is denoted by the dotted line. ULN, upper limit of normal.
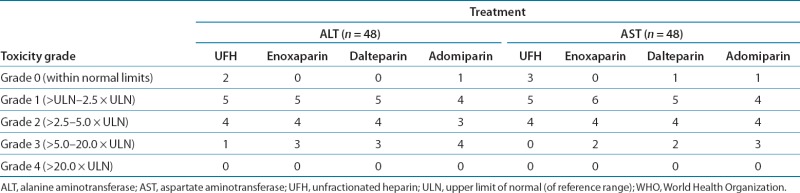
Episodes of grade 3 increases in ALT (exceeding five times the upper limits of normal) were reported in 11 subjects (23%) across all the treatment groups (Table 1). All the elevated ALT and AST values returned to the reference range. No grade 4 elevations were noted; however, in one subject treated with dalteparin, the peak ALT value was 13 times the upper limit of normal (Figure 1b). The duration of the ALT elevation outside the reference range varied from ˜2 days to 33 days. None of the subjects experienced clinical signs of liver injury (i.e., no fatigue, nausea, or right-upper-quadrant pain was reported).
Table 1.
WHO toxicity grades for AST and ALT results by treatment
 |
The mean alkaline phosphatase (ALP) values remained within the reference range (47–132 U/l) with minimal changes for all treatments at all time points. Bilirubin values were not observed to deviate from the reference range (0.3–1.6 mg/dl) throughout the study. AST, ALP, and bilirubin values are shown in Supplementary Table S1 online.
Additional protein biomarker analysis
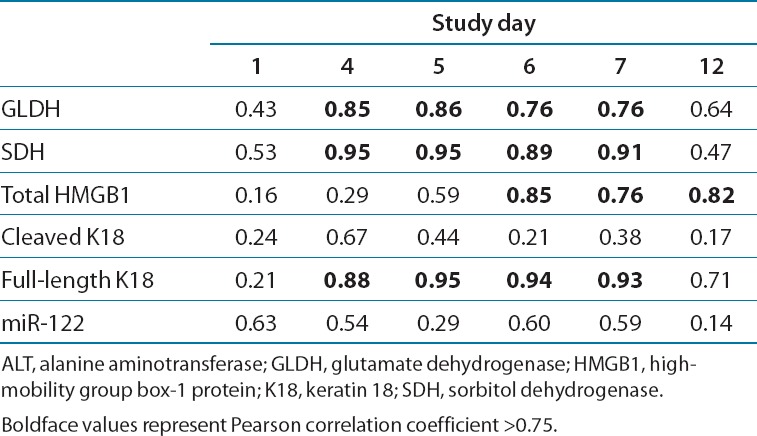
With the exception of the cleaved form of keratin 18 (K18), treatment-emergent elevations were observed in each of the additional serum proteins measured: sorbitol dehydrogenase (SDH), glutamate dehydrogenase (GLDH), full-length K18 (Figure 2d), and high-mobility group box-1 protein (HMGB1; Figure 3a). The elevations were first evident at day 3 in some patients, and peak mean values were generally attained on day 7, tracking generally well with the course of elevations in ALT and AST (Table 2). The Pearson correlation coefficient (σ) of ALT levels for all treatments with protein biomarkers at the peak elevation (day 7) was 0.91 with SDH, 0.76 for GLDH, 0.76 for HMGB1, and 0.93 for full-length K18. As was observed with aminotransferase elevations, there were no intergroup differences for any pair of heparin treatments in the magnitude of increase in each of the serum biomarker levels at any of the time points tested (P < 0.05).
Figure 2.
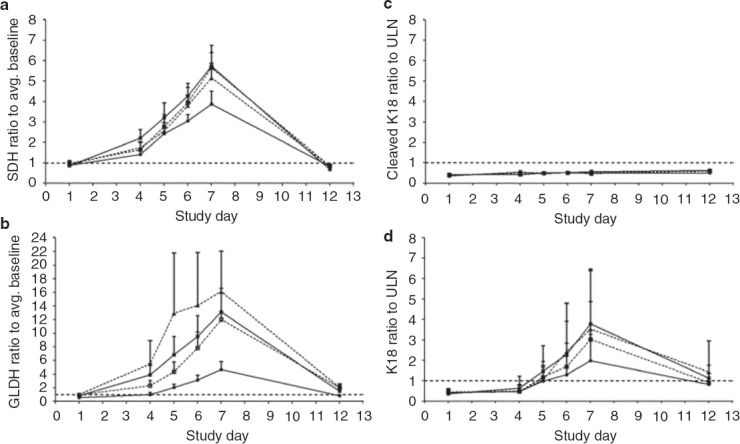
Serum measurements of liver injury biomarkers (a) sorbitol dehydrogenase (SDH); (b) glutamate dehydrogenase (GLDH); and biomarkers of cellular injury modality, including (c) cleaved keratin 18 (cleaved K18) and (d) full-length keratin 18 (K18); are depicted as mean values ± SEM. The subjects received the first dose on the morning of day 1 and the final dose on the morning of day 5. The upper limit of the normal reference range or the average (Avg.) baseline value is denoted by the dotted line. Unfractionated heparin (filled circles), enoxaparin sodium (open squares), dalteparin sodium (filled triangles), and adomiparin sodium (filled squares). ULN, upper limit of normal.
Figure 3.
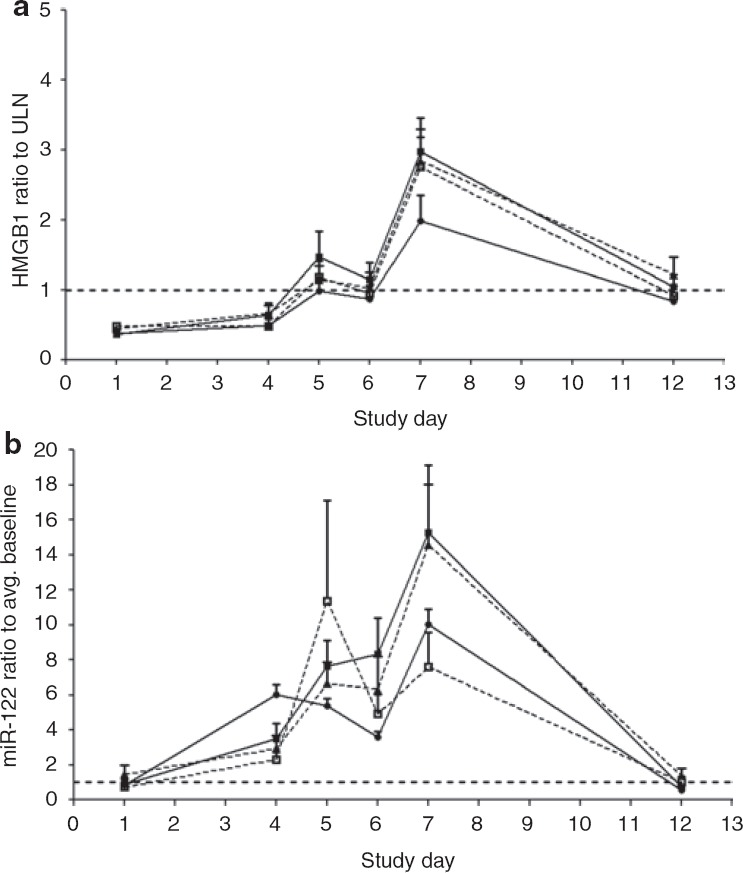
Serum measurements of (a) the cellular necrosis biomarker, high-mobility group box-1 protein (HMGB1), and (b) hepatocyte injury biomarker miR-122 are depicted as the mean value ± SEM for each treatment. The subjects received the first dose on the morning of day 1 and the final dose on the morning of day 5. The upper limit of the normal reference range or the average (Avg.) baseline value is denoted by the dotted line. Unfractionated heparin (filled circles), enoxaparin sodium (open squares), dalteparin sodium (filled triangles), and adomiparin sodium (filled squares). ULN, upper limit of normal.
Table 2.
Pearson correlation coefficients between ALT and liver biomarker values in serum
 |
With total HMGB1, the mean serum value at day 5 (the last day of heparin treatment) across all treatments was higher than on day 6 (P < 0.05). This “double peaking” in HMGB1 was noted in 31 of the 48 subjects (65%) and was not evident with the other protein biomarkers (see Supplementary Table S1 online). During the first peak, circulating HMGB1 was not detectably acetylated, but during the second peak, 20–35% of the HMGB1was acetylated (Figure 4). We observed no time-dependent changes in any of the treatments with respect to the circulating levels of cleaved K18, a marker for epithelial cell apoptosis (Figure 2c).
Figure 4.
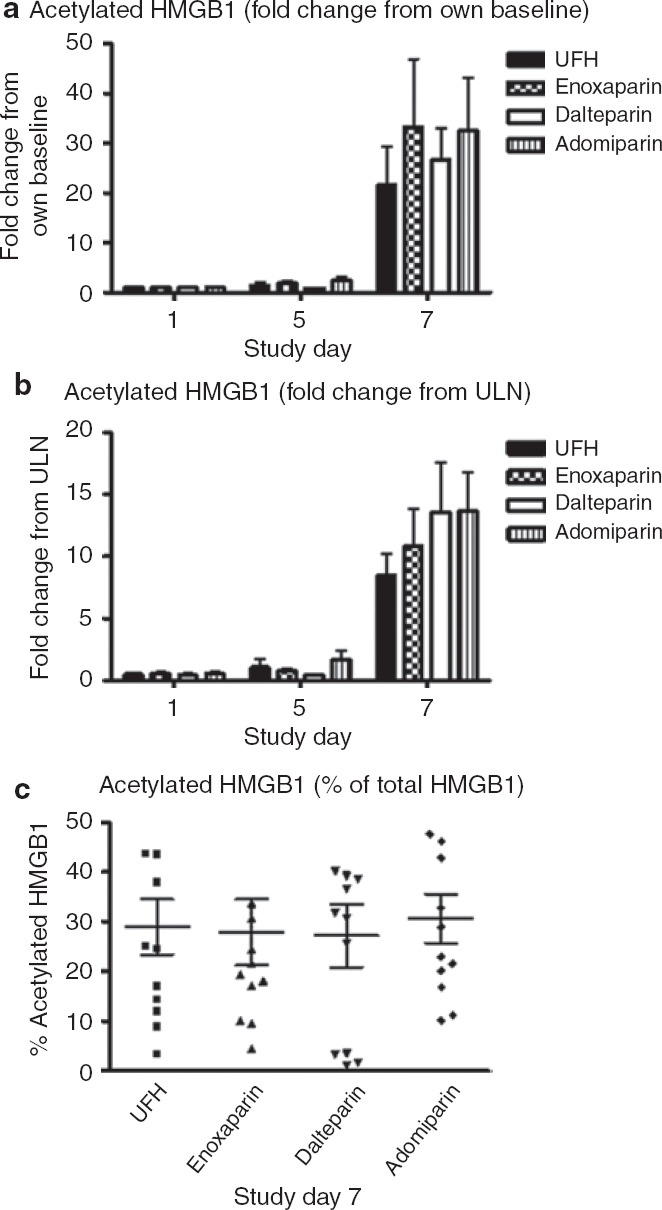
Acetylation of high-mobility group box-1 protein (HMGB1) at baseline (day 1) and during the first peak (day 5) and second peak (day 7). The values, expressed as (a) multiples of baseline value, (b) multiples of ULN, and (c) percentage of total HMGB1, are depicted as the mean value ± SEM for each treatment. In this assay, the upper limit of normal was 0.12 ng/ml and the mean values obtained during the second peak were 1–2 ng/ml. UFH, unfractionated heparin; ULN, upper limit of normal.
DNA analysis
The levels of DNA were measured using PicoGreen assay in plasma samples obtained before the first heparin dose on day 1 and again in plasma samples obtained on day 5, corresponding to the first peak in HMGB1 levels in serum. The mean DNA levels rose between days 1 and 5 for each of the four heparin treatments, with the increase being significant for enoxaparin and adomiparin (P < 0.05). When data from all the treatment arms were combined, the mean plasma DNA level rose from the baseline level of 824.7 ± 21.2 ng/ml before treatment on day 1 to 941.1 ± 19.1 ng/ml on day 5 (P < 0.0001, mean ± SEM; see Supplementary Table S1 online).
miR-122 analysis
Coincident with elevations in liver enzymes, miR-122 levels in the serum were also elevated after heparin treatment (Figure 3b). There were no significant intergroup differences in the serum levels of miR-122 at any of the measured time points, including on day 7 when the peak elevation occurred. The levels of miR-122 exhibited a larger dynamic range than those of the protein biomarkers measured. In 15 subjects (31%), the miR-122 value rose >20-fold relative to the baseline value (3 in UFH arm, 1 in the dalteparin arm, 4 in the enoxaparin arm, and 7 in the adomiparin arm). As with HMGB1, the serum miR-122 level was often higher on day 5 than on day 6, with “double peaking” evident in 26 of the 48 subjects (˜54%), although the mean values were not statistically different between the two days (P >0.05).
Discussion
Consistent with previous reports, elevations in serum ALT and AST levels were observed during treatment with UFH and with all the low-molecular-weight heparin preparations. However, the frequency and magnitude of heparin-induced aminotransferase elevations were considerably higher in this study than in those previously reported. This is probably because this study used higher heparin doses that are typically used for the treatment of ACS. In addition, the majority of the published clinical studies on heparin treatment for other indications (i.e., deep-vein thrombosis) have not systematically measured liver chemistry parameters daily during the first week of treatment, possibly leading to underreporting of aminotransferase elevations.
The time course of aminotransferase elevations was consistent across the various heparin treatment arms, beginning at 3 days after the initiation of dosing in all groups, attaining peak values 24–48 h after cessation of dosing and generally returning to normal values within 1 week of discontinuing treatment.
The elevations in serum ALT and AST were asymptomatic and not associated with increases in bilirubin that would suggest impairment of liver function. Nonetheless, the magnitude of the elevations observed in some subjects would prompt concern regarding liver safety in most clinical settings and might be sufficient to initiate an extensive liver evaluation. In a phase I clinical trial of a new drug, such elevations might prompt discontinuation of development of the drug. Given that heparins have not been reported to cause clinically important liver injury, it has been suggested that the ALT and AST elevations in this setting may not reflect liver injury. The mechanisms postulated include nonhepatic sources for the enzymes,12 induction of these enzymes in hepatocytes,13 reduction in the clearance of these enzymes from circulation, and hepatocellular membrane modification.14,15 The mechanisms cannot be studied in rodents or dogs because these animals do not exhibit aminotransferase elevations when treated with heparins; in fact, heparins have been shown to mitigate liver injury in some rat models of liver injury.16,17 The clinical trial provided an opportunity for additional biomarker analyses in order to gain some mechanistic insight into heparin-related elevations in aminotransferases.
Circulating miR-122 originates only from the liver,18 and recent studies have utilized miR-122 detection as a biomarker of clinical acetaminophen-induced hepatotoxicity.19 The observed elevations in miR-122 in this study confirm a hepatic source for the biomarkers measured. The elevations in diverse liver-derived proteins and a microRNA species make it unlikely that induction or reduced plasma clearance are the mechanisms for the serum aminotransferase elevations seen in our study. We conclude that the elevations in serum biomarkers that we observed reflect a general leakage of hepatocellular contents.
Although it remains possible that the biomarkers entered the blood through physiological mechanisms, such as increased shedding of plasma membrane microvesicles,20 the observed elevations in GLDH make this less likely. GLDH is a large protein found in the liver and, to a lesser extent, in the kidney, where it is localized to the mitochondrial matrix;21 its entry into blood should reflect loss of mitochondrial membrane integrity or the entry of whole mitochondria into the blood, as could occur in necrosis or apoptosis.22 The absence of a rise in K18 fragments does not support the hypothesis of hepatocyte apoptosis,23 making hepatocyte death by necrosis a more likely process to account for our observations. This is plausible, given that high concentrations of heparins have been shown to cause necrosis of primary rat hepatocytes in culture.24
It is also informative that all the biomarkers measured attained peak mean values almost 2 days after the last dose of each heparin treatment, and higher values might have been observed had serum samples been available between days 7 and 12. Heparins have half-lives in the range of 2–6 h, and, even with subcutaneous injection, there should be negligible circulating concentrations of heparins at the time point when hepatocyte leakage appeared to be maximal. This suggests an indirect effect on the hepatocytes. In addition, the “double peaking” frequently observed with respect to HMGB1 and miR-122 in this study may suggest both a direct and an indirect effect of the heparins. The fall in mean levels of HMGB1 and miR-122 at day 6 relative to day 5 is consistent with a direct effect of heparins on hepatocytes. HMGB1 is a known damage-associated molecular pattern released from necrotic cells that is capable of bridging cell death to the inflammatory response. HMGB1 binds to Toll-like receptors and to the receptor for advanced glycation end products, thereby initiating an innate immune response.25 The immune activation by HMGB1 may require cofactors, and mammalian DNA has been proposed as a potential cofactor.26 It may therefore be important that we observed a mean increase in circulating DNA at the time of the initial peak in serum HMGB1. Consistent with immune activation, we found that the secondary rise in HMGB1, but not the initial one, was associated with substantial acetylation of the protein. Although a recent report suggests that acetylation of HMGB1 may occur in hepatocytes during ischemia/reperfusion injury,27 acetylation is typically attributed to release of HMGB1 from activated innate immune cells (e.g., Kupffer cells). Our data are therefore consistent with secondary activation of an innate immune response that could be linked to repair of the injury. However, the temporal link between acetylation of HMGB1 and the second peaks in serum HMGB1 and miR-122 support the idea that the innate immune response might contribute to progression of liver injury (as indicated by the other biomarkers) for at least 2 days after the last dose of heparin. The absence of double peaking in biomarkers other than HMGB1 and miR-122 may reflect the longer serum half-lives of these proteins. To our knowledge, the serum half-lives of HMGB1 and miR-122 are not known in humans; however, data from one study that investigated acetaminophen-induced liver toxicity in rodents suggested that the serum HMGB1 derived from necrotic cell death has a half-life shorter than that of ALT activity.28 A recent investigation showed that, following acetaminophen hepatotoxicity in humans, miR-122 also appears to have a shorter half-life than ALT.19
Why hepatocyte necrosis resolves despite continued heparin treatment8 and essentially never progresses to clinically important liver injury is a fascinating question. Recent studies suggest that adaptive immune responses may be critical in the progression of at least some forms of drug-induced liver injury.29,30 Heparins appear to cause transient hepatocyte necrosis and activation of an innate immune response; these effects may never elicit an adaptive immune response. We speculate that this may be because heparins are biological molecules that do not form the reactive metabolites that may be required for neoantigen formation. However, other biological agents have been associated with serious liver injury.31,32
In a clinical trial of a new drug, it is not currently possible to distinguish isolated elevations in serum ALT and AST that portend serious liver injury potential (e.g., during treatment with isoniazid for tuberculosis) from transient and benign elevations that can occur during treatment with some generally safe drugs (e.g., statins, tacrine, aspirin, and heparins).33 A current US Food and Drug Administration guidance on assessing liver safety in clinical trials (http://www.fda.gov/downloads/Drugs/GuidanceComplianceRegulatoryInformation/Guidances/UCM174090.pdf) recommends continuing the treatment of subjects with asymptomatic elevations in ALT or AST to determine whether they go on to develop symptoms or signs of liver dysfunction (e.g., elevation of serum bilirubin). Because liver injury can progress quickly and continue after discontinuation of drug therapy, this practice may place some subjects at risk. There are now large-scale efforts, such as SAFE-T in Europe (http://www.imi-safe-t.eu/biomarker/drug-induced-injury/imi), that seek to identify new biomarkers that can help in interpreting the significance of isolated elevations in serum ALT and AST. Prior to our study, it might have been assumed that the ideal biomarkers would be those capable of identifying hepatocyte necrosis and/or activation of innate immunity. Although we believe that the assays we utilized in our study will be useful in clinical trials, the interpretation of the data obtained in terms of liver safety risk may not be straightforward.
In summary, the four heparins we studied produced essentially indistinguishable elevations in a variety of hepatocyte biomarkers, indicating a class effect that most likely represents transient, low-level necrotic death of hepatocytes. Our data suggest that this necrotic death activates an innate immune response that may act to propagate the injury. Why this chain of events has no consequences for patients treated with heparins is a question that remains unexplained by our data. Our findings have implications for the search for improved biomarkers of drug-induced liver injury.
Methods
Study participants. A total of 48 healthy men (18–50 years of age) were enrolled in June and July of 2009 in accordance with the guidelines of the MDS Pharma Services Institutional Review Board, an entity that functions independently of MDS Pharma Services (Tempe, AZ). All procedures were in accordance with the principles enunciated in the Declaration of Helsinki (Seoul, 2008). Written informed consent was obtained from all subjects prior to the study. All subjects completed the clinical phase of the study, with none withdrawing or discontinuing.
Twelve subjects per drug treatment was expected to be sufficient to obtain adequate characterization of the relevant safety parameters under investigation in healthy adult subjects and to provide data for the primary end points of the study, namely, determination of the class effects for aminotransferase elevation and antibody formation across a variety of heparin compounds.
Study design and procedures. This single-center, randomized, double-blind, parallel-group phase I study was designed and conducted at MDS Pharma Services.
At the enrollment visit (day 1), the subjects were asked to report to the study unit at least 15 h before the first scheduled dose. After check-in, eligible subjects were randomly assigned to four groups of 12 subjects each to receive twice-daily subcutaneous injections of one of the following drugs: UFH (150 U/kg; Heparin Sodium Injection, USP, 20,000 U/ml; APP Pharmaceuticals, Schaumburg, IL), enoxaparin sodium (1 mg/kg; Lovenox; Sanofi-Aventis, Bridgewater, NJ), dalteparin sodium (120 IU/kg; Fragmin; Pfizer for Eisai, New York, NY), or adomiparin sodium (125 IU/kg; Momenta Pharmaceuticals, Cambridge, MA). The doses selected were those appropriate for the indication of ACS. The first dose was given on the morning of day 1, and the final dose was given on the morning of day 5. The subjects were confined to the clinic from at least 15 h before the first scheduled dose to 48 h after the last dose; that is, the subjects entered the clinic by the evening of day −1 and were discharged on the morning of day 7. Subjects returned for a follow-up visit 7 days after the last dose (i.e., on day 12), and for a final safety evaluation to test for the development of heparin-induced antibodies 28 days after the last dose (i.e., day 33; data not shown).
While the subjects were confined in the clinic (from day −1 to day 7), standard meals were served at appropriate times throughout the day. Subjects were required to fast overnight for at least 10 h before the morning dose on days 1 and 5 and were fasted for 4 prior to dosing on days 2–4. For the evening doses, subjects were required to fast from 2 h before until 2 h after dosing. Subjects were not permitted to drink water from 1 h before until 1 h after each dosing but was allowed at all other times.
Biomarker measurements. The primary end points with respect to safety were routine liver chemistry tests in serum samples collected before dosing on day 1 (baseline), before each morning dose on days 2–5, at the same time in the morning on days 6 and 7, and at the follow-up visit on day 12. The samples were allowed to clot at room temperature for at least 30 min before refrigeration and centrifugation. Serum and plasma were stored at approximately −80 °C pending analysis. Clinical liver chemistry tests, including those for ALT, AST, ALP, and bilirubin, were performed by a commercial clinical laboratory (MDS Pharma Services). An additional primary end point—the potential occurrence of heparin/platelet factor 4 antibodies—is not within the scope of this article.
GLDH levels were determined in serum by means of an absorbance assay using a glutamate dehydrogenase (DGKC) kit (Randox Laboratories, Kearneysville, WV) to measure the decrease in absorbance caused by the oxidation of nicotinamide adenine dinucleotide at 340 nm, per the manufacturer's protocol. SDH levels were determined in serum by means of an absorbance assay using a sorbitol dehydrogenase kit (Genzyme Diagnostics, Cambridge, MA) to measure the decrease in absorbance caused by the oxidation of nicotinamide adenine dinucleotide at 340 nm, per the manufacturer's protocol. Assay results for both GLDH and SDH were quantified using Cobas Fara II (Roche Diagnostics, Indianapolis, IN). Total HMGB1 content was determined in serum by means of enzyme-linked immunosorbent assay (ELISA) per the manufacturer's protocol (IBL International, Hamburg, Germany). Acetylated HMGB1 was quantified using liquid chromatography–electrospray tandem mass spectrometry as described previously.34 Caspase-cleaved and total K18 were determined using the M65 and M30 (apoptosense) ELISAs, respectively, in accordance with the manufacturer's guidelines (Peviva, West Chester, OH). For all ELISA analytes, the inter- and intra-assay variabilities were <20% for all the assays.
DNA quantification. DNA was quantified in plasma samples taken from study subjects before the first dose on day 1 and on day 5. DNA was quantified using the Quant-iT PicoGreen dsDNA kit (Invitrogen, St Louis, MO) in accordance with the manufacturer's recommendation; this assay primarily detects double-stranded DNA. Briefly, individual plasma samples in triplicate were diluted 50-fold in Tris-EDTA buffer (to a final concentration of 10 mmol/l Tris-HCl, 1 mmol/l EDTA, pH 7.5); standard double-stranded DNA solutions were diluted in Tris-EDTA buffer in accordance with the relevant protocols. The samples were incubated with Quant-it PicoGreen reagent, and fluorescence was quantified using a fluorescence microplate reader with excitation wavelength at 485 nm and emission wavelength at 520 nm. The concentrations in the samples were quantified through extrapolation from a standard curve, with purified calf thymus DNA (Worthington Biochemical, Freehold, NJ) as the standard. Subsequent data analysis incorporated the median value of the three technical replicates for each study subject and the time point of testing.
Quantification of miR-122
RNA extraction: Total RNA, including miRNA, was extracted from 400 µl of serum. RNA extraction was performed using the miRNeasy RNA isolation kit (Qiagen, Valencia, CA).
Real-time quantitative reverse-transcription PCR analysis: The expression levels of miRNA hsa-miR-122 (miR-122) were quantified using the TaqMan miRNA reverse transcription kit and miRNA-specific stem-loop primers (Applied Biosystems, Foster City, CA) in a scaled-down (5 µl) reverse-transcription reaction as described by Kroh et al.,35 using the 7900HT instrument (Applied Biosystems). miRNA was quantified using absolute quantification via a standard curve, with quantities normalized to an exogenous spike-in control derived from Caenorhabditis elegans, cel-miR-39.
Statistical analysis. Descriptive statistics for liver-function tests and biomarkers included the arithmetic mean and SEM. Biomarker values were expressed as the multiple of difference from the upper limit of normal where data were available for the normal range (with respect to ALT, AST, K18, and HMGB1). In the case of biomarkers for which the normal range of values in humans has not been established (SDH, GLDH, and miR-122), the values were expressed as the multiple of increase above the average predose baseline value on day 1. Differences between the treatment arms were assessed using two-way analysis of variance for which the main effects were treatment type and study day. The ALT and AST values for each treatment group were graded according to the World Health Organization toxicity criteria (grades 0–4). Biomarker correlation analyses were performed by calculating the Pearson correlation coefficient (σ). Differences between treatment groups were deemed significant when P < 0.05.
Acknowledgments
The clinical study was funded, designed, and conducted, and the data analyzed, by Momenta Pharmaceuticals in conjunction with the Hamner Institutes. D.J.A. and B.K.P. are supported by the Medical Research Council Centre for Drug Safety Sciences, grant G0700654.
Author Contributions
A.H.H. and P.B.W. wrote the manuscript, designed research, performed research, and analyzed data; J.R., I.F., and T.K.K. designed research, performed research, and analyzed data; J.S.E., C.L.K., and D.M.S. performed research; and D.J.A., D.S.P., and B.K.P. performed research and analyzed data.
Conflict of Interest
I.F., J.R., and T.K.K. are employees of Momenta Pharmaceuticals. P.B.W. has served as a consultant to Momenta Pharmaceuticals. The other authors declared no conflict of interest.
Supporting Information
SUPPLEMENTARY MATERIAL is linked to the online version of the paper at http://www.nature.com/cpt
References
- 1.AL-Mekhaizeem KA, Sherker AH. Heparin-induced hepatotoxicity. Can. J. Gastroenterol. 2001;15:527–530. doi: 10.1155/2001/272046. [DOI] [PubMed] [Google Scholar]
- 2.Dukes GE., Jr Transaminase elevations in patients receiving bovine or porcine heparin. Ann. Intern. Med. 1984;100:646–650. doi: 10.7326/0003-4819-100-5-646. [DOI] [PubMed] [Google Scholar]
- 3.Fagher B, Lundh B. Heparin treatment of deep vein thrombosis. Effects and complications after continuous or intermittent heparin administration. Acta Med. Scand. 1981;210:357–361. [PubMed] [Google Scholar]
- 4.Schwartz KA, Royer G, Kaufman DB, Penner JA. Complications of heparin administration in normal individuals. Am. J. Hematol. 1985;19:355–363. doi: 10.1002/ajh.2830190406. [DOI] [PubMed] [Google Scholar]
- 5.Carlson MK, Gleason PP, Sen S. Elevation of hepatic transaminases after enoxaparin use: case report and review of unfractionated and low-molecular-weight heparin-induced hepatotoxicity. Pharmacotherapy. 2001;21:108–113. doi: 10.1592/phco.21.1.108.34436. [DOI] [PubMed] [Google Scholar]
- 6.Christiansen HM. Biologic tolerance of two different low molecular weight heparins. Semin. Thromb. Hemost. 1991;17:450–454. doi: 10.1055/s-2007-1002654. [DOI] [PubMed] [Google Scholar]
- 7.Colwell CW., Jr Use of enoxaparin, a low-molecular-weight heparin, and unfractionated heparin for the prevention of deep venous thrombosis after elective hip replacement. A clinical trial comparing efficacy and safety. Enoxaparin Clinical Trial Group. J. Bone Joint Surg. Am. 1994;76:3–14. doi: 10.2106/00004623-199401000-00002. [DOI] [PubMed] [Google Scholar]
- 8.Olsson R, Korsan-Bengtsen BM, Korsan-Bengtsen K, Lennartsson J, Waldenström J. Serum aminotransferases after low-dose heparin treatment. Short communication. Acta Med. Scand. 1978;204:229–230. doi: 10.1111/j.0954-6820.1978.tb08428.x. [DOI] [PubMed] [Google Scholar]
- 9.Arora N, Goldhaber SZ. Anticoagulants and transaminase elevation. Circulation. 2006;113:e698–e702. doi: 10.1161/CIRCULATIONAHA.105.603100. [DOI] [PubMed] [Google Scholar]
- 10.Kishimoto TK. M118–a rationally engineered low-molecular-weight heparin designed specifically for the treatment of acute coronary syndromes. Thromb. Haemost. 2009;102:900–906. doi: 10.1160/TH09-02-0105. [DOI] [PubMed] [Google Scholar]
- 11.Rao SV EMINENCE Investigators. Evaluation of a new heparin agent in percutaneous coronary intervention: results of the phase 2 evaluation of M118 IN pErcutaNeous Coronary intErvention (EMINENCE) Trial. Circulation. 2010;121:1713–1721. doi: 10.1161/CIRCULATIONAHA.109.913277. [DOI] [PubMed] [Google Scholar]
- 12.van der Wiel HE, Lips P, Huijgens PC, Netelenbos JC. Effects of short-term low-dose heparin administration on biochemical parameters of bone turnover. Bone Miner. 1993;22:27–32. doi: 10.1016/s0169-6009(08)80078-5. [DOI] [PubMed] [Google Scholar]
- 13.Levy SW. Effects of heparin in vivo on lysosomal enzymes in rat plasma. Can. J. Biochem. 1967;45:1145–1151. doi: 10.1139/o67-131. [DOI] [PubMed] [Google Scholar]
- 14.Girolami B, Prandoni P, Rossi L, Girolami A. Transaminase elevations in patients treated with unfractionated heparin or low molecular weight heparin for venous thromboembolism. Clin. Appl. Thrombo. Hemost. 1998;4:126–128. [Google Scholar]
- 15.Shilo S, Abraham AS, Breuer R, Sonnenblick M. Hypertransaminasemia with subcutaneous heparin therapy. Isr. J. Med. Sci. 1981;17:1133–1135. [PubMed] [Google Scholar]
- 16.Luyendyk JP, Shaw PJ, Green CD, Maddox JF, Ganey PE, Roth RA. Coagulation-mediated hypoxia and neutrophil-dependent hepatic injury in rats given lipopolysaccharide and ranitidine. J. Pharmacol. Exp. Ther. 2005;314:1023–1031. doi: 10.1124/jpet.105.087981. [DOI] [PubMed] [Google Scholar]
- 17.Harada N, Okajima K, Uchiba M. Dalteparin, a low molecular weight heparin, attenuates inflammatory responses and reduces ischemia-reperfusion-induced liver injury in rats. Crit. Care Med. 2006;34:1883–1891. doi: 10.1097/01.CCM.0000220764.10155.03. [DOI] [PubMed] [Google Scholar]
- 18.Lagos-Quintana M, Rauhut R, Yalcin A, Meyer J, Lendeckel W, Tuschl T. Identification of tissue-specific microRNAs from mouse. Curr. Biol. 2002;12:735–739. doi: 10.1016/s0960-9822(02)00809-6. [DOI] [PubMed] [Google Scholar]
- 19.Starkey Lewis PJ. Circulating microRNAs as potential markers of human drug-induced liver injury. Hepatology. 2011;54:1767–1776. doi: 10.1002/hep.24538. [DOI] [PubMed] [Google Scholar]
- 20.Wetmore BA. Quantitative analyses and transcriptomic profiling of circulating messenger RNAs as biomarkers of rat liver injury. Hepatology. 2010;51:2127–2139. doi: 10.1002/hep.23574. [DOI] [PubMed] [Google Scholar]
- 21.Schmidt ES, Schmidt FW. Glutamate dehydrogenase: biochemical and clinical aspects of an interesting enzyme. Clin. Chim. Acta. 1988;173:43–55. doi: 10.1016/0009-8981(88)90356-7. [DOI] [PubMed] [Google Scholar]
- 22.Ozer J, Ratner M, Shaw M, Bailey W, Schomaker S. The current state of serum biomarkers of hepatotoxicity. Toxicology. 2008;245:194–205. doi: 10.1016/j.tox.2007.11.021. [DOI] [PubMed] [Google Scholar]
- 23.Linder S, Havelka AM, Ueno T, Shoshan MC. Determining tumor apoptosis and necrosis in patient serum using cytokeratin 18 as a biomarker. Cancer Lett. 2004;214:1–9. doi: 10.1016/j.canlet.2004.06.032. [DOI] [PubMed] [Google Scholar]
- 24.Sanders SW, Dukes GE, Jr, Gray P, Tolman KG. Toxicity of heparin in isolated rat hepatocytes. Biochem. Pharmacol. 1984;33:2223–2226. doi: 10.1016/0006-2952(84)90658-0. [DOI] [PubMed] [Google Scholar]
- 25.Pisetsky DS, Jiang W. Role of Toll-like receptors in HMGB1 release from macrophages. Ann. N. Y. Acad. Sci. 2007;1109:58–65. doi: 10.1196/annals.1398.008. [DOI] [PubMed] [Google Scholar]
- 26.Rauvala H, Rouhiainen A. Physiological and pathophysiological outcomes of the interactions of HMGB1 with cell surface receptors. Biochim. Biophys. Acta. 2010;1799:164–170. doi: 10.1016/j.bbagrm.2009.11.012. [DOI] [PubMed] [Google Scholar]
- 27.Evankovich J. High mobility group box 1 release from hepatocytes during ischemia and reperfusion injury is mediated by decreased histone deacetylase activity. J. Biol. Chem. 2010;285:39888–39897. doi: 10.1074/jbc.M110.128348. [DOI] [PMC free article] [PubMed] [Google Scholar]
- 28.Antoine DJ. High-mobility group box-1 protein and keratin-18, circulating serum proteins informative of acetaminophen-induced necrosis and apoptosis in vivo. Toxicol. Sci. 2009;112:521–531. doi: 10.1093/toxsci/kfp235. [DOI] [PubMed] [Google Scholar]
- 29.Daly AK. Drug-induced liver injury: past, present and future. Pharmacogenomics. 2010;11:607–611. doi: 10.2217/pgs.10.24. [DOI] [PubMed] [Google Scholar]
- 30.Adams DH, Ju C, Ramaiah SK, Uetrecht J, Jaeschke H. Mechanisms of immune-mediated liver injury. Toxicol. Sci. 2010;115:307–321. doi: 10.1093/toxsci/kfq009. [DOI] [PMC free article] [PubMed] [Google Scholar]
- 31.Bezabeh S, Flowers CM, Kortepeter C, Avigan M. Clinically significant liver injury in patients treated with natalizumab. Aliment. Pharmacol. Ther. 2010;31:1028–1035. doi: 10.1111/j.1365-2036.2010.04262.x. [DOI] [PubMed] [Google Scholar]
- 32.Mancini S, Amorotti E, Vecchio S, Ponz de Leon M, Roncucci L. Infliximab-related hepatitis: discussion of a case and review of the literature. Intern. Emerg. Med. 2010;5:193–200. doi: 10.1007/s11739-009-0342-4. [DOI] [PubMed] [Google Scholar]
- 33.Watkins PB, Seligman PJ, Pears JS, Avigan MI, Senior JR. Using controlled clinical trials to learn more about acute drug-induced liver injury. Hepatology. 2008;48:1680–1689. doi: 10.1002/hep.22633. [DOI] [PubMed] [Google Scholar]
- 34.Antoine DJ. Molecular forms of HMGB1 and keratin-18 as mechanistic biomarkers for mode of cell death and prognosis during clinical acetaminophen hepatotoxicity. 2012. J. Hepatol; e-pub ahead of print 17 January 2012. [DOI] [PMC free article] [PubMed] [Retracted]
- 35.Kroh EM, Parkin RK, Mitchell PS, Tewari M. Analysis of circulating microRNA biomarkers in plasma and serum using quantitative reverse transcription-PCR (qRT-PCR) Methods. 2010;50:298–301. doi: 10.1016/j.ymeth.2010.01.032. [DOI] [PMC free article] [PubMed] [Google Scholar]
Associated Data
This section collects any data citations, data availability statements, or supplementary materials included in this article.