

Abstract
Adipose stromal cells proliferate and differentiate into adipocytes, providing a valuable model system for studies of adipocyte biology. We compared differentiation protocols for human preadipocytes and report on their metabolic phenotypes. By simply prolonging the adipogenic induction period from the first 3 days to 7 days, the proportion of cells (passage 5–6) acquiring adipocyte morphology increased from 30–70% to over 80% in human subcutaneous preadipocytes. These morphological changes were accompanied by increases in the adipogenic marker expression and improved adipocyte metabolic phenotypes: enhanced responses to beta-adrenergically-stimulated lipolysis and to insulin-stimulated glucose metabolism into triglyceride. Confirming previous studies, FBS dose-dependently inhibited adipogenesis. However, in subcutaneous preadipocytes that differentiate well (donor-dependant high capacity and subcultured fewer than 2 times), the use of 7d-induction protocols in both 3% FBS and serum-free conditions allowed >80% differentiation. Responsiveness to β-adrenergically stimulated lipolysis was lower in 3% FBS. Rates of insulin-stimulated glucose uptake were higher in adipocytes differentiated with 3% FBS, while the sensitivity to insulin was almost identical between the two groups. In summary, extending the length of the induction period in adipogenic cocktail improves the degree of differentiation and responses to key metabolic hormones. This protocol permits functional analysis of metabolic phenotypes in valuable primary human adipocyte cultures through multiple passages.
Introduction
Obesity, defined as accumulation of excess adipose tissue, is increasing worldwide. Alterations in adipose tissue metabolic and endocrine function are thought to play key roles in the pathogenesis of obesity and related metabolic diseases. Thus, there is a growing interest in understanding mechanisms of adipocyte differentiation and function. While the most widely used model, 3T3-L1 (mouse embryonic fibroblasts) has been exceptionally valuable, no human adipocyte cell line is yet available. Thus, the cultures of primary human adipose stromal cells are increasingly used for translational research. Primary cells are useful for assessing donor dependent effects on cell proliferation and differentiation (sex, age, obesity, etc) (1–6) that cannot be studied with cell lines. In addition, adipose stromal cells are highly enriched in preadipocytes and can be cryopreserved for a long time, with minimal loss of proliferation and differentiation capacity. The limitations however, are the restricted access to human adipose tissue and the small amount of biopsy material often available. Thus, extensive subculturing is required to acquire sufficient numbers of cells for many functional studies. However, differentiation capacity is known to decrease with subculturing in serum containing media (7, 8). In addition, for basic functional studies, donor dependent variations in the degree of differentiation confound analysis of inter-individual differences in metabolic outcomes.
In standard protocols for human preadipocytes, adipogenic induction cocktail contains insulin, glucocorticoids (GC), and 1-methyl-3-isobutylxanthine (IBMX) (9, 10). Thiazolidinediones (TZD), PPARγ agonists, are often used to improve the degree of differentiation. In commonly used protocols (9, 10), IBMX and TZD are present only during the initial 3 day induction period, then the media is switched to a maintenance media that often contains insulin and GC for up to 20 days. Longer periods of induction are also used and may actually improve differentiation degree (10–13). The use of serum during differentiation is inconsistent in the literature. While some investigators use serum-free media (4, 14–16), others use 3 to 10% FBS containing media during differentiation (10, 17). Although serum is known to decrease differentiation degree (9, 14), no previous studies systematically compared different differentiation protocols and their effects on the degree of differentiation and metabolic phenotypes of the newly-differentiated adipocytes. With the long-term goal of establishing conditions to compare depot- and sex-specific differences in adipocyte function, we modified differentiation protocols to maximize differentiation degree and hormonal sensitivity and responsiveness of key metabolic pathways. Specifically, we varied the duration of induction period and the amount of FBS supplemented during adipogenesis with regard to standard measures of differentiation degree and metabolic properties of newly-differentiated adipocytes.
Materials and Methods
Materials
All chemicals were purchased from Sigma, except Rosiglitazone (Merck) and recombinant human insulin (Lilly). Collagenase type I was purchased from Worthington. Fetal bovine serum (FBS) and culture media were obtained from Invitrogen. Sterile plastic wares for tissue culture were purchased from Corning and BD Bioscience.
Subjects
Adipose tissues were obtained from 9 subjects (mean age 44.8±3.5 years and BMI 32.8 ±2.7 kg/m2) during abdominal surgeries for severe obesity, panniculectomy in reduced obesity or benign gynecological conditions. The protocol was approved by Institutional Review Board of Boston University Medical Center. All subjects provided informed consent.
Adipose tissue handling and isolation of stromal vascular cells (SVC)
Adipose tissue was transferred to the lab in medium 199 at room temperature. After mincing into approximately 5 to 10 mg fragments, tissue was digested with collagenase (type 1, 1 mg/ml in HBSS) for 2 hours at 37ºC with shaking (100 rpm) (9). The mixture was passed through a 250 micron mesh, centrifuged at 500g for 10 minutes and floating adipocytes were discarded. Cell pellets were treated with erythrocyte lysis buffer (0.154mM NH4Cl, 10 mM K2HPO4 and 0.1 mM EDTA, pH 7.3) for 10 min at room temperature. After discarding the supernatant, cells were repelleted with centrifugation, resuspended in growth media (α-MEM with 10% FBS, 100 units/ml penicillin and 100 μg/ml streptomycin) and then plated. On the following day, cells were washed with PBS and replenished with growth media. At 70~80% confluence, cells were either subcultured or frozen (10% DMSO supplemented growth media) for cryopreservation.
Differentiation of stromal cells into adipocytes
2d after reaching confluence, cells were differentiated in a serum-free complete differentiation media (DMEM/F12 with 0.5 mM IBMX, 100 nM insulin, 100 nM dexamethasone, 2 nM T3, 10 μg/ml transferrin, 1 μM Rosiglitazone, 33 μM biotin and 17 μM pantothenic acid) (9, 10). After induction in the complete differentiation media (3, 7 or 11 days), cells were maintained in DMEM/F12 with insulin (10 nM) and dexamethasone (10 nM) until harvest or use for metabolic experiments (d14 to d17). There was no evidence of cell toxicity due to the longer induction protocol as judged by the release of the intracellular enzyme LDH (data not shown). For testing the effects of FBS on adipogenesis, 0, 1, 3, 5 or 10% FBS was added to differentiation and maintenance media.
Oil Red O and DAPI staining
Formation of lipid droplets was observed by phase contrast microscopy (Nikon) after staining with Oil Red O (10). Nuclei were stained with DAPI (18).
DNA and total lipid quantification
Cells were scraped in PBS for DNA and TG assays. DNA quantity was measured with Quant-iT™ PicoGreen dsDNA reagent (Invitrogen) and TG was determined using a Triglyceride Determination Kit (Sigma).
Lipolysis
On the day of experiment, adipocytes were starved of hormones and serum by switching media to DMEM/F12 without any supplementation for 3 to 4 hours. Lipolytic rates were measured during 2h incubation in Krebs Ringer bicarbonate (KRB) buffer containing 4% bovine serum albumin (BSA) under basal and β-adrenergically-stimulated conditions. Adenosine deaminase (ADA) and phenylisopropyl adenosine (PIA) were added to standardize any potential variations in adenosine levels (19). Basal lipolytic rates were defined as ADA (1 units/ml)+PIA (20 nM) (20) and stimulated-lipolysis were measured with isoproterenol (10−6 M). Glycerol concentration in the incubation media was measured fluormetrically in neutralized perchloric acid extracts (20).
Glucose conversion into triacylglyceride (TG)
After serum or hormone starvation in DMEM/F12 for 3 to 4 hours, differentiated adipocytes were incubated for 2 hours with 0.5 μCi/ml 14C-glucose in M199+1% BSA (5 mM glucose) in basal or insulin-stimulated (3 nM) conditions. After incubation, cells were carefully washed with PBS to remove unincorporated glucose and total lipid was extracted with Dole’s methods (21). Aliquots of the upper heptane phase containing TG were transferred to scintillation vials. After evaporating the heptane, 4 ml of scintillation fluid was added and radioactivity was counted in a scintillation counter (Perkin Elmer).
Glucose uptake
Uptake of 2-deoxy-d-[14C]glucose ([14C]2-DOG) was measured at 5 different insulin concentrations (0, 60, 120, 600, 3000 pM) to establish dose responses. Differentiated adipocytes were washed with PBS and incubated at 37 °C for 3 hours in Krebs Ringer HEPES (KRH) buffer plus 0.01% BSA and 5 mM glucose for insulin and serum starvation. Then the adipocytes were preincubated for 30 min at 37°C with KRH buffer without glucose with insulin, 2-DOG mixture (0.25 μCi/ml [14C]2-DOG and 0.2 mM unlabeled 2-DOG) was added and incubated for a further 10 min. Cells were washed 3 times with ice-cold PBS and harvested in 1 ml of Triton X-100 lysis buffer (1% Triton X-100, 20 mM Tris, and 150 mM NaCl). Cell lysates were transferred to scintillation vials and radioactivity was counted after adding scintillation fluid.
RNA extraction and gene expression
Total RNA was extracted using Trizol (Invitrogen). RNA quantity and quality were assessed spectrophotometrically (Nano-Drop). Total RNA (0.5~1 μg) was reverse transcribed using Transcriptor First Strand cDNA synthesis kit (Roche) and qPCR was performed on Light Cycler 480 (Roche) with Taqman probes (Applied Biosystems). 18S and cyclophilin A (PPIA) were used as reference genes. Expression levels relative to 18S are presented.
Immunoblotting
Cells were washed with ice-cold PBS and scraped into cell lysis buffer (Cell Signaling) supplemented with 5% SDS and protease inhibitor cocktails (Pierce). Cell lysates were incubated in 37°C water bath for 1 hour with vortexing every 5 to 10 min to extract lipid droplet proteins and then centrifuged at 14000g for 10 min. 5~10 μg proteins was resolved in 10% or 15% Tris-HCl gels (Biorad), transferred to PVDF membranes, and blocked in 5% milk. Then blots were probed for adiponectin (BD Biosciences), FABP4 (Dr. J. Storch at Rutgers University), perilipin (Dr. A. Greenberg at Tufts University) and loading controls (α-tubulin and RNA Pol II, Santa Cruz). Images were captured using a Luminescent Image Analyzer (LAS4000, Fuji).
Statistics
Data were expressed as mean ± SE. Differences between groups were determined by analysis of variance with repeated measures and Student t-test using GraphPad Prism.
Results
Longer exposure to differentiation cocktail increased the proportion of cells acquiring adipocyte morphology
30–70% of human subcutaneous preadipocytes (subcultured 5 to 6 times) acquire adipocyte morphology with 3d-induction in a serum-free differentiation cocktail (9). Longer periods of induction is also used and suggested to improve differentiation degree (10–13). To compare the protocols, 2d post-confluent predipocytes were induced to differentiate in serum-free complete differentiation media (CDM) for 3, 7 or 11 days and then maintained in the maintenance media (MM) till harvest (Fig 1A). When cells were exposed to the adipogenic media for longer periods, the proportion of cells acquiring adipocyte morphology was increased (Fig 1B). With 7d-induction protocol, >80% degree of differentiation was achieved in about 90% of subcutaneous preadipocytes that were subcultured 5 to 6 times (45 out of 50 subjects that we studied over the past three years).
Figure 1. Enhanced adipogenesis of human preadipocytes with longer induction protocols.

A. Schematic presentation of differentiation protocols. 2d post-confluent human adipose stromal cells (subcultured 5 to 6 times) were induced to differentiate in serum-free complete differentiation media (CDM) for 3, 7 or 11 days and then maintained in maintenance media (MM) till harvest. B. Differentiated adipocytes were fixed in 10% formalin and stained for lipid droplets with Oil Red O (a, b, c) and nuclei with DAPI (a’, b’, c’). DNA quantity per well (C) and expression levels of adipogenic makers at the mRNA (D-F) and protein (G) levels, were measured before (0’) and after differentiation. *, p<0.05, **, p<0.01 compared to 3d-induction protocol, n=4 to 7.
Because we noticed there were fewer cells with the 3d-induction protocol, DNA quantity was measured. Compared to 0’ (before differentiation), DNA per well tended to be lower in adipocytes differentiated with 3d-induction protocol (p=0.06, n=7), suggesting cell loss during differentiation (Fig 1C). However, DNA quantity in adipocytes differentiated with longer induction protocols (7d or 11d) was similar to 0’, and higher than 3d-induction group (p<0.05 for both 7d and 11d, n=7).
As expected from the improved morphology and lipid accumulation, expression of adipogenic genes were higher in adipocytes differentiated for the 7d- or 11d- compared to 3d-induction protocol both at the mRNA (LPL and FABP4) and protein levels (perilipin, adiponectin and FABP4) (Fig 1D-G). However, PPARγ mRNA levels were not statistically different between the three groups.
Adipocytes differentiated with longer induction protocol exhibited enhanced responses to β-adrenergically-stimulated lipolysis and to insulin-stimulated glucose metabolism
Basal lipolytic rates were similar in all three groups. Isoproterenol-stimulated lipolytic rates however, were lower in adipocytes differentiated with 3d-protocol than the other two (Fig 2A). Thus, fold stimulation by isoproterenol was lower in adipocytes differentiated with 3d-induction protocol (3.5-fold in 3d vs. 6.7-fold in 7d or 6.3-fold 11d-induction protocols, respectively, p<0.05, n=4). Adipocytes differentiated with 7d- and 11d-induction protocols exhibited similar lipolytic rates.
Figure 2. Improved metabolic phenotypes in adipocytes differentiated with longer induction protocols.
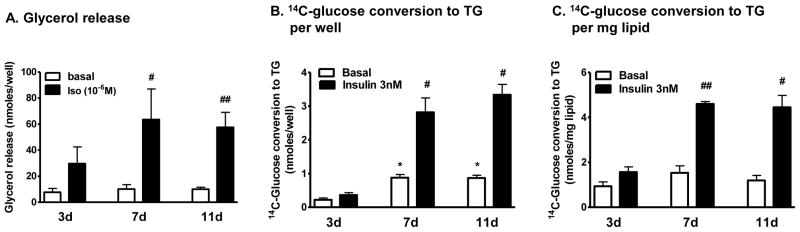
A. Lipolytic rates, in the basal and stimulated (isoproterenol, 10−6 M) conditions, were measured in KRB+4% BSA after differentiation. Data was expressed nmoles glycerol released per well. #, p<0.05 and ##, p<0.01 compared to 3d-protocol in isoproterenol condition. B & C. 14C-glucose metabolism into TG, in the basal and insulin-stimulated (3 nM) states, was measured after 3 to 4 hours of hormone starvation. Data was expressed per well (B) or per mg lipid (C). *, p<0.05 compared to 3d-induction protocol in control condition; #, p<0.05 and ##, p<0.01 compared to 3d-protocol in isoproterenol condition, n=5.
Expressed per well, rates of glucose conversion to triglyceride (TG), both in the basal and insulin-stimulated conditions, were lower in adipocytes differentiated with 3d-induction protocol (Fig 2B, p<0.05, n=4). However, when the data was expressed per mg lipid the basal rates were not different between the three groups (Fig 2C). Regardless whether the data was expressed per well or lipid amount, cells differentiated with the 3d protocol exhibited lower responses to insulin: insulin stimulated glucose metabolism into TG by only 1.8±0.2 fold in 3d- compared to 3.4±0.6 fold in 7d- and 3.9±0.3 fold in 11d-protocol (p<0.05, n=4).
FBS dose-dependently inhibited human preadipocyte differentiation
Both serum-free (4, 14–16) and serum-supplemented (10, 17) conditions are used during differentiation of human preadipocytes. To test the effects of FBS on the adipogenesis and the metabolic phenotypes of adipocytes after differentiation, preadipocytes were differentiated in various amounts of FBS supplemented media, 0, 1, 3, 5, or 10% (Fig 3A). FBS dose-dependently decreased the degree of differentiation (Fig 3B). When preadipocytes that differentiate well (donor-dependant or subcultured for less than 2 passages) along with 7d-induction protocol were used, up to 3% FBS supplementation did not significantly affect the proportion of cells acquiring adipocyte morphology, while 5 or 10% FBS inhibited adipogenesis confirming previous studies (9, 14). Adipocytes differentiated in FBS supplemented conditions differed morphologically, with a more elongated shape compared to the more spherical shapes in adipocytes differentiated in serum-free condition.
Figure 3. FBS dose-dependently inhibited differentiation of human preadipocytes.

A. Schematic presentation of differentiation protocols. B. After differentiation, lipid droplets (Oil Red O; a, b, c) and nuclei (DAPI; a’, b’, c’) were stained. DNA quantity per well (C) and expression levels of adipogenic markers were measured at the mRNA (D-F) and protein (G) levels before (0’) and after differentiation. *, p<0.05, **, p<0.01, compared to serum-free condition (0% FBS), n=5 to 7.
FBS supplementation during differentiation dose-dependently increased DNA quantity in adipocytes compared to preadipocytes (0’), suggesting it stimulated cell proliferation during adipogenesis (Fig 3C). DNA quantities in differentiated adipocytes were also higher in FBS supplemented than serum-free condition. Consistent with the morphological differences, FBS dose-dependently inhibited adipogenic gene expression (Fig 3D-G).
Higher basal but similar β-adrenergically-stimulated lipolytic rates in adipocytes differentiated with 3% FBS
We compared metabolic characteristics of adipocytes after differentiating in serum-free or 3% FBS supplemented condition, as these two are most commonly used. For these metabolic studies, we used cultures that differentiated more than 80% in both conditions. Basal lipolytic rates (per well) were 3 times higher in adipocytes differentiated in 3% FBS condition, while beta-adrenergically-stimulated lipolytic rates were similar between the two groups (Fig 4A). The fold stimulation by isoproterenol was lower in adipocytes differentiated with 3% FBS (8±0.8 fold in serum-free vs. 3±0.5 fold in 3% FBS, p<0.001, n=4).
Figure 4. Comparison of metabolic phenotypes of adipocytes after differentiation in serum-free or 3% FBS supplemented condition.
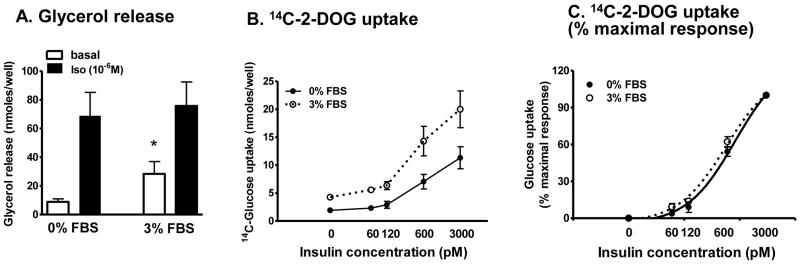
A. Lipolytic rates, in the basal and isoproterenol-stimulated (10−6 M) states, were measured in KRB+4% BSA after 3 to 4 hours hormone and serum starvation. *, p<0.05 serum-free vs. 3% FBS, n=4. B. The rates of 14C-2-deoxy-glucose (2-DOG) uptake were measured after 3 to 4 hours of insulin and serum starvation at 0, 60, 120, 600, 3000 pM insulin concentrations. C. Data from 4B were normalized by setting the value with no insulin to 0% and at 3000 pM insulin to 100% effect in each experiment.
Similar insulin sensitivity in adipocytes differentiated in serum-free and 3% FBS supplemented condition
Absolute rates of 2-DOG uptake, regardless whether data was expressed per well or cell numbers, were higher in adipocytes differentiated with 3% FBS than serum-free condition at all insulin concentrations tested (Fig 4B). To examine if the adipocytes exhibited different sensitivities to insulin stimulated glucose uptake, % maximal response was calculated from the data in 4B. As shown in Fig 4C, the curves were almost identical, demonstrating similar insulin sensitivities between the two groups.
Discussion
The relatively easy access to human subcutaneous adipose tissue and simple isolation procedures provide a clear advantage for research that addressing the metabolic capacities of adipocytes from different donors. To optimize procedures for the use of preadipocyte cultures through multiple passages, we varied induction period and the tested the influence of FBS on the degree of differentiation and metabolic phenotypes. As demonstrated here, by increasing the adipogenic induction period from 3d to 7d or longer, we improved differentiation degree from ~30–70% to >80%. In fact in our experience over the past 5 years, the longer, 7d-induction protocol lead to at least 80% differentiation in 45 of 50 cultures of human subcutaneous preadipocytes that subcultured 5 to 6 times. The longer induction was especially helpful for preadipocyte cultures that do not differentiate well with 3d-induction protocol (unpublished observations). Tchkonia et al previously demonstrated that two preadipocyte subtypes with different replication and differentiation capacity, and adipogenic transcription factor expression are found in cultures derived from human adipose tissue (22). One subpopulation may be at an advanced stage with higher expression levels of adipogenic transcription factors. These cells differentiate well and do not require strong stimuli whereas the other population may need longer programming. It is likely that longer induction protocol promotes adipogenesis of preadipocytes that are initially less committed to this pathway, but further studies are needed to test this hypothesis.
An important aspect of our study is that we characterized the metabolic phenotypes of newly-differentiated human adipocytes as well as morphological changes. Better differentiated adipocytes with the longer induction protocol exhibited improved metabolic phenotypes as judged by enhanced responses to isoproterenol-stimulated lipolysis and insulin-induction of glucose metabolism into TG. Thus, the morphological changes were accompanied by acquisition of functional properties of mature adipocytes. Similar to our results, a previous study reported that responses to noradrenaline-induced lipolysis positively correlate with the degree of differentiation (23). The ED50s for anti-lipolytic actions of insulin in newly-differentiated subcutaneous human adipocytes were around 10–30 pM (unpublished observation, MJL and SKF). The ED50s for insulin stimulation of glucose uptake was around 100–300 pM in the current study. These values are similar to those measured in freshly-isolated adipocytes (20, 24) and within physiological range, demonstrating that the newly-differentiated adipocytes in culture provide a good model system for human adipocyte metabolism and hormonal sensitivity.
Protocols to proliferate and differentiate human preadipocytes vary among laboratories. There are discrepancies in differentiation protocols, especially in regard to the use of FBS. The majority of published papers use 10% FBS supplemented DMEM/F12, α-MEM or DMEM as growth media and a previous study reported that proliferation of preadipocytes in reduced serum media consisting of 2.5% FBS, 10 ng/mL epidermal growth factor, 1 ng/mL basic fibroblast growth factor, and 8.7 μM insulin) preserves differentiation capacity (8). Both serum-free (4, 14–16) and supplemented (10, 17) conditions are used during differentiation of human preadipocytes. The two most commonly used differentiation protocols in the literature use serum-free or 3% FBS supplemented condition. Thus, we compared the metabolic phenotypes of adipocytes after differentiation using these two protocols. To minimize the effects of the degree of differentiation on adipocyte metabolism, we used cells that differentiate well (donor dependant high capacity and subcultured fewer than two times) for these studies. Although maximally-stimulated lipolytic rates were similar, basal lipolytic rates (per well) were 3 times higher in adipocytes differentiated in 3% FBS and thus, decreasing the responses to isoproterenol. Cell numbers per well were higher in the 3% FBS group (~25%), but this difference did not completely explain the higher basal lipolytic rates. Intriguingly, although the absolute rates of glucose uptake were higher in 3% FBS condition, adipocytes differentiated with both protocols have similar insulin sensitivities to the insulin-stimulation of glucose uptake. Collectively, our data demonstrate that FBS affects the metabolic phenotypes of adipocytes as well as the degree of differentiation.
Hauner’s group showed that serum is not required for survival of human preadipocytes during adipogenesis and exposure to serum actually inhibits differentiation (9, 14, 25), and we confirm these results herein. When our modified 7d-induction protocol along with well-differentiating preadipocytes were used, up to 3% FBS did not significantly affect adipogenesis. However, when we used preadipocytes that generally do not differentiate well (higher passages or donor-dependent low differentiation capacity), the inhibitory effects of FBS were much more pronounced and even 1% FBS completed blocked adipogenic conversion (unpublished observation (MJL), data not shown). Similarly, differentiation of rat primary preadipocytes also does not require FBS and FBS supplementation decreases adipogenic differentiation (26). Conflicting results are reported for 3T3-L1 culture. 3T3-L1 cells do not survive in the absence of FBS and FBS induces adipogenic conversion of 3T3-L1 (27). In contrast, others reported that 3T3-L1 can be differentiated in the absence of FBS (28, 29).
When FBS supplemented media was used during differentiation, DNA quantity per well actually increased after differentiation, reflecting proliferation during adipogenesis. While post-confluent mitosis is linked to the adipogenic conversion and may be required for adipogenesis in 3T3-L1 (28, 30, 31), human primary preadipocytes do not require cell division to enter differentiation (14). Our data demonstrating greater differentiation under serum-free conditions without alterations in DNA quantity support these previous findings. Primary preadipocytes may have gone through critical DNA replication in vivo and at an advanced stage of adipocyte development as previously suggested (14).
In summary, by simply exposing preadipocytes to differentiation cocktail for longer periods, we increased the degree to which human adipose stromal cells differentiate. Importantly, we show that the improvements in gene expression are accompanied by improved responses to beta-adrenergically-stimulated lipolysis and to the insulin-stimulation of glucose conversion to TG. This simple modification may further facilitate in vitro studies of the metabolic properties of human adipocytes from human subjects as a function of genotype or clinical characteristics.
Acknowledgments
This work was supported by NIH (DK-52398, DK-080448, and P30 DK-046200) to SKF. MJL and SFK take full responsibility for this article.
Footnotes
Disclosure
We do not have any potential conflicts of interest relevant to this article.
References
- 1.Djian P, Roncari AK, Hollenberg CH. Influence of anatomic site and age on the replication and differentiation of rat adipocyte precursors in culture. J Clin Invest. 1983;72(4):1200–8. doi: 10.1172/JCI111075. [DOI] [PMC free article] [PubMed] [Google Scholar]
- 2.van HV, Skurk T, Rohrig K, et al. Effect of BMI and age on adipose tissue cellularity and differentiation capacity in women. Int J Obes Relat Metab Disord. 2003;27(8):889–95. doi: 10.1038/sj.ijo.0802314. [DOI] [PubMed] [Google Scholar]
- 3.Hauner H, Entenmann G. Regional variation of adipose differentiation in cultured stromal-vascular cells from the abdominal and femoral adipose tissue of obese women. Int J Obes. 1991;15(2):121–6. [PubMed] [Google Scholar]
- 4.Tchkonia T, Giorgadze N, Pirtskhalava T, et al. Fat depot origin affects adipogenesis in primary cultured and cloned human preadipocytes. Am J Physiol Regul Integr Comp Physiol. 2002;282(5):R1286–R1296. doi: 10.1152/ajpregu.00653.2001. [DOI] [PubMed] [Google Scholar]
- 5.Kirkland JL, Hollenberg CH, Kindler S, Gillon WS. Effects of age and anatomic site on preadipocyte number in rat fat depots. J Gerontol. 1994;49(1):B31–B35. doi: 10.1093/geronj/49.1.b31. [DOI] [PubMed] [Google Scholar]
- 6.Isakson P, Hammarstedt A, Gustafson B, Smith U. Impaired preadipocyte differentiation in human abdominal obesity: role of Wnt, tumor necrosis factor-alpha, and inflammation. Diabetes. 2009;58(7):1550–7. doi: 10.2337/db08-1770. [DOI] [PMC free article] [PubMed] [Google Scholar]
- 7.Hauner H, Schmid P, Pfeiffer EF. Glucocorticoids and insulin promote the differentiation of human adipocyte precursor cells into fat cells. J Clin Endocrinol Metab. 1987;64(4):832–5. doi: 10.1210/jcem-64-4-832. [DOI] [PubMed] [Google Scholar]
- 8.Skurk T, Ecklebe S, Hauner H. A novel technique to propagate primary human preadipocytes without loss of differentiation capacity. Obesity (Silver Spring) 2007;15(12):2925–31. doi: 10.1038/oby.2007.349. [DOI] [PubMed] [Google Scholar]
- 9.Hauner H, Skurk T, Wabitsch M. Cultures of human adipose precursor cells. Methods Mol Biol. 2001;155:239–47. doi: 10.1385/1-59259-231-7:239. [DOI] [PubMed] [Google Scholar]
- 10.Yu G, Floyd ZE, Wu X, et al. Adipogenic differentiation of adipose-derived stem cells. Methods Mol Biol. 2011;702:193–200. doi: 10.1007/978-1-61737-960-4_14. [DOI] [PubMed] [Google Scholar]
- 11.Fischer-Posovszky P, Newell FS, Wabitsch M, Tornqvist HE. Human SGBS cells - a unique tool for studies of human fat cell biology. Obes Facts. 2008;1(4):184–9. doi: 10.1159/000145784. [DOI] [PMC free article] [PubMed] [Google Scholar]
- 12.Dicker A, Ryden M, Naslund E, et al. Effect of testosterone on lipolysis in human pre- adipocytes from different fat depots. Diabetologia. 2004;47(3):420–8. doi: 10.1007/s00125-003-1324-0. [DOI] [PubMed] [Google Scholar]
- 13.Skurk T, Hauner H. Primary culture of human adipocyte precursor cells: expansion and differentiation. Methods Mol Biol. 2012;806:215–26. doi: 10.1007/978-1-61779-367-7_15. [DOI] [PubMed] [Google Scholar]
- 14.Entenmann G, Hauner H. Relationship between replication and differentiation in cultured human adipocyte precursor cells. Am J Physiol. 1996;270(4 Pt 1):C1011–C1016. doi: 10.1152/ajpcell.1996.270.4.C1011. [DOI] [PubMed] [Google Scholar]
- 15.Shahparaki A, Grunder L, Sorisky A. Comparison of human abdominal subcutaneous versus omental preadipocyte differentiation in primary culture. Metabolism. 2002;51(9):1211–5. doi: 10.1053/meta.2002.34037. [DOI] [PubMed] [Google Scholar]
- 16.Deslex S, Negrel R, Vannier C, Etienne J, Ailhaud G. Differentiation of human adipocyte precursors in a chemically defined serum-free medium. Int J Obes. 1987;11(1):19–27. [PubMed] [Google Scholar]
- 17.Bunnell BA, Flaat M, Gagliardi C, Patel B, Ripoll C. Adipose-derived stem cells: isolation, expansion and differentiation. Methods. 2008;45(2):115–20. doi: 10.1016/j.ymeth.2008.03.006. [DOI] [PMC free article] [PubMed] [Google Scholar]
- 18.Chazotte B. Labeling nuclear DNA using DAPI. Cold Spring Harb Protoc. 2011;(1):db. doi: 10.1101/pdb.prot5556. [DOI] [PubMed] [Google Scholar]
- 19.Honnor RC, Dhillon GS, Londos C. cAMP-dependent protein kinase and lipolysis in rat adipocytes. I. Cell preparation, manipulation, and predictability in behavior. J Biol Chem. 1985;260(28):15122–9. [PubMed] [Google Scholar]
- 20.Fried SK, Tittelbach T, Blumenthal J, et al. Resistance to the antilipolytic effect of insulin in adipocytes of African-American compared to Caucasian postmenopausal women. J Lipid Res. 2010;51(5):1193–200. doi: 10.1194/jlr.P000935. [DOI] [PMC free article] [PubMed] [Google Scholar]
- 21.DOLE VP. A relation between non-esterified fatty acids in plasma and the metabolism of glucose. J Clin Invest. 1956;35(2):150–4. doi: 10.1172/JCI103259. [DOI] [PMC free article] [PubMed] [Google Scholar]
- 22.Tchkonia T, Tchoukalova YD, Giorgadze N, et al. Abundance of two human preadipocyte subtypes with distinct capacities for replication, adipogenesis, and apoptosis varies among fat depots. Am J Physiol Endocrinol Metab. 2005;288(1):E267–E277. doi: 10.1152/ajpendo.00265.2004. [DOI] [PubMed] [Google Scholar]
- 23.Dicker A, Astrom G, Sjolin E, Hauner H, Arner P, van HV. The influence of preadipocyte differentiation capacity on lipolysis in human mature adipocytes. Horm Metab Res. 2007;39(4):282–7. doi: 10.1055/s-2007-973812. [DOI] [PubMed] [Google Scholar]
- 24.Lystedt E, Westergren H, Brynhildsen J, et al. Subcutaneous adipocytes from obese hyperinsulinemic women with polycystic ovary syndrome exhibit normal insulin sensitivity but reduced maximal insulin responsiveness. Eur J Endocrinol. 2005;153(6):831–5. doi: 10.1530/eje.1.02027. [DOI] [PubMed] [Google Scholar]
- 25.Nagasaki H, Shang Q, Suzuki T, et al. Low-serum culture system improves the adipogenic ability of visceral adipose tissue-derived stromal cells. Cell Biol Int. 2011;35(6):559–68. doi: 10.1042/CBI20100406. [DOI] [PubMed] [Google Scholar]
- 26.Deslex S, Negrel R, Ailhaud G. Development of a chemically defined serum-free medium for differentiation of rat adipose precursor cells. Exp Cell Res. 1987;168(1):15–30. doi: 10.1016/0014-4827(87)90412-5. [DOI] [PubMed] [Google Scholar]
- 27.Kuri-Harcuch W, Green H. Adipose conversion of 3T3 cells depends on a serum factor. Proc Natl Acad Sci U S A. 1978;75(12):6107–9. doi: 10.1073/pnas.75.12.6107. [DOI] [PMC free article] [PubMed] [Google Scholar]
- 28.Schmidt W, Poll-Jordan G, Loffler G. Adipose conversion of 3T3-L1 cells in a serum-free culture system depends on epidermal growth factor, insulin-like growth factor I, corticosterone, and cyclic AMP. J Biol Chem. 1990;265(26):15489–95. [PubMed] [Google Scholar]
- 29.Hauner H. Complete adipose differentiation of 3T3 L1 cells in a chemically defined medium: comparison to serum-containing culture conditions. Endocrinology. 1990;127(2):865–72. doi: 10.1210/endo-127-2-865. [DOI] [PubMed] [Google Scholar]
- 30.Pairault J, Green H. A study of the adipose conversion of suspended 3T3 cells by using glycerophosphate dehydrogenase as differentiation marker. Proc Natl Acad Sci U S A. 1979;76(10):5138–42. doi: 10.1073/pnas.76.10.5138. [DOI] [PMC free article] [PubMed] [Google Scholar]
- 31.Kuri-Harcuch W, Marsch-Moreno M. DNA synthesis and cell division related to adipose differentiation of 3T3 cells. J Cell Physiol. 1983;114(1):39–44. doi: 10.1002/jcp.1041140107. [DOI] [PubMed] [Google Scholar]