

Abstract
Most structures within the central nervous system (CNS) are composed of different types of neuron that vary in both number and morphology, but relatively little is known about the interplay between these two features, i.e. about the population dynamics of a given cell type. How such arrays of neurons are distributed within a structure, and how they differentiate their dendrites relative to each other, are issues that have recently drawn attention in the invertebrate nervous system, where the genetic and molecular underpinnings of these organizing principles are being revealed in exquisite detail. The retina is one of the few locations where these principles have been extensively studied in the vertebrate CNS, indeed, where the design principles of “mosaic regularity” and “uniformity of coverage” were first explicitly defined, quantified, and related to each other. Recent studies have revealed a number of genes that influence the formation of these histotypical features in the retina, including homologues of those invertebrate genes, although close inspection reveals that they do not always mediate comparable developmental processes nor elucidate fundamental design principles. The present review considers just how pervasive these features of “mosaic regularity” and “uniform dendritic coverage” are within the mammalian retina, discussing the means by which such features can be assessed in the mature and developing nervous system and examining the limitations associated with those assessments. We then address the extent to which these two design principles co-exist within different populations of neurons, and how they are achieved during development. Finally, we consider the neural phenotypes obtained in mutant nervous systems, to address whether a prospective gene of interest underlies those very design principles.
Keywords: regularity, patterning, effective radius, packing factor, autocorrelation, Voronoi domain, nearest neighbour, dendritic field, tiling, coverage
I. INTRODUCTION
The past two decades have witnessed great strides in our knowledge of the developmental mechanisms producing the mature architecture and connectivity of the brain. For example, we have some understanding of the early patterning that occurs within the developing central nervous system (CNS), regulating gene expression to move tissues towards various fates (Kiecker & Lumsden, 2012). We now appreciate how cell-cycle kinetics and exit decisions influence the proliferative phase expanding the wall of the neural tube, establishing the size of a founder population of cells making up a particular structure (Willardsen & Link, 2011). Likewise, we know that cell fate decisions within a tissue are commanded by hierarchical transcription factor codes modulating cellular competence and determination (Guillemot, 2007). Such newborn neuroblasts migrate via a variety of mechanisms that include cell-surface or secreted proteins that may support, attract or repel young neurons (Solecki, 2012). The environmental determinants of nerve cell differentiation, in turn, have been identified for various populations of neurons, and the signals and their reception mediating neurite outgrowth and pathfinding are being understood in increasingly molecular detail (Cheng & Poo, 2012). The interactions between the pre- and post-synaptic membrane are also being elucidated as synaptogenesis occurs, and how those initial rudimentary interactions yield synaptic maturation or elimination in the presence of multiple afferents (Waites, Craig & Garner, 2005). Cell death also contributes to the final organization of a brain structure, controlled by afferent, target and glial interactions that modulate intracellular signalling pathways affecting cell survival as well as by cell-intrinsic factors (Dekkers & Barde, 2013). Doubtless the full complexities of these issues remain to be elucidated, but we can now provide a richer description of the developmental processes that underlie the creation of many structures within the brain, a knowledge base that should inform the emerging field of neural regenerative medicine.
Despite these advances, we have relatively little appreciation for the population dynamics associated with a given neuronal cell type. How do these neurons position themselves relative to one another, and what is the relationship between their differentiating dendritic arbors within a structure? For instance, a population of neurons arising from the ventricular zone must then migrate to, and settle within, a nuclear or cortical domain, but the determinants of their positioning within those structures are largely undefined. At one extreme, a population of neurons settling within a structure may be packed so densely that the cells are positioned side-by-side, for example, in the granule cell layer in the cerebellum, and there is little mystery to their positioning. At the other, many types of nerve cell comprise a minority of the local population and the average spacing between like-type neighbours is conspicuous, yet we do not know whether any higher-order lattice-like patterning is present, or whether such cells are randomly distributed within the volume, constrained only by their physical size. Such different outcomes in neuronal spacing might be expected to relate to the way in which their dendrites are distributed, but here too, little is known about populations of dendritic arbors. While the detailed dendritic morphology of particular neuronal types has been extensively characterized in various parts of the CNS, there is little direct evidence relating that morphology of an individual type of cell to the population of like-type neighbours, let alone how they interact during their differentiation to achieve that arrangement in maturity. One simple conceptualization is that they should engage in contact inhibition to ensure that every location within a volume of tissue is subserved by the dendritic arbor of a single cell, yet there is little concrete evidence for this in the vertebrate brain. They might just as well show indifference to their like-type neighbours, and modulate their growth only in relation to the afferents with which they form synaptic connections, for it is this connectivity that ultimately matters for brain function.
In fact, one part of the central nervous system has been studied extensively to address these questions, the retina. The retina, being an embryonic outgrowth of the developing brain, is particularly well-suited for addressing such issues at the population level, since retinal nerve cells and their processes are typically restricted to discrete cellular and synaptic layers, thereby aiding in their visualization in the entire volume of tissue. Indeed, these population issues of cellular patterning and dendritic overlap were largely outlined first within the retina, where particular types of retinal nerve cells were observed to be regularly distributed and to exhibit uniform dendritic coverage (Wässle, Peichl & Boycott, 1978; Wässle & Riemann, 1978), although they have been described in other vertebrate and invertebrate sensory systems (Grueber & Sagasti, 2010). The territories of the dendritic arbors for certain types of retinal neurons were found to approximate the domains defined by the intercellular spacing between adjacent neurons, appearing as tesserae within a “mosaic” (Fig. 1), and so the term has come to be applied to both regular distributions of somata as well as to their dendritic arbors, particularly where those dendritic arbors “tile” the retina. Such “retinal mosaics” are now well recognized in the field of developmental neuroscience as exemplars of patterned distributions of nerve cells that provide a uniform sampling of their afferent innervation, and these design principles of cellular “regularity” and “uniformity of coverage” are frequently assumed to be characteristic, even defining, features of any population of retinal nerve cells (Cook, 1996). These issues have recently drawn substantial attention in the field of invertebrate neurobiology where comparable principles appear to be at work (Sanes & Zipursky, 2010), and the molecular and genetic underpinnings of some of those population dynamics are being revealed in exquisite detail (Jan & Jan, 2010), with attendant fascination in the elegance of their execution (Millard & Zipursky, 2008). Homologous genes are being studied with increasing scrutiny in the vertebrate nervous system, but the linkage between gene function and design principle is not necessarily conserved. Before considering the role of gene function in the production of these design principles of nerve cell patterning and dendritic coverage, it would be beneficial first to re-examine the evidence within the retina for (a) the presence of these two design principles and their ubiquity, (b) the extent to which they are related to each other, and (c) the developmental events that underlie their formation. By having a fuller understanding of their concurrence and how they are achieved during development, we should be better positioned to interpret the role played by genes that affect their formation, thereby clarifying the genetic underpinnings of those design principles, or whether a mutant phenotype elucidates the design principles at all.
Fig. 1.
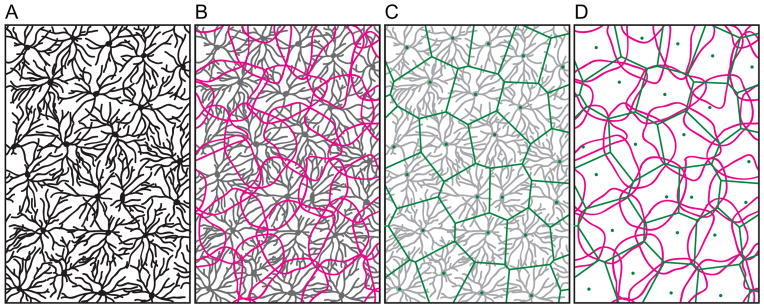
Regular retinal mosaics provide a uniform sampling of the visual field. Certain types of retinal nerve cells, such as this retinal ganglion cell from the cat retina, have somata that are non-randomly distributed, and extend dendritic arbors that approximate a uniform coverage of the retina by modulating their growth in relation to proximity between neighbouring cells. (A) The cells and their dendritic arbors; (B) their slightly overlapping dendritic fields; (C) the positioning of their somata and the spatial domains defined by this intercellular spacing; (D) their dendritic fields modulated by proximity to neighbouring cells (modified from Wässle et al., 1981).
II. CELLULAR POSITIONING: INFERENCES FROM PATTERNING, SPACING AND CLUSTERING
(1) Mature mosaics
(a) Mature retinal mosaics are often patterned
Retinal nerve cells of a given type are generally restricted to a particular depth within the retina. At any given location on the retina, their local distribution typically differs from a random distribution. Such deviation has most commonly been evidenced by an analysis of the nearest neighbour (NN) distances associated with that local population (Wässle & Riemann, 1978). The NN distances for real mosaics are invariably more Gaussian in their frequency distribution relative to those for a random distribution of points. This comparison has been a basis for defining the population as “regular”, though deviation from random may be subtle, or it may be substantial. One “shorthand” for this degree of orderliness has been to compute the ratio of the mean NN distance to its standard deviation, yielding the conformity ratio, or “regularity index” (Cook, 1996). Theoretical random point patterns have a NN regularity index of 1.91, while all real mosaics yield regularity indices higher than this. As the variability in the distribution of NN distances declines, for example, in a regular mosaic approaching a lattice-like organization, so the regularity index increases, climbing above a value of 10 for some photoreceptor mosaics in the fish retina (Allison et al., 2010; Stenkamp et al., 2001). Most retinal mosaics lack such a periodic ordering, having regularity indices well under 10, but that are still conspicuously regular by eye. Still other retinal mosaics are only marginally more regular than random distributions (Reese, 2008). In those cases, a NN analysis may misestimate just how regular such a mosaic really is, since it considers the relationship between each cell and just one of its immediate neighbours. An alternative spatial statistic, the Voronoi domain (VD) analysis, has the benefit of incorporating the spatial relationship between each cell and all of its immediate neighbours by computing the area surrounding each cell that encloses the territory closer to that cell than to any of those neighbours (Fig. 2). The tessellating Voronoi domains for a population of cells portray the “mosaic” nature of the local distribution, and the variance in those areas provides a visual as well as statistical index of the “regularity” contained within the mosaic. This VD analysis, like the NN analysis, discriminates real mosaics from random distributions, but their parallel usage often provides complementary, rather than redundant, information about the spatial features of a mosaic (e.g. Raven et al., 2003; Eglen et al., 2003). As one example, the NN regularity index should be relatively insensitive to a slightly under-sampled mosaic relative to the VD regularity index.
Fig. 2.

Voronoi domain analysis provides a visual as well as numerical index of mosaic patterning. Horizontal cell mosaic of the mouse retina (A), along with a random distribution constrained by soma size (B), and a jittered hexagonal distribution (C) all matched in density. (A–C) The Voronoi tessellation associated with each mosaic, being a field 300 × 300 μm, with somas drawn to scale. (D–F) Respective frequency distributions associated with those Voronoi domains, indicating the regularity index (VDRI), being the mean Voronoi domain area divided by the standard deviation, for each sample.
(b) Cell density and soma size constrain somal positioning
The regularity index derived from either a NN or VD analysis provides a convenient numerical assessment of how “regular” a mosaic is, but comparing it with a random point pattern is of little biological meaning when one considers that cells in a mosaic are usually positioned within a single stratum in which the physical size of a cell constrains proximity to other like-type cells. A more conservative basis for discriminating a real mosaic from a random distribution should take this into account, by simulating random distributions of cells matched for both soma size as well as density, assigning each cell in a simulated random distribution a size based upon the statistics of the real soma size distribution. Such random simulations of horizontal cells in the mouse retina, for instance, have NN regularity indices around 3.5 rather than around 1.91 for random distributions of points. Real horizontal cell mosaics in the mouse retina are still significantly more regular, having NN regularity indices around 5.0 (Raven & Reese, 2002). Cholinergic amacrine cells, by contrast, show conspicuously less of a difference from random simulations constrained by soma size, even if still significantly different (Fig. 3). From the perspective of understanding the determinants of such patterning, the index is only meaningful relative to what such cells could achieve were they positioned randomly. Consequently, comparisons of regularity indexes between different types of retinal neurons may be entirely uninformative without appreciating the differences in density and in soma size—where either of these is greater, the regularity index for the random comparison will be higher simply due to the space-occupying nature of the cells.
Fig. 3.

The space-occupying nature of retinal neurons constrains proximity between neighbouring cells. Cholinergic amacrine cell mosaic of the mouse retina (A), along with a random distribution constrained by soma size (B) and, for comparison, a random distribution lacking this constraint (C), all matched in density. (A–C) Delaunay tessellation associated with each mosaic, as well as the collection of Delaunay segments for a single cell (i.e. the near neighbour distances for that cell, shown in orange), the shortest being the nearest neighbour distance for that cell (shown in red). (D–F) Respective frequency distributions associated with those nearest neighbour distances for each cell, indicating the nearest neighbour regularity index (NNRI; the mean nearest neighbour distance divided by the standard deviation) for each sample. Because there is no threshold defining when a mosaic is regular, the degree of regularity is best assessed relative to what a random simulation would achieve when constrained by both density as well as soma size. Other details are as in Fig. 2.
(c) The patterning in retinal mosaics can be achieved by the implementation of local spacing rules
Both the NN and VD analyses can reliably discriminate real from random distributions, but neither is particularly informative for addressing whether a mosaic contains higher-order (lattice-like) periodicity (e.g. Fig. 2C). By contrast, analyses based on the spatial auto-correlation of a field of cells, including the density recovery profile (DRP; the average density of cells as a function of distance from each cell) or the related L function (essentially a cumulative version of the DRP), provide alternative approaches that take into consideration the positioning of each cell in a mosaic relative to every other cell present (Eglen & Galli-Resta, 2006). Where mosaics contain such higher-order patterning, the two-dimensional periodicity emerges in the spatial correlogram itself (Fig. 4C). In fact, with the exception of many photoreceptor mosaics, particularly in fish retinas (Raymond & Barthel, 2004; Roorda et al., 2001), most post-receptoral mosaics do not show any evidence for lattice-like patterning (Hore, Troy & Eglen, 2012). Rather, most mosaics analysed in this manner show only a reduced density of like-type neighbours surrounding each cell in the mosaic, evidenced by the vacancy surrounding the origin in the autocorrelogram (Fig. 4A), with the size of this “exclusion zone” being greater than the physical size of the cell itself (Fig. 4B). Some cell types, particularly those at higher densities, exhibit additional maxima and minima at further distances from the origin of the DRP or L function, often indicative of increasingly close packing, but rarely recapitulate a hexagonal or square lattice in the correlogram itself (e.g. Galli-Resta et al., 1999; Kram, Mantey & Corbo, 2010).
Fig. 4.

Autocorrelation analysis reveals the presence of an exclusion zone surrounding cells in a mosaic. (A–C) Spatial autocorrelograms derived from each of the three mosaics illustrated in Fig. 2. (D–F) Density recovery profiles (DRPs) associated with each field, indicating the size of the effective radius (ER) for each. The autocorrelograms are each composed of 20 concentric 5 μm wide annuli, plotting the positioning of all cells within a 100 μm radius, for every cell in the fields in Fig. 2. The DRPs show the average (recovered) density of cells as a function of distance from each cell. The autocorrelograms of real retinal mosaics (A) rarely recapitulate higher-order patterning like that observed with a jittered lattice (C). Random simulations show an exclusion zone defined by the space-occupying effect of soma size only (B). The difference between the real (left) and random (middle) mosaics reveals an effect of some biological process or processes limiting the proximity between homotypic neighbours.
The attraction of this analysis has been twofold. First, it draws attention to the fact that the patterning present in real, conspicuously regular, mosaics can be generated solely by the action of local spacing rules that prevent neighbouring cells from being too close to one another. Second, it renders clearer the fact that the difference between such regular retinal mosaics and those that appear by comparison irregular (while still being more regular than random distributions) might simply be a consequence of the fact that local spacing rules only ensure a minimal distance between neighbouring like-type cells: When density is high, neurons appear orderly because they interact with multiple neighbours to minimize proximity, but when density is low, they simply ensure this minimal spacing from their closest neighbour. An exclusion zone in the DRP or L function, therefore, simply reveals the presence of biological processes manifested as minimal-distance spacing rules, i.e. a region surrounding each cell in a mosaic where the probability of finding a like-type cell is lower than it is at further distances from the cell. Recognize, however, that the underlying biological event creating such minimal spacing need not reflect the action of developmental mechanisms that affect the patterning of the mosaic, as discussed below.
(d) The detection of an exclusion zone in the DRP does not directly evidence regularity
Real retinal mosaics, therefore, are discriminated from density- and size-matched random simulations of cells by virtue of the presence of an exclusion zone surrounding each cell. Yet the mere detection of the presence of an exclusion zone conveys no appreciation for the patterning present—only that a local spacing rule may be in action, minimizing proximity between neighbours (Rockhill, Euler & Masland, 2000). As already mentioned, some mosaics appear conspicuously irregular yet can be shown to differ from matched random distributions by virtue of their NN and/or VD analyses. A former exercise on modelling the effects of undersampling a regular mosaic is worth considering (Cook, 1996): randomly sampling as few as 20% of the original cells in a mosaic deteriorates the apparent patterning of the mosaic, diminishing the regularity index accordingly, yet leaves the exclusion zone detected in the DRP largely unchanged. A biological example of the same was derived from an analysis of the distribution of rod photoreceptors in the sciurid retina: density varies across the dorso–ventral axis of this retina by nearly a factor of 10 (Fig. 5A–D) (Kryger et al., 1998), but the size of the exclusion zone derived from the DRP analysis was largely invariant (Galli-Resta et al., 1999); unsurprisingly, the regularity for this mosaic correlated with density, rather than being an invariant characteristic of this cell type (Fig. 5E). This is not typical of retinal mosaics, but it serves to make the point that the exclusion zone revealed in the DRP conveys nothing about the regularity of a mosaic (Huberman et al., 2008; Kim et al., 2008), only about the degree of minimal spacing between homotypic neighbours, and is no substitute for a direct appraisal of the patterning present, for instance, by either NN or VD analysis.
Fig. 5.

An exclusion zone in the density recovery profile is not indicative of the regularity of a mosaic. Rod photoreceptor mosaics in the squirrel retina. (A–D) Mosaics at progressively higher density (field size 200 × 200 μm), all exhibiting a comparable minimal spacing between rods that is recapitulated in the autocorrelograms derived from these fields (not shown). (E) Variation in nearest neighbour regularity index (NNRI) as a function of density, for various fields (black symbols) sampled across the surface of two different squirrel retinas. Minimal distance (dmin) simulations based on an invariant minimal distance spacing rule, at five different densities, recapitulate the increase in NNRI with density (red symbols). Modified from Galli-Resta et al. (1999).
(e) Irregularity may be a feature of some mosaics
The more highly irregular (if not random) mosaics that have been documented for retinal nerve cells are often the most sparsely distributed cell types found within the retina (Fig. 6). Because these mosaics exhibit exclusion zones that prevent their sparse neighbours from close proximity yet that are not large enough to ensure uniform spacing between a cell and all of its Voronoi neighbours (i.e. they have low packing intensities: Diggle, 2002), this might, on the face of it, suggest an undersampling problem, either artefactual (true undersampling from a regular biological mosaic), or due to some defect in the proper production, differentiation, or survival of a subset of cells that, were they present, would space themselves by the same exclusion zone rule to yield a highly regular (intensely packed) mosaic. Because the resultant mosaic is highly irregular, however, it is difficult to envision a biological process that might mediate this under-representation within the mosaic (unless it, too, had a conspicuously stochastic quality to it), and so the interpretation of artifactual undersampling may be somewhat more appealing, given the widely held expectation that retinal mosaics should be regular (Y. Zhang et al., 2012). The dopaminergic amacrine cells are particularly informative on this issue: they are one of the sparsest cell types in the retina, comprising less than 0.01% of all retinal neurons. They exhibit regularity indices only slightly (although significantly) more regular than density-matched random distributions constrained by soma size, and their distributions can be modelled using a minimal-distance (dmin) spacing rule to mimic the action of an exclusion zone present in the spatial auto-correlation for this cell type (Fig. 6) (Raven et al., 2003). Curiously, though, their number is precisely regulated in the retina: different strains of mice show large and significant differences in their total number present, unrelated to any variation in retinal area, yet within a strain, the variance is quite low (Whitney et al., 2009), comparable to the variance detected for the far denser and more regular mosaic of horizontal cells (Whitney et al., 2011). Artefactual undersampling would be expected to yield variability in the total number of cells detected, so this account for the irregularity in this mosaic appears unfounded, leaving us with the likelihood that some real retinal mosaics are in fact highly irregular, if not quite random. How the retina achieves such a highly reproducible yet meagre number of dopaminergic amacrine cells in the absence of conspicuous patterning remains a mystery.
Fig. 6.

Real retinal mosaics can be simulated by minimal distance spacing (dmin) rules. Modelling the mosaic of dopaminergic amacrine cells in the mouse retina. (A) A typical low-density dopaminergic amacrine cell mosaic and associated Voronoi tessellation and (B) a density-matched dmin simulation in which cellular positioning is constrained by a minimal distance spacing rule, being 70 ± 50 μm (mean and standard deviation). Field size is 1 mm2, and somata are drawn to scale. The real mosaic looks nearly random, but for the relative scarcity of the occasional close positioning between pairs of cells that would otherwise occur by chance. (C–F) The cumulative frequency distribution for a single dopaminergic amacrine cell mosaic (blue) relative to the envelope of 99 random simulations constrained by soma size alone, i.e. a minimal distance spacing rule of 11.43 ± 1.45 μm (shaded grey) (C, E), and the same cumulative frequency distribution relative to the envelope of 99 random simulations constrained by the same minimal distance spacing rule shown in B (shaded grey) (D, F). C and D show the analysis using Voronoi domains, E and F are for nearest neighbour distances. Preventing a random distribution of cells from close proximity (B, D, F) provides a better fit to the spatial distribution of the dopaminergic amacrine cell mosaic (A), evidenced by the cumulative frequency distribution being contained within the envelope of the 99 simulations. Modified from Raven et al. (2003).
(2) Developing mosaics
(a) The regularity index is a scale-invariant measure
From the outset of neurogenesis, fate determination events play out across the proliferating retinal neuroepithelium to seed the differentiating retina with the respective numbers of each type of nerve cell. As these cells are born, they migrate and settle within their mosaic layers. Some of these cell types also have their final numbers modulated by programmed cell death (Linden & Reese, 2006). Consequently, the final size of a population in a mosaic is defined by those factors that affect both cell production and cell survival, and each of these processes might contribute to the patterning. For instance, periodic fate-determining events would be expected to impose a degree of regularity amongst the precursors of a particular mosaic (Stenkamp & Cameron, 2002). The role of lateral inhibition in fate assignment would be one simple means for ensuring a minimal spacing between cells of the same type (McCabe, Gunther & Reh, 1999; Tyler, Carney & Cameron, 2005). Of course, once a given population has been produced, the genesis and migration of later-generated cell types will passively increase the overall size of the retina, thereby increasing the spacing between previously generated like-type cells (Kram et al., 2010). The phenomenon of naturally occurring cell death, by partially depleting a mosaic, would also yield a reduction in average density across time, and might thereby contribute to an increase in spacing, particularly if the determinants of cell death were spatially modulated (e.g. by competitive interactions between like-type neighbours for a limited resource; Eglen & Willshaw, 2002). Beside these essentially heterotypic interactions that might influence nerve cell patterning, newborn homotypic neighbours might also interact with one another as they settle in their mosaic layers to space themselves apart (Reese & Galli-Resta, 2002; Galli-Resta, Novelli & Viegi, 2002). Teasing apart each of these processes to understand the determinants underlying the final patterning in a mosaic is difficult, but it should be obvious that an analysis revealing an increasing exclusion zone (effective radius) in the DRP as a function of development, independent of other analyses of mosaic order, might only index the passive expansion of retinal growth (i.e. a random distribution of cells, lacking evidence for an exclusion zone in the DRP during early development, would be expected to evidence one following retinal expansion). Much as the size of the exclusion zone should be affected by retinal expansion, so too of course are the nearest neighbour lengths and Voronoi domain areal measures derived from a mosaic. The latter statistics, however, allow a calculation of a scale-invariant measure, the regularity index, and it is this measure that most directly evidences any change in the spatial patterning as a function of development. When that measure changes across development, in conjunction with knowledge of the time course of cell production, cell loss, or lateral movement, one may more accurately assess the relative contributions of these processes to the mature mosaic order.
(b) Homotypic neighbours space themselves apart during mosaic assembly
One difficulty in analysing retinal mosaics across development has been the problem of identifying all cells of known type from the earliest stages, as most proteins recognized by antibodies used to identify particular cell types in the mature retina are not synthesized until later stages of development, often after mosaic assembly. An alternative strategy is to use transgenic reporter mice expressing a fluorescent protein in a particular cell type, although these routinely fail to express in the entire population of a mosaic, even in maturity. One cell type that has proven amenable to analysis through development is the horizontal cell of the mouse retina, a population that can be detected reliably via immuno-fluorescence from the onset of mosaic assembly within the horizontal cell stratum. During the first postnatal week, when horizontal cell number in the nascent mosaic layer is stable (neither undergoing further cell addition, nor undergoing any elimination), but as retinal expansion is taking place, the regularity index undergoes a significant increase relative to the day of birth, when the mosaic also displays a significant increase in its packing factor (Raven et al., 2005), being an independent (and also scale-invariant) index of how close a mosaic approximates a hexagonal lattice (Rodieck, 1991). Neither of these indices show further increases after the first postnatal week, yet retinal area continues to expand, and as expected, the effective radius with it (Fig. 7). Those earlier changes in regularity index and packing factor must indicate that during a brief developmental window, horizontal cells move within the plane of the retina relative to one another (Reese et al., 1999), and that this movement is not random, but serves to minimize proximity between homotypic neighbours (Raven et al., 2005). Indeed, the effective radius undergoes an increase between days P1 and P5 that exceeds that expected due to the increase in retinal area (i.e. compare their ratios in Fig. 7 at these two time points), making clear that both events contribute to its enlargement. Even before these earliest stages of mosaic assembly, however, during the period of migration to the horizontal cell layer, some horizontal cells already engage in movements within the plane of the retina (Huckfeldt et al., 2009), although whether these movements are driven by homotypic interactions is unclear. Partially depleting the population at these earliest stages yields a final mosaic in which the cells exhibit a larger minimal spacing (Poché et al., 2008), but it is not clear whether that greater spacing is achieved as these cells move to the horizontal cell stratum, or only after they have populated it.
Fig. 7.

Mosaic patterning increases during a limited developmental period in the C57BL/6J mouse retina, while the exclusion zone continues to increase with retinal expansion. The nearest neighbour regularity index (NNRI) (A) and packing factor (B) both show significant increases during the first five postnatal days (P1–P5), but stabilize thereafter; the effective radius, converted here to an areal measure (C) continues to expand, along with the areal growth of the retina (D). Means and standard errors are indicated; N = the number of retinas sampled.
(c) Developmental cell death does not invariably lead to increased mosaic regularity
Another example of a mosaic that has been studied across different developmental stages is that of the cholinergic amacrine cells, which can be labelled reliably during the postnatal period when total numbers in the inner nuclear layer undergo a 20% reduction (Galli-Resta & Novelli, 2000), permitting a comparison of mosaic order before versus after cell loss. This natural reduction can also be disrupted experimentally (Resta et al., 2005), permitting a comparison of enlarged versus normal-sized mosaics at the same time point in maturity. In each case, special considerations apply, particularly when employing measures of minimal cell spacing: in the former case, cell loss is taking place in the presence of an expanding retina, while in the latter case, experimental and control retinas may achieve the same final size, yet the former is populated by more cells, and this may, itself, contribute to a reduction in the minimal spacing when mosaic regularity is unchanged. In fact, the population of cholinergic amacrine cells fails to exhibit a corresponding increase in mosaic order during this period of cell elimination (Galli-Resta & Novelli, 2000), while showing the expected decrease in the size of the exclusion zone when naturally occurring cell death is disrupted (Resta et al., 2005). As this cell type is also known to disperse tangentially before the period of natural cell death (Galli-Resta et al., 1997; Reese et al., 1999), homotypic repulsion would appear to play the greater role in creating its patterning.
(d) Mosaic order may also become degraded during development
Despite there being nearly symmetric populations of ON versus OFF cholinergic amacrine cells in the ganglion cell layer and inner nuclear layer, in the mouse retina the former population is significantly less regular, less efficiently packed, and less dense while being less minimally spaced (Whitney et al., 2008). This asymmetry between the two mosaics arises, at least partially, as a consequence of a degradation in mosaic order within the ganglion cell layer, occurring after the period of naturally occurring cell death and due to a displacement of somata produced by the later formation of the optic fibre layer and retinal vasculature (Whitney et al., 2008). Hence, the developmental change in regularity is not necessarily a one-way street: while the lateral movements of cholinergic amacrine cells may initially reflect an active process by which newly differentiating homotypic neighbours space themselves apart (Galli-Resta et al., 2002), passive forces may also displace somata and thereby degrade the regularity of the mosaic. The functional significance of such displacement depends on multiple factors, including when the displacement occurs relative to dendritic differentiation, and whether that differentiation is affected by the presence or distribution of homotypic neighbours (Farajian et al., 2004). For cholinergic amacrine cells in the ganglion cell layer, displacement of the somata follows differentiation, resulting in minimal consequences for retinal coverage by dendritic arbors. Nevertheless, it stresses the fact that the end-product of the developmental program will be a mosaic of nerve cells that was shaped by various developmental events controlling the production, migration, dispersion and survival of those cells, processes that may or may not occur contemporaneously. Comparisons across development require careful consideration of the timing of these processes in order to interpret them correctly for understanding mosaic formation.
(3) Mutant mosaics
(a) Ectopic clustering prevents mosaic patterning
Those same two populations of cholinergic amacrine cells show another striking asymmetry: in the BarH-like homeobox 2 (Barhl2) null mouse retina, the mosaic within the ganglion cell layer (GCL) shows conspicuous clustering of cholinergic somata, yet the mosaic in the inner nuclear layer (INL) is hardly affected in this way (Ding et al., 2009). Barhl2 is a homeodomain transcription factor that plays a role in amacrine cell sub-type specification, as these Barhl2-deficient retinas contain increased numbers of cholinergic amacrine cells and decreased numbers of gamma-amino butyric acid (GABA)-ergic and glycinergic amacrine cells. The increase in cholinergic cell number does not appear to be critical for the clustering to occur, because both layers show increases in cell number, with the GCL population increasing twofold while the INL population increases as much as threefold (Ding et al., 2009). The clustered pattern is not present at any stage during normal development of the cholinergic mosaic (Galli-Resta et al., 1997; Whitney et al., 2008), but whether it is present at the outset in the Barhl2-deficient retina, or emerges secondarily by tangential movement as these clusters assemble, has not been determined. Whatever the role of Barhl2 may prove to be in this process (perhaps entirely independent of its role in sub-type specification), it does not appear to clarify the normal mechanisms governing mosaic formation for this population. Barhl2 may be critical for normal mosaic formation, but only because its loss induces ectopic clustering, at least for this GCL population.
That an increase in cell density might still have some role to play in creating a clustering phenotype is suggested by the Bcl-2-associated X protein (Bax) deficient mouse retina. Deletion of this pro-apoptotic protein disrupts the process of naturally occurring cell death for some types of retinal neuron, yielding an increase in their number, including the retinal ganglion cells. Those that are intrinsically light-sensitive, the melanopsin-positive population, exhibit an occasional clustering of their somata that is not a characteristic of the wild-type retina (Keeley et al., 2012) at any stage during development (Chen et al., 2013). Such ectopic clustering is even more conspicuous in the Down’s syndrome cell adhesion molecule (Dscam) and Dscam-like1 (Dscaml1) deficient retinas (de Andrade et al., 2014; Fuerst et al., 2008, 2009). In the former, Dscam-mutant retina, the dopaminergic amacrine cells, nitric oxide synthase (b-NOS)-positive amacrine cells, two forms of OFF cone bipolar cells and melanopsin-positive ganglion cells are all reported to show homotypic clustering, while in the Dscaml1-deficient retina, it is the AII amacrine cells that are reported to show homotypic clustering. This clustering phenotype is itself rather variable: the melanopsin-positive retinal ganglion cells show conspicuous ectopic assemblies of cells in contact with one another (Fig. 8A, B), while the dopaminergic amacrine cells show only an increased frequency of closely spaced cell-pairings relative to random distributions, if not actually being in somal contact (Fig. 8C, D) (Keeley et al., 2012). All of these neuronal populations also show abnormal elevations in cell number, and the similarities (and differences) in the clustering phenotypes for these two cell types between Bax-deficient and Dscam-deficient retinas have been highlighted elsewhere (Keeley et al., 2012). Much has been made of the significance of the clustering phenotype in these mutant mice, and how it relates to the defective differentiation of the processes of these cells (see also Section III). They show quite clearly the need for intact Dscam and Dscaml1 in the developing mouse retina to prevent ectopic adhesion, and will undoubtedly yield a complex and interesting story about the role of these cell surface molecules in preventing adhesion (Fuerst & Burgess, 2009; Garrett, Tadenev & Burgess, 2012). In conjunction with the other clustering phenotypes described above, these studies suggest that there are multiple means of tipping the balance in favour of ectopic adhesion between like-type cells, but with respect to the formation of retinal mosaics all they show is that ectopic adhesion prohibits the normal interactions that sculpt a mosaic. The formation of retinal mosaics is ultimately a story of how cells are generated across the retina, whether they survive into maturity, and how they may space themselves apart as they move to their mosaic layers and differentiate.
Fig. 8.

Dscam-mutant mice exhibit ectopic clustering, disrupting the intercellular spacing normally present. The clustering phenotype is itself variable between the cell types affected. (A, B) Distribution of melanopsin-positive retinal ganglion cells in Dscam-mutant (B) and control retina (A), showing conspicuous clustering in the former. (C, D) The distribution of dopaminergic amacrine cells in the Dscam-mutant retina (D), by comparison with control retina (C), shows only a greater frequency of closely positioned cells than expected from random simulations. From Keeley et al. (2012), reproduced with permission from the publisher.
(b) Genetic disruption of programmed cell death degrades the regularity of some mosaics
The Bax-knockout retina contains a fourfold increase in the dopaminergic amacrine cell population, showing homotypic cells in closer proximity than are found in random simulations matched for this heightened density and constrained by soma size. This fact alone should be responsible for the mosaic showing a loss of the minimal-spacing characteristic normally present (Keeley et al., 2012). Yet these two features, this slight tendency to clustering, and the loss of minimal spacing, can be dissociated in another mouse for which programmed cell death has been interrupted, the B-cell lymphoma 2 (Bcl2)-overexpressing mouse. Here, overexpression of this anti-apoptotic factor yields a retina containing a ninefold increase in this same population (Strettoi & Volpini, 2002). These Bcl2-overexpressing retinas show a loss of the minimal spacing constraint that is normally present between dopaminergic amacrine cells and is responsible for the limited patterning present in this mosaic (Raven et al., 2003). Recall that this cell type is marginally more regular than a random distribution in the wild-type retina due to the presence of an exclusion zone surrounding each dopaminergic amacrine cell (Fig. 6); the Bcl-2-overexpressing retina presents a mosaic no different in its patterning than does a random distribution of cells (i.e. no hint of clustering). Hence, cell death is not random within the initial population of dopaminergic amacrine cells, but is marginally biased to eliminate those in the population that are near other like-type cells. The Bax-knockout retina similarly loses the minimal spacing characteristic of the wild-type retina (Keeley et al., 2012), but why it additionally shows a slight tendency to clustering amongst this enlarged population is unclear. While naturally occurring cell death does not always improve mosaic regularity, as indicated above for the developing cholinergic mosaic, both of these two mouse models show that it can be evidenced to do so, for other cell-types, when it is abrogated during development.
(c) Spacing is genetically regulated
The Dscam- and Dscaml1-deficient retinas demonstrate the necessity of these cell surface molecules for a mosaic to assemble normally, even if the functions of these genes do not appear to modulate any of the biological processes critical for mosaic assembly. While avoiding abnormal adhesion is an obvious minimal condition for a mosaic to form, neither Dscam nor Dscaml1 mediate the fundamental feature of retinal mosaics outlined above, that they can be simulated by minimal distance spacing rules that keep cells apart. Recently, two other genes, Multiple EGF-like-domains 10 and 11 (Megf10 and Megf11), have been shown to fulfill precisely this role, for the mosaics of cholinergic amacrine cells and horizontal cells. These genes, encoding transmembrane proteins previously associated with debris engulfment, are both expressed exclusively by these two populations of retinal interneurons. When they are knocked out, these mosaics, but not those of other retinal interneurons, are rendered disorderly: while cell number is not altered, the exclusion zone is reduced, as is the regularity index and the packing factor (Kay, Chu & Sanes, 2012), with minimal evidence for ectopic clustering. Overexpressing Megf10 within a patch of retina, by contrast, yields an increased spacing of cells surrounding such patches. Apparently, these Megf proteins play contact-mediated repulsive roles, serving as both ligand and receptor between the processes of homotypic neurons, enabling somata to distribute themselves in order to equalize exposure to Megf10/11 on all sides of a cell, yet having little if any effect upon the morphological differentiation of the cholinergic or horizontal cells themselves (Kay et al., 2012). The mutant phenotype is a histotypical one, manifested by the population of homotypic neurons, embodying the very principles inferred from previous studies describing the intercellular spacing and mosaic patterning present in mature and developing retinal mosaics (Reese, 2012).
III. DENDRITIC ORGANIZATION: INFERENCES FROM FORM, OVERLAP AND COVERAGE
(1) Dendritic patterning and overlap in maturity
Invertebrate neurobiologists, excited by recent advances in the genetic dissection of dendritic morphogenesis, occasionally misrepresent the phenomenon of dendritic “tiling” as a universal feature of vertebrate retinal cell types (e.g. Emoto, 2012; Parrish et al., 2007), when in fact only a proportion of retinal cell types engage in such tiling. Likewise, self-avoidance by dendrites of the same neuron, being a means to generate space-filling within a field of afferent terminals or across a sensory surface (Grueber & Sagasti, 2010; Kise & Schmucker, 2013), is also frequently assumed to be a characteristic of retinal neurons (e.g. Millard & Zipursky, 2008). In fact, different retinal cell types do different things, and we would like to understand why they are different in their characteristic ways. Those differences surely have relevance for their functional contributions to retinal processing, but we will remain focused upon the factors that contribute to their development. As we shall see, relatively few documented retinal cell types exhibit a patterning of their dendritic arbors suggestive of self-avoidance, and none has been documented to be self-avoidant during the period of dendritic differentiation. With respect to tiling, this too is by no means a consistent feature of retinal cell types, but the lack of tiling is not necessarily indicative of an insensitivity to homotypic neighbours.
(a) Some cell types show dendritic self-avoidance, while others exhibit dendritic self-crossing
Cholinergic amacrine cells produce large dendritic fields confined to a narrow stratum within the inner plexiform layer, their fields arising from, on average, five primary dendrites (Fig. 9A). At increasing distances from the soma, higher-order dendrites emerge from those primary dendrites, themselves branching at further distances from the soma, producing as many as 80 branch points within the entire arbor in the mouse retina (Keeley et al., 2007), but exhibiting few dendritic self-crossings. This dendritic patterning is suggestive of self-avoidance, as though individual outgrowing neurites had been prevented from encroaching upon one another, perhaps through active repulsion. Simulations based upon the reaction dynamics of a diffusible “suppressor” acting upon outgrowing dendrites effectively recapitulate the morphology of this cell type, with branches forming as a function of increasing distance between the radiating cholinergic dendrites (Sugimura et al., 2007).
Fig. 9.

Few retinal neurons in the mouse retina exhibit a self-avoidant, space-filling, dendritic morphology. The dendritic arbors sample their afferents, with some afferent populations forming a punctate distribution across a single stratum, for example the cone pedicles in the outer plexiform layer, while others approximate a more continuous sheet, for instance, the tiling axon terminals of bipolar cells. (A) The cholinergic amacrine (ChAT) cell best exhibits a tendency for its dendrites to minimize contacts with one another (i.e. the dendritic morphology of this cell type suggests self-avoidance), while the dopaminergic amacrine (DA) cell extends dendrites that conspicuously cross over one another. The A17 amacrine cell produces a dense network of non-branching dendrites that distribute evenly spaced boutons along their lengths. (B) The cone bipolar (CBC) and rod bipolar (RBC) cells, as well as (C) the horizontal cells (HC), show little apparent self-avoidance, distributing their dendritic terminals to the punctate distribution of cone pedicles or rod spherules. (D) Retinal ganglion cell (RGC) dendritic arbors (two of which shown here are bi-stratified types) are variably symmetric and space-filling, but few would be described as self-avoidant. Asterisk indicates a labelled Muller glial cell aside one of the ganglion cells.
Another amacrine cell type exhibiting comparably narrow stratification within the retina is the dopaminergic amacrine cell. Unlike the dendritic arbor of the cholinergic amacrine cell, that for the dopaminergic amacrine cell is far sparser, with on average three primary dendrites that give rise to only about nine higher-order branch points within the entire field, yielding a conspicuously irregular, often asymmetric, dendritic arbor (Keeley & Reese, 2010a). The dendritic arbors of dopaminergic amacrine cells lack any approximation of a uniform spatial distribution within a convex polygon defined by their dendritic tips, and the course of individual dendrites would appear random with respect to one another (Fig. 9A). Consistent with this impression, these dendritic arbors exhibit self-crossings (Keeley & Reese, 2010a).
Other stratified amacrine cell types (e.g. the wide-field AI amacrine cell) show prominent straight, radially directed (if not space-filling), dendrites that cross one another, suggesting their trajectory is defined cell-intrinsically, and not by iso-neuronal regulation (Davenport, Detwiler & Dacey, 2007). Still other amacrine cell types, like the A17 amacrine cell (Grimes et al., 2010), show a richly distributed network of processes though lacking any sign of uniform dendritic self-spacing (Fig. 9A). Unlike the other amacrine cell types, this one is believed to exhibit little higher-order dendritic branching, each dendrite emerging from the soma and producing boutons that are uniformly spaced along its length (Grimes et al., 2010).
Few other retinal cell types have dendritic arbors like those of the cholinergic amacrine cells, wherein the dendrites show a spatial patterning suggestive of self-avoidance. Within the outer plexiform layer, horizontal cells and cone bipolar cells have dendritic arbors that distribute their endings across the mosaic of cone pedicles within a single stratum, those arbors occasionally innervating the same pedicle by different dendritic branches that may cross over one another (Keeley & Reese, 2010b; Lee et al., 2011; Matsuoka et al., 2012; Reese, Raven & Stagg, 2005) (Fig. 9B, C). Rod bipolar cells, by contrast, direct their dendritic endings to spread vertically through the outer plexiform layer to target numerous densely packed rod spherules (Keeley & Reese, 2010b; Tsukamoto & Omi, 2013). As those endings are constrained by the packing of rod spherules, they necessarily exhibit a self-spacing of their terminations. But like the cone bipolar cells and horizontal cells, their morphologies would appear to be governed by the distribution of their afferents rather than by any self-avoidant tendencies.
Some retinal ganglion cell types yield dendritic arbors that are described as space-filling yet self-avoiding (Dacey, 1993; Dacey & Petersen, 1992), if lacking the characteristic symmetrical order of the cholinergic arbors, and are often assumed to be the most critically needful of uniform spatial coverage. Yet within the mouse retina, multiple types of retinal ganglion cell exhibit dendritic arbors in maturity that exhibit frequent dendritic self-crossings, with varying degrees of space-filling within the convex polygon defined by their dendritic tips (Fig. 9D; e.g. compare RGC 1 with RGC 9). While any of these may have their dendritic arbors sculpted through self-avoidant interactions during development, their morphologies may have as much to do with heterotypic interactions, for instance with their afferents. As few of them exhibit a dendritic morphology suggestive of such a design principle in operation, it may be premature to suggest that every ganglion cell type possesses such an inherent tendency.
(b) Some cell types show dendritic overlap, while others tile
Some retinal ganglion cell types, like most types of cone bipolar cells, extend their dendritic arbors to approximate a “tiling” of the retina (Dacey, 1993; Wässle et al., 2009), their average dendritic field sizes being comparable to the Voronoi domain areas defined by their neighbour relationships (Wässle, Peichl & Boycott, 1981) [although note the recently described exception to this rule, that of the X bipolar cell (XBC) in the mouse retina, with a dendritic field that is insufficiently large to yield a dendritic tiling given the relative scarcity of this cell type; Helmstaedter et al., 2013]. That these cell types generate this tiling by responding to the distribution of the dendritic fields of their homotypic neighbours has been suggested by perturbation studies eliminating neighbours on only one side of the dendritic field, producing a redistribution of dendrites biased toward the depleted side (Eysel, Peichl & Wässle, 1985; Perry & Linden, 1982). Curiously, while some retinal ganglion cell types reduce the size of their dendritic arbors when the density of homotypic neighbours is experimentally increased (Kirby & Chalupa, 1986), others apparently do not show a corresponding increase in size following depletion of neighbours on all sides (Lin, Wang & Masland, 2004), although those failing to do so may be cell types that do not actually tile the retina, but rather overlap the dendritic arbors of their homotypic neighbours. Indeed, the capacity to tile would appear to require a sensitivity to homotypic neighbours, whereas dendritic overlap might suggest a lack of homotypic constraints upon dendritic differentiation.
A direct comparison of two cell types that share a common set of afferents is informative here: both cone bipolar cells and horizontal cells have dendritic arbors that target the matrix of cone pedicles, each producing multiple dendritic endings that associate with each pedicle (Keeley & Reese, 2010b; Reese et al., 2005). In the mouse retina, the Type 7 ON-cone bipolar cell has been studied in some detail, showing a dendritic tiling within the outer plexiform layer (Fig. 10A) (Wässle et al., 2009) that is sensitive to homotypic cell density, increasing in dendritic field size when homotypic neighbours are depleted and decreasing in size when homotypic density is increased (Lee et al., 2011). Horizontal cells, by contrast, do not tile the retina, instead extending their dendritic arbors to reach as far as neighboring somata, and hence overlapping those arbors of their neighbours extensively (Fig. 11A), producing a calculated dendritic coverage factor (being the number of dendritic fields overlying each point on the retina, calculated as average cell density × dendritic field area) on the order of 6 (Reese et al., 2005). This cell type forms multiple gap-junctional contacts between those overlying dendrites (Janssen-Bienhold et al., 2009), broadening the receptive field of the horizontal cell (Shelley et al., 2006), and so there is some communicative significance to this overlap. Curiously, this dendritic overlap for the horizontal cells is also regulated through homotypic interactions, since genetic depletion or enhancement of horizontal cell density produces corresponding increases or decreases in dendritic field size, respectively (Poché et al., 2008; Reese et al., 2011; see also Bleckert et al., 2014). Homotypic regulation of dendritic field size, therefore, is not the exclusive purview of tiling dendrites.
Fig. 10.

Cone bipolar cells of a given type tile the retina in maturity, but invade one another’s territories during development. Type 7 cone bipolar cell dendritic field areas are modulated inversely with homotypic cell density in maturity (A), producing minimal overlap, if occasional co-innervation of shared pedicles around their perimeters (not shown). During development, however (B), Type 7 cone bipolar cells transiently invade one another’s dendritic territories to co-innervate more pedicles (as well as invading the spaces between cone pedicles) before retracting to form their tiled and punctate arbors.
Fig. 11.

Horizontal cells exhibit conspicuous dendritic overlap with their homotypic neighbours in maturity, but generate a tiling of their processes during development. As with the Type 7 cone bipolar cells, the dendritic field areas of horizontal cells are modulated inversely with homotypic cell density, but exhibit a dendritic coverage factor of around 6. As early as P10, each cone pedicle is contacted by this number of neighbouring horizontal cells, only two of which are illustrated (A). Dendritic field area is not affected by afferent innervation, for it remains unchanged in the coneless-mutant mouse retina, but individual horizontal cell dendritic arbors exhibit multiple self-crossings at this same age in the absence of their afferents (B). At birth, by contrast (C), before the horizontal cells achieve a stratified morphology characteristic of their mature organization (D), they distribute their processes to respect the terrains of their homotypic neighbours, approximating a tiling of their fields.
(c) Some cell types with overlapping dendritic arbors do not regulate their coverage
Despite having a dendritic arbor that exhibits a pattern consistent with self-avoidant outgrowth, the cholinergic amacrine cell has a large dendritic field that overlaps extensively with its homotypic neighbours, producing a dendritic coverage factor on the order of 30 in the mouse retina (Keeley et al., 2007). Its functional overlap may actually be closer to 2, given the functional independence of the cholinergic dendrites (Euler, Detwiler & Denk, 2002), each radiating dendrite emanating from the soma being its own functional unit and engaging in reciprocal synaptic connectivity with the opposing radial dendrite of a homotypic cell (Lee & Zhou, 2006). Interacting synaptically, one might expect the cholinergic amacrine cells to regulate their dendritic field size homotypically, yet large partial (~40%) depletions of this population during early development fail to modulate the ultimate dendritic field size achieved by remaining cells (Farajian et al., 2004). Despite their being the most seemingly self-avoidant amongst retinal cell types, those dendrites are apparently not constrained from crossing over their homotypic neighbours multiple times—they would appear to be largely indifferent to the density of that dendritic plexus.
Dopaminergic amacrine cells, as we have seen, produce highly irregular dendritic arbors that occasionally exhibit self-crossings. Their dendritic arbors are large (if sparse) relative to their density, being nearly ten times the area of the average Voronoi domain for each cell, based on the convex polygon enclosing their dendritic tips (though a coverage factor calculated in this way for such a sparsely populated dendritic arbor is likely to be meaningless from any functional perspective). This cell type exhibits frequent dendritic crossings between homotypic neighbours as well as the iso-neuronal crossings already mentioned (Fig. 12A), as if the dendrites were equally uninterested in the presence of the dopaminergic dendrites of other cells. When the density of this cell type is increased by a factor of four, in the Bax knockout retina, their dendritic arbors show nothing like a three-quarter reduction in areal size, although they are slightly smaller, perhaps because of another heteroneuronal influence altered in these manipulated retinas (Keeley & Reese, 2010a). The fact that these cells play a neuro-modulatory role, employing volume transmission of dopamine throughout the retina (Witkovsky, 2004), may obviate the need for any regulation of dendritic patterning or homotypic control of areal growth.
Fig. 12.

Dopaminergic amacrine cells of Dscam mutant mice exhibit self- and homotypically adhering dendritic arbors. Wild-type dopaminergic amacrine cell dendritic arbors are distributed as though they are indifferent to those of their homotypic neighbours, crossing through those neighbouring fields much as they form iso-neuronal crossings (A). In the Dscam-mutant retina, that indifference gives way to homotypic and self-adherence, the dendrites becoming conspicuously fasciculated (B).
This consideration of dendritic organization and overlap in maturity reveals that there are few consistent rules across cell types: the propensity of dendritic arbors to self-avoid, and to regulate field size homotypically, be it through tiling or via overlap, appear unrelated to one another, and a consideration of the density or patterning of their somata lends little additional insight to any co-organizational rules. Amongst mosaics with comparable density, they can differ in their regularity indexes and show even more distinctive dendritic coverage factors (Keeley et al., 2007; Reese et al., 2005). Amongst those that exhibit dendritic overlap, some engage in homotypic regulation while others do not. When overlap becomes extensive (e.g. when average dendritic radius exceeds average intercellular spacing), any homotypic regulation of field size seems improbable. Perhaps the only other features that may prove to co-vary are found (so far) for the dopaminergic amacrine cells, where a conspicuously irregular mosaic is associated with highly irregular dendritic arbors, wherein the irregularity of each is unrelated (i.e. the dendritic form is unrelated to the proximity to Voronoi neighbours; Keeley & Reese, 2010a).
(2) Dendritic differentiation during normal development
(a) Iso-neuronal contacts and crossings can give rise to self-avoidant dendritic arbors
Mature cholinergic amacrine cells exhibit dendrites that largely self-avoid, minimally crossing or contacting one another, interpreted as having been repelled by proximity during dendritic outgrowth. If they are examined during development, however, these cells do not exhibit proximity-dependent repulsion of their outgrowing dendrites, as has been suggested as a means of producing their mature morphology (Sugimura et al., 2007), but rather show an immensely branched dendritic arbor with multiple contacts and crossings between adjacent (iso-neuronal) dendrites (Fig. 13A, D) (Lefebvre et al., 2012; Stacy & Wong, 2003). Apparently, proximity- or contact-dependent branch elimination shapes the mature self-avoidant appearance of the arbor. Interestingly, Drosophila class IV sensory neurons, known for their self-avoidant dendritic arbors (Matthews et al., 2007), prune such arbors subsequently during development to lose all semblance of their earlier space-filling characteristic (Kanamori et al., 2013), suggesting that self-avoidant interactions are not necessarily for the purpose of generating uniformity of coverage within a field. Horizontal cells, while having some apparent dendritic crossings in maturity (Matsuoka et al., 2012), do not show many more during normal development once they have become stratified, yet in the absence of their cone afferents, they show a profusion of multiple iso-neuronal contacts and crossings, as though these dendrites are searching for their afferents (Fig. 11B) (Reese et al., 2005). This may indicate that the relative absence of self-crossings in maturity is unlikely to reflect any self-avoidant tendencies, instead being due to an attractant effect of the pedicles themselves, constrained only by the homotypic regulation of field size. That network of excessively branched self-crossing dendrites in the coneless retina at P10 subsequently regresses by maturity, yielding a skeletal dendritic arbor though retaining a comparable areal extent (Reese et al., 2005).
Fig. 13.

Cholinergic amacrine cells of Pcdhg-mutant mice, and Plexin A2 or Semaphorin 6A-mutant mice, fail to form self-avoidant dendritic arbors. Cholinergic amacrine cell dendritic fields in control mice (A, D), Pcdhg knockout mice (B, E), and PlexinA2 knockout mice (C, F), in maturity (A–C) and a few days after birth (D–F). Normal cholinergic dendritic arbors exhibit extensive iso-neuronal contacts and crossings during early postnatal development, becoming sculpted through process elimination to yield the self-avoiding distribution of dendrites in maturity (A). Pcdhg knockout mice show corrupted development of cholinergic arbors (B), being asymmetric and loosely bundled, if not truly fasciculated, from the outset (E). Plexin A2 knockout mice, like Semaphorin 6A knockout mice (not shown), display corrupted dendritic development, yielding grossly reduced and asymmetric dendritic arbor areas with only occasional self-crossing processes relative to the Pcdhg knockout retina (C). They lack the spatial coincidence of processes so conspicuous in the Pcdhg knockout retina.
(b) Some cell types tile initially, before generating overlap
The horizontal cells initially differentiate radially oriented processes before transitioning through a quasi-stellate dendritic morphology into their conspicuous stratified organization, doing so before the close of the first postnatal week (Reese et al., 2005). Prior to this transition, their radial dendrites approximate a tiling in the plane of the retina, when both the dendrites, as well as somal positioning, are sensitive to homotypic neighbours: local ablation of single cells yields a colonization of that dendritic territory by neighbouring dendritic fields, with a subsequent tendency for somal re-positioning in the direction of the dendritic expansion (Huckfeldt et al., 2009). Indeed, such dendro-dendritic interactions, driving repulsion between neighbouring cells, may be the means by which the exclusion zone is created for certain types of retinal neuron (Novelli, Resta & Galli-Resta, 2005), as cell-spacing has been shown to be dependent upon the dendritic cytoskeleton (Galli-Resta et al., 2002). Contact-mediated homotypic inhibition, then, may transiently constrain further dendritic growth (Fig. 11C), when somata re-position themselves within the centres of their tiling dendritic fields, prior to the transition to their mature horizontal morphology when further dendritic growth leads to overlap (Fig. 11D). That subsequent expansion of the dendritic field is under homotypic control too, as indicated above (Poché et al., 2008), where it may be mediated by the furthest outgrowing dendrites detecting the presence of neighboring somata, thereby achieving a conserved dendritic coverage factor of around 6 despite variation in density (Reese et al., 2005; but see also Keeley et al., 2013, for evidence that there may be an upper limit on this growth in the absence of homotypic constraints).
(c) Some cell types overlap initially, before they tile
Type 7 ON-cone bipolar cells, like all other cone bipolar cells, display a dendritic tiling in maturity, with their dendritic terminals being largely associated with the matrix of cone pedicles across the outer plexiform layer (Wässle et al., 2009). During development, the dendritic arbors of bipolar cells emerge from a single radial process as sprouted appendages, targeting the future outer plexiform layer as the latter emerges around the close of the first postnatal week (Morgan et al., 2006). By the end of the second postnatal week, a stratified dendritic arbor has formed, although the dendritic endings within the arbor-area populate the field somewhat indiscriminately, being positioned both at and between individual pedicles (Lee et al., 2011). Furthermore, dendritic areal size is significantly larger, as is the number of cone pedicles contacted, and single pairs of bipolar cells show greater dendritic overlap and co-innervation of single pedicles than in maturity (Fig. 10B) (Lee et al., 2011). This cell type, therefore, does not engage in a contact-mediated inhibition to generate tiling from the outset, but generates tiling secondarily after an initial overlap with homotypic neighbours (see also Dunn & Wong, 2012; this transition to tiling would appear to be independent of interactions with the afferents themselves, since coneless transgenic mice show no difference in final dendritic field area of the Type 7 ON-cone bipolar cells; Keeley & Reese, 2010b).
(3) Dendritic organization in mutant retinas
(a) Self-avoidance, protocadherins and semaphorin–plexin signalling
The self-avoidant characteristic of mature cholinergic amacrine cells appears to be sculpted from a profusely self-crossing dendritic arbor, suggesting that iso-neuronal repulsive interactions emerge secondarily, leading to the selective redistribution or pruning of dendrites to become free from one another (Lefebvre et al., 2012). Yet these iso-neuronal interactions do not appear to be playing out between homotypic dendritic fields, suggesting that cholinergic amacrine cells are capable of distinguishing self from non-self. The lack of dendritic expansion when the population of homotypic neighbours has been pharmacologically depleted would imply an indifference to them (Farajian et al., 2004), and the apparent co-fasciculation between opposing radial segments of dendritic spokes may be mediated through the dendrites of ON–OFF ganglion cells with which they also form synapses (Dacheux, Chimento & Amthor, 2003). Cholinergic amacrine cells may generate this ability to discriminate their own dendrites from those of homotypic cells by employing a stochastic combinatorial code of transmembrane protocadherin proteins, each individual cell expressing a unique combination permitting self-recognition (Lefebvre et al., 2012). Simply put, homotypic neurons, expressing different isoform combinations, regard one another as distinct, and in turn fail to interact in the manner by which their own dendrites achieve a self-avoidant organization.
The evidence for such a protocadherin code mediating self-recognition comes from studies that disrupt the protocadherin gamma gene sub-cluster (Pcdhg), showing a loss of dendritic self-avoidance in the mature dendritic arbors of cholinergic amacrine cells (Lefebvre et al., 2012). Because the self-avoidance behaviour is sculpted from an initially diffuse and overlapping set of dendrites, one might expect this genetic deletion of all 22 Pcdhg genes in this sub-cluster to yield a mature dendritic arbor approximating the immature, indiscriminate, form. Instead, however, these dendritic fields show conspicuous spatial coincidence, if not quite fasciculation, of their radial processes, leading to a loss of symmetry and self-avoidant territorial coverage in dendritic organization relative to normal cholinergic amacrine cells (Fig. 13B). The dendritic arbors of these mutant cholinergic amacrine cells exhibit a corrupted development from the outset, showing this same asymmetric and loosely coincident growth of their dendrites, a phenotype quite distinct from the iso-neuronal contacts and crossings normally observed during development (Fig. 13E) (Lefebvre et al., 2012). Loss of the Pcdhg sub-cluster yields dendritic outgrowth suggesting ectopic attraction—if not a tightly fasciculated growth—between iso-neuronal dendrites, not simply an indifference between them. Likewise, the dendritic arbors of neighbouring mutant cells exhibit this same spatial coincidence suggesting a heightened attraction relative to the wild-type retina (Lefebvre et al., 2012).
The self-avoidant characteristic of mature cholinergic amacrine cells can be restored in these Pcdhg-mutant retinas by expressing just a single isoform within the population. If in fact the isoform diversity normally mediates indifference to homotypic neighbours, then a population of cholinergic amacrine cells expressing only a single isoform might be expected to yield a network of cholinergic dendritic fields that, like the dendrites of single cholinergic amacrine cells, show minimal dendritic crossings or contacts. Curiously, such single-isoform-expressing mosaics largely regain their characteristic radially symmetric and self-avoidant fields exhibiting dendritic overlap with neighbouring cells (rather than tiling), although their opposing radial spokes apparently coincide less than they normally would have done (Lefebvre et al., 2012). In summary, while the loss of this protocadherin function clearly corrupts the outgrowth of cholinergic dendritic arbors, its normal function does not simply mediate a discrimination of self from non-self that can account for the absence of iso-neuronal self-crossings in maturity yet the freedom to cross those of their homotypic neighbours.
More recently, the membrane-bound ligand Semaphorin 6A, signalling through the Plexin A2 receptor, has also been suggested to play a role in creating the self-avoidant mature dendritic arbor of the cholinergic amacrine cells in the ganglion cell layer (Sun et al., 2013). Cholinergic amacrine cells in both Sema6A and PlexA2 knockout mice show dendritic fields that exhibit an increase in the frequency of dendritic self-crossings (Fig. 13C, F), suggesting that Semaphorin 6A and Plexin A2 expressed on the membrane interact with one another on adjacent dendrites in a repellent manner (Sun et al., 2013). Such a mechanism would be expected to be at work between the dendrites of adjacent cholinergic amacrine cells, but it apparently is not, given the 30-fold dendritic overlap of mouse cholinergic amacrine cells (Farajian et al., 2004; Keeley et al., 2007). Exactly how this signalling is restricted only to iso-neuronal processes is unclear, unless the interaction were somehow to be gated through a self-recognition mechanism like the one described above. Because these cells also show a significant reduction in the radial growth of their dendrites through development, including an entire loss of any radial dendrites on some sides of the soma (Fig. 13C, F), and since this signalling does not play a role in the formation of the dendritic morphology of the other population of cholinergic amacrine cells, in the inner nuclear layer, apparently due to their normal absence of Sema6A expression, the increased self-crossing may be secondary to these other aspects of their compromised development.
(b) Homotypic avoidance and Dscam
The Drosophila gene Dscam1, through stochastic alternative splicing, generates over 19,000 different isoforms that mediate homotypic interactions between the dendrites of sensory neurons expressing the same isoform. Each isoform ensures that dendrites from the same cell do not cross, yet isoform diversity allows homotypic neighbours to cross one another freely, failing to tile their dendritic arbors. By expressing only a single isoform between neighbouring sensory neurons, their dendrites now establish mutually exclusive domains, as might have been expected above, for the cholinergic amacrine cells (Lefebvre et al., 2012), tiling rather than overlapping (Hughes et al., 2007; Matthews et al., 2007; Soba et al., 2007). In mammals, Dscam and the related gene Dscaml1 lack such isoform diversity, but as their functional removal alters the dendritic organization of cell types that express either gene (de Andrade et al., 2014; Fuerst et al., 2008, 2009), they have been proposed to play a role in iso-neuronal and well as homotypic avoidance for those cell types (Fuerst & Burgess, 2009).
Perhaps best studied are the dopaminergic amacrine cells, which in the Dscam-mutant mouse retina show ectopic fasciculation of their dendrites (Figs 8D, 12B). Originally interpreted to indicate a normal homotypic avoidance mediated by Dscam on adjacent dopaminergic amacrine cells (Fuerst et al., 2008), subsequent analysis of single filled dopaminergic amacrine cells made clear that the dendrites of this cell type neither self-avoid nor exhibit avoidance of homotypic dendritic fields; these dendrites cross over one another apparently randomly, neither scaling nor orienting their dendritic arbors relative to global or local variations in density, respectively (Keeley & Reese, 2010a).
Other cell types express either Dscam or Dscaml1, and in their respective mutant retinas, phenotypes have been described that typically mimic the heightened cellular proximity (clustering) described above for dopaminergic amacrine cells; a few of them have also shown conspicuously clumped, possibly fasciculated, dendrites (Fuerst et al., 2009). Interestingly, most of these expressing cells (rod bipolar cells, AII amacrine cells, b-NOS amacrine cells, melanopsin-positive ganglion cells) do not normally exhibit dendritic tiling, suggesting that, as for the dopaminergic amacrine cells, the role of Dscam or Dscaml1 is not to promote homotypic avoidance, but rather acts to prevent adhesive interactions between like-type dendrites, rendering them indifferent to one another (Fuerst & Burgess, 2009). Having functional Dscam or Dscaml1 would appear to be important for preventing adhesion, but neither appears to be critical for generating either self- or homotypic avoidance. And as with the clustering phenotype described above, a similar fasciculation phenotype is obtained for melanopsin-positive retinal ganglion cells in the absence of the pro-apoptotic gene, Bax (Keeley et al., 2012), indicating that the Dscam-mediated masking of homotypic adhesion can itself be overcome.
Not all cell types, apparently, require a capacity for self- or homotypic recognition (Garrett & Burgess, 2011). Whatever the significance of the role Dscam and Dscaml1 may have in masking the molecular recognition leading to homotypic adhesion, it does not appear to be relevant for understanding how the dendrites of different types of retinal neuron pattern themselves to cover the retina in their characteristic manners. Molecular self- and homotypic recognition and the ensuing growth-inhibition or retraction/repulsion should be critical for generating self-spacing dendrites or dendrites that tile, but to date, those features are largely not representative of the cell types expressing either Dscam or Dscaml1. In these cell types, Dscam and Dscaml1 are shown to participate in this process not because they play a role in self- or homotypic recognition, but because they mask a propensity for certain types of neurons to adhere, fasciculate and/or cluster (evidenced in their absence): in short, intact Dscam and Dscaml1 simply permit the progression of the normal developmental events that contribute to the assembly of retinal mosaics.
IV. CONCLUSIONS
The various types of retinal neuron are produced across the retina in their respective numbers, and the mechanisms generating any particular type may bestow a limited degree of spacing within that population, potentially contributing some of the patterning observed in maturity (McCabe et al., 1999; Tyler et al., 2005). As they are generated, these cells migrate to their respective depths within the developing retina and begin differentiating. For some of these cell types, as they differentiate, their dendrites interact with like-type neighbours and their afferents, spacing their somata apart and generating their respective dendritic morphologies and coverage, although the way in which they do so may be unique for each cell type. For others, such spacing-apart of neighbours may play less of a role relative to programmed cell death in establishing the patterning present in their mosaics, and dendritic outgrowth for at least some of these cell types may be relatively free of homotypic influences, and quite possibly without any consequence for somal positioning.
The principles underlying the organization of some of these mosaics can be derived from their life histories, and from perturbation or other natural experiments that alter their proximity from like-type cells. Our new-found appreciation for Megf10 and Megf11 in mediating this self-spacing behaviour of horizontal and cholinergic amacrine cells (Kay et al., 2012) provides examples where disrupted gene function yields alterations in mosaic organization to be predicted from the principles inferred from former studies of their organization and assembly.
For other genes, disrupted gene function has yielded something quite a bit removed from the underlying principles inferred from a consideration of mosaic organization and dendritic patterning. Ectopic adhesion in the absence of Dscam function, for example, does not equal avoidance in its presence, and there is no convincing evidence that intact Dscam in the mouse retina promotes avoidance. The linkage between gene function and design principle is not always straightforward when comparing flies and mice, where the devil is in the detail, particularly in this case when comparing simple gene function in the complex vertebrate with homologous gene function (made complex through alternative splicing) in the simpler invertebrate (Schmucker & Chen, 2009). Fascinating as many of these mutant phenotypes are, the casual, frequently transferred, use of descriptors, some laden with inferred biological mechanism (clustering, adhering, bundling, fasciculating) may cloud our understanding of the unique features of each phenotype and how it may relate to the design principles at hand for that cell type.
As technologies improve for the three-dimensional visualization of individual neurons and their processes in brain structures (Chung et al., 2013; Livet et al., 2007), and for the analysis of three-dimensional spatial patterning (Eglen et al., 2008), we will be better able to address just how extensive these principles are within the brain, and the roles played by genes that may modulate them. Knocking down the expression of the transcription factor Special AT-rich sequence-binding protein 2 (SatB2) gene in the mouse neocortex, for instance, yields alterations in the distribution of supra-granular pyramidal neurons and their dendrites that have been interpreted in light of the clustering and fasciculation phenotypes of the Dscam-mutant mouse (L. Zhang et al., 2012), but much remains to be done to understand more fully the nature of the resultant changes in this cortex, let alone the developmental processes disrupted by the loss of this transcription factor, and how those translate to establish the organizational features of the mature neocortex.
Acknowledgments
Supported by the National Institutes of Health (EY-019968). We thank Nils Madsen for assistance with the figures.
VI. REFERENCES
- Allison WT, Barthel LK, Skebo KM, Takechi M, Kawamura S, Raymond PA. Ontogeny of cone photoreceptor mosaics in zebrafish. Journal of Comparative Neurology. 2010;518:4182–4195. doi: 10.1002/cne.22447. [DOI] [PMC free article] [PubMed] [Google Scholar]
- Bleckert A, Schwartz GW, Turner MH, Rieke F, Wong RO. Visual space is represented by nonmatching topographies of distinct mouse retinal ganglion cell types. Current Biology. 2014 doi: 10.1016/j.cub.2013.12.020. [DOI] [PMC free article] [PubMed] [Google Scholar]
- Chen SK, Chew KS, McNeill DS, Keeley PW, Ecker JL, Mao B, Pahlberg J, Kim B, Lee SCS, Fox M, et al. Apoptosis regulates ipRGC spacing necessary for rods and cones to drive circadian photoentrainment. Neuron. 2013;77:503–515. doi: 10.1016/j.neuron.2012.11.028. [DOI] [PMC free article] [PubMed] [Google Scholar]
- Cheng PL, Poo MM. Early events in axon/dendrite polarization. Annual Review of Neuroscience. 2012;35:181–201. doi: 10.1146/annurev-neuro-061010-113618. [DOI] [PubMed] [Google Scholar]
- Chung K, Wallace J, Kim SY, Kalyanasundaram S, Andalman AS, Davidson TJ, Mirzabekov JJ, Zalocusky KA, Mattis J, Denisin AK, et al. Structural and molecular interrogation of intact biological systems. Nature Genetics. 2013;497:332–337. doi: 10.1038/nature12107. [DOI] [PMC free article] [PubMed] [Google Scholar]
- Cook JE. Spatial properties of retinal mosaics: An empirical evaluation of some existing measures. Visual Neuroscience. 1996;13:15–30. doi: 10.1017/s0952523800007094. [DOI] [PubMed] [Google Scholar]
- Dacey DM. The mosaic of midget ganglion cells in the human retina. Journal of Neuroscience. 1993;13:5334–5355. doi: 10.1523/JNEUROSCI.13-12-05334.1993. [DOI] [PMC free article] [PubMed] [Google Scholar]
- Dacey DM, Petersen MR. Dendritic field size and morphology of midget and parasol ganglion cells of the human retina. Proceedings of the National Academy of Sciences of the United States of America. 1992;89:9666–9670. doi: 10.1073/pnas.89.20.9666. [DOI] [PMC free article] [PubMed] [Google Scholar]
- Dacheux RF, Chimento MF, Amthor FR. Synaptic input to the on-off directionally selective ganglion cell in the rabbit retina. Journal of Comparative Neurology. 2003;456:267–278. doi: 10.1002/cne.10521. [DOI] [PubMed] [Google Scholar]
- Davenport CM, Detwiler PB, Dacey DM. Functional polarity of dendrites and axons of primate A1 amacrine cells. Visual Neuroscience. 2007;24:449–457. doi: 10.1017/S0952523807070010. [DOI] [PMC free article] [PubMed] [Google Scholar]
- de Andrade GB, Long SS, Fleming H, Li W, Fuerst PG. DSCAM localization and function at the mouse cone synapse. Journal of Comparative Neurology. 2014 doi: 10.1002/cne.23552. in press. [DOI] [PMC free article] [PubMed] [Google Scholar]
- Dekkers MP, Barde YA. Developmental biology. Programmed cell death in neuronal development. Science. 2013;340:39–41. doi: 10.1126/science.1236152. [DOI] [PubMed] [Google Scholar]
- Diggle PJ. Statistical analysis of spatial point patterns. 2. London: Edward Arnold; 2002. [Google Scholar]
- Ding Q, Chen H, Xie X, Libby RT, Tian N, Gan L. BARHL2 differentially regulates the development of retinal amacrine and ganglion neurons. Journal of Neuroscience. 2009;29:3992–4003. doi: 10.1523/JNEUROSCI.5237-08.2009. [DOI] [PMC free article] [PubMed] [Google Scholar]
- Dunn FA, Wong RO. Diverse strategies engaged in establishing stereotypic wiring patterns among neurons sharing a common input at the visual system’s first synapse. Journal of Neuroscience Methods. 2012;32:10306–10317. doi: 10.1523/JNEUROSCI.1581-12.2012. [DOI] [PMC free article] [PubMed] [Google Scholar]
- Eglen SJ, Galli-Resta L. Retinal mosaics. In: Sernagor E, Eglen S, Harris B, Wong R, editors. Retinal Development. Cambridge: Cambridge University Press; 2006. pp. 193–207. [Google Scholar]
- Eglen SJ, Lofgreen DD, Raven MA, Reese BE. Analysis of spatial relationships in three dimensions: Tools for the study of nerve cell patterning. BMC Neuroscience. 2008;9:68. doi: 10.1186/1471-2202-9-68. [DOI] [PMC free article] [PubMed] [Google Scholar]
- Eglen SJ, Raven MA, Tamrazian E, Reese BE. Dopaminergic amacrine cells in the inner nuclear layer and ganglion cell layer comprise a single functional retinal mosaic. Journal of Comparative Neurology. 2003;466:343–355. doi: 10.1002/cne.10891. [DOI] [PubMed] [Google Scholar]
- Eglen SJ, Willshaw DJ. Influence of cell fate mechanisms upon retinal mosaic formation: A modelling study. Development. 2002;129:5399–5408. doi: 10.1242/dev.00118. [DOI] [PubMed] [Google Scholar]
- Emoto K. Signaling mechanisms that coordinate the development and maintenance of dendritic fields. Current Opinion in Neurobiology. 2012;22:805–811. doi: 10.1016/j.conb.2012.04.005. [DOI] [PubMed] [Google Scholar]
- Euler T, Detwiler PB, Denk W. Directionally selective calcium signals in dendrites of starburst amacrine cells. Nature. 2002;418:845–852. doi: 10.1038/nature00931. [DOI] [PubMed] [Google Scholar]
- Eysel UT, Peichl L, Wässle H. Dendritic plasticity in the early postnatal feline retina: Quantitative characteristics and sensitive period. Journal of Comparative Neurology. 1985;242:134–145. doi: 10.1002/cne.902420109. [DOI] [PubMed] [Google Scholar]
- Farajian R, Raven MA, Cusato K, Reese BE. Cellular positioning and dendritic field size of cholinergic amacrine cells are impervious to early ablation of neighboring cells in the mouse retina. Visual Neuroscience. 2004;21:13–22. doi: 10.1017/s0952523804041021. [DOI] [PubMed] [Google Scholar]
- Fuerst PG, Bruce F, Tian M, Wei W, Elstrott J, Feller MB, Erskine L, Singer JH, Burgess RW. DSCAM and DSCAML1 function in self-avoidance in multiple cell types in the developing mouse retina. Neuron. 2009;64:484–497. doi: 10.1016/j.neuron.2009.09.027. [DOI] [PMC free article] [PubMed] [Google Scholar]
- Fuerst PG, Burgess RW. Adhesion molecules in establishing retinal circuitry. Current Opinion in Neurobiology. 2009;19:389–394. doi: 10.1016/j.conb.2009.07.013. [DOI] [PMC free article] [PubMed] [Google Scholar]
- Fuerst PG, Koizumi A, Masland RH, Burgess RW. Neurite arborization and mosaic spacing in the mouse retina require DSCAM. Nature. 2008;451:470–474. doi: 10.1038/nature06514. [DOI] [PMC free article] [PubMed] [Google Scholar]
- Galli-Resta L, Novelli E. The effects of natural cell loss on the regularity of the retinal cholinergic arrays. Journal of Neuroscience. 2000;20:RC60, 61–65. doi: 10.1523/JNEUROSCI.20-03-j0005.2000. [DOI] [PMC free article] [PubMed] [Google Scholar]
- Galli-Resta L, Novelli E, Kryger Z, Jacobs GH, Reese BE. Modelling the mosaic organization of rod and cone photoreceptors with a minimal-spacing rule. European Journal of Neuroscience. 1999;11:1461–1469. doi: 10.1046/j.1460-9568.1999.00555.x. [DOI] [PubMed] [Google Scholar]
- Galli-Resta L, Novelli E, Viegi A. Dynamic microtubule-dependent interactions position homotypic neurones in regular monolayered arrays during retinal development. Development. 2002;129:3803–3814. doi: 10.1242/dev.129.16.3803. [DOI] [PubMed] [Google Scholar]
- Galli-Resta L, Resta G, Tan SS, Reese BE. Mosaics of islet-1 expressing amacrine cells assembled by short range cellular interactions. Journal of Neuroscience. 1997;17:7831–7838. doi: 10.1523/JNEUROSCI.17-20-07831.1997. [DOI] [PMC free article] [PubMed] [Google Scholar]
- Garrett AM, Burgess RW. Candidate molecular mechanisms for establishing cell identity in the developing retina. Developmental Neurobiology. 2011;71:1258–1272. doi: 10.1002/dneu.20926. [DOI] [PMC free article] [PubMed] [Google Scholar]
- Garrett AM, Tadenev AL, Burgess RW. DSCAMs: restoring balance to developmental forces. Frontiers in Molecular Neuroscience. 2012;5:86. doi: 10.3389/fnmol.2012.00086. [DOI] [PMC free article] [PubMed] [Google Scholar]
- Grimes WN, Zhang J, Graydon CW, Kachar B, Diamond JS. Retinal parallel processors: more than 100 independent microcircuits operate within a single interneuron. Neuron. 2010;65:873–885. doi: 10.1016/j.neuron.2010.02.028. [DOI] [PMC free article] [PubMed] [Google Scholar]
- Grueber WB, Sagasti A. Self-avoidance and tiling: Mechanisms of dendrite and axon spacing. Cold Spring Harbor Perspectives in Biology. 2010;2:a001750. doi: 10.1101/cshperspect.a001750. [DOI] [PMC free article] [PubMed] [Google Scholar]
- Guillemot F. Cell fate specification in the mammalian telencephalon. Progress in Neurobiology. 2007;83:37–52. doi: 10.1016/j.pneurobio.2007.02.009. [DOI] [PubMed] [Google Scholar]
- Helmstaedter M, Briggman KL, Turaga SC, Jain V, Seung HS, Denk W. Connectomic reconstruction of the inner plexiform layer in the mouse retina. Nature. 2013;500:168–174. doi: 10.1038/nature12346. [DOI] [PubMed] [Google Scholar]
- Hore VR, Troy JB, Eglen SJ. Parasol cell mosaics are unlikely to drive the formation of structured orientation maps in primary visual cortex. Visual Neuroscience. 2012;29:283–299. doi: 10.1017/S0952523812000338. [DOI] [PMC free article] [PubMed] [Google Scholar]
- Huberman AD, Manu M, Koch SM, Susman MW, Lutz AB, Ullian EM, Baccus SA, Barres BA. Architecture and activity-mediated refinement of axonal projections from a mosaic of genetically identified retinal ganglion cells. Neuron. 2008;59:425–438. doi: 10.1016/j.neuron.2008.07.018. [DOI] [PMC free article] [PubMed] [Google Scholar]
- Huckfeldt RM, Schubert T, Morgan JL, Godinho L, Di Cristo G, Huang ZJ, Wong ROL. Transient neurites of retinal horizontal cells exhibit columnar tiling via homotypic interactions. Nature Neuroscience. 2009;12:35–43. doi: 10.1038/nn.2236. [DOI] [PMC free article] [PubMed] [Google Scholar]
- Hughes ME, Bortnick R, Tsubouchi A, Bäumer P, Kondo M, Uemura T, Schmucker D. Homophilic Dscam interactions control complex dendrite morphogenesis. Neuron. 2007;54:417–427. doi: 10.1016/j.neuron.2007.04.013. [DOI] [PMC free article] [PubMed] [Google Scholar]
- Jan YN, Jan LY. Branching out: mechanisms of dendritic arborization. Nature Reviews Neuroscience. 2010;11:316–328. doi: 10.1038/nrn2836. [DOI] [PMC free article] [PubMed] [Google Scholar]
- Janssen-Bienhold U, Trümpler J, Hilgen G, Schultz K, Müller LP, Sonntag S, Dedek K, Dirks P, Willecke K, Weiler R. Connexin57 is expressed in dendro-dendritic and axo-axonal gap junctions of mouse horizontal cells and its distribution is modulated by light. Journal of Comparative Neurology. 2009;513:363–374. doi: 10.1002/cne.21965. [DOI] [PubMed] [Google Scholar]
- Kanamori T, Kanai MI, Dairyo Y, Yasunaga K, Morikawa RK, Emoto K. Compartmentalized calcium transients trigger dendrite pruning in Drosophila sensory neurons. Science. 2013;340:1475–1478. doi: 10.1126/science.1234879. [DOI] [PubMed] [Google Scholar]
- Kay JN, Chu MW, Sanes JR. MEGF10 and MEGF11 mediate homotypic interactions required for mosaic spacing of retinal neurons. Nature. 2012;483:465–469. doi: 10.1038/nature10877. [DOI] [PMC free article] [PubMed] [Google Scholar]
- Keeley PW, Luna G, Fariss RN, Skyles KA, Madsen NR, Raven MA, Poché RA, Swindell EC, Jamrich M, Oh EC, et al. Development and plasticity of outer retinal circuitry following genetic removal of horizontal cells. Journal of Neuroscience. 2013;33:17847–17862. doi: 10.1523/JNEUROSCI.1373-13.2013. [DOI] [PMC free article] [PubMed] [Google Scholar]
- Keeley PW, Reese BE. Morphology of dopaminergic amacrine cells in the mouse retina: Independence from homotypic interactions. Journal of Comparative Neurology. 2010a;518:1220–1231. doi: 10.1002/cne.22270. [DOI] [PMC free article] [PubMed] [Google Scholar]
- Keeley PW, Reese BE. Role of afferents in the differentiation of bipolar cells in the mouse retina. Journal of Neuroscience. 2010b;30:1677–1685. doi: 10.1523/JNEUROSCI.5153-09.2010. [DOI] [PMC free article] [PubMed] [Google Scholar]
- Keeley PW, Sliff BJ, Lee SC, Fuerst PG, Burgess RW, Eglen SJ, Reese BE. Neuronal clustering and fasciculation phenotype in Dscam- and Bax-deficient mouse retinas. Journal of Comparative Neurology. 2012;520:1349–1364. doi: 10.1002/cne.23033. [DOI] [PMC free article] [PubMed] [Google Scholar]
- Keeley PW, Whitney IE, Raven MA, Reese BE. Dendritic spread and functional coverage of starburst amacrine cells. Journal of Comparative Neurology. 2007;505:539–546. doi: 10.1002/cne.21518. [DOI] [PubMed] [Google Scholar]
- Kiecker C, Lumsden A. The role of organizers in patterning the nervous system. Annual Review of Neuroscience. 2012;35:347–367. doi: 10.1146/annurev-neuro-062111-150543. [DOI] [PubMed] [Google Scholar]
- Kim IJ, Zhang Y, Yamagata M, Meister M, Sanes JR. Molecular identification of a retinal cell type that responds to upward motion. Nature. 2008;452:478–482. doi: 10.1038/nature06739. [DOI] [PubMed] [Google Scholar]
- Kirby MA, Chalupa LM. Retinal crowding alters the morphology of alpha ganglion cells. Journal of Comparative Neurology. 1986;251:532–541. doi: 10.1002/cne.902510408. [DOI] [PubMed] [Google Scholar]
- Kise Y, Schmucker D. Role of self-avoidance in neuronal wiring. Current Opinion in Neurobiology. 2013 doi: 10.1016/j.conb.2013.1009.1011. [DOI] [PubMed] [Google Scholar]
- Kram YA, Mantey S, Corbo JC. Avian cone photoreceptors tile the retina as five independent, self-organizing mosaics. PLoS ONE. 2010;5:e8992. doi: 10.1371/journal.pone.0008992. [DOI] [PMC free article] [PubMed] [Google Scholar]
- Kryger Z, Galli-Resta L, Jacobs GH, Reese BE. The topography of rod and cone photoreceptors in the retina of the ground squirrel. Visual Neuroscience. 1998;15:685–691. doi: 10.1017/s0952523898154081. [DOI] [PubMed] [Google Scholar]
- Lee S, Zhou ZJ. The synaptic mechanism of direction selectivity in distal processes of starburst amacrine cells. Neuron. 2006;51:787–799. doi: 10.1016/j.neuron.2006.08.007. [DOI] [PMC free article] [PubMed] [Google Scholar]
- Lee SC, Cowgill EJ, Al-Nabulsi A, Quinn EJ, Evans SM, Reese BE. Homotypic regulation of neuronal morphology and connectivity in the mouse retina. Journal of Neuroscience. 2011;31:14126–14133. doi: 10.1523/JNEUROSCI.2844-11.2011. [DOI] [PMC free article] [PubMed] [Google Scholar]
- Lefebvre JL, Kostadinov D, Chen WV, Maniatis T, Sanes JR. Protocadherins mediate dendritic self-avoidance in the mammalian nervous system. Nature. 2012;488:517–521. doi: 10.1038/nature11305. [DOI] [PMC free article] [PubMed] [Google Scholar]
- Lin B, Wang SW, Masland RH. Retinal ganglion cell type, size, and spacing can be specified independent of homotypic dendritic contacts. Neuron. 2004;43:475–485. doi: 10.1016/j.neuron.2004.08.002. [DOI] [PubMed] [Google Scholar]
- Linden R, Reese BE. Programmed cell death. In: Sernagor E, Eglen S, Harris B, Wong R, editors. Retinal Development. Cambridge: Cambridge University Press; 2006. pp. 208–241. [Google Scholar]
- Livet J, Weissman TA, Kang H, Draft RW, Lu J, Bennis RA, Sanes JR, Lichtman JW. Transgenic strategies for combinatorial expression of fluorescent proteins in the nervous system. Nature. 2007;450:56–62. doi: 10.1038/nature06293. [DOI] [PubMed] [Google Scholar]
- Matsuoka RL, Jiang Z, Samuels IS, Nguyen-Ba-Charvet KT, Sun LO, Peachey NS, Chedotal A, Yau KW, Kolodkin AL. Guidance-cue control of horizontal cell morphology, lamination, and synapse formation in the mammalian outer retina. Journal of Neuroscience. 2012;32:6859–6868. doi: 10.1523/JNEUROSCI.0267-12.2012. [DOI] [PMC free article] [PubMed] [Google Scholar]
- Matthews BJ, Kim ME, Flanagan JJ, Hattori D, Clemens JC, Zipursky SL, Grueber WB. Dendrite self-avoidance is controlled by Dscam. Cell. 2007;129:593–604. doi: 10.1016/j.cell.2007.04.013. [DOI] [PubMed] [Google Scholar]
- McCabe KL, Gunther EC, Reh TA. The development of the pattern of retinal ganglion cells in the chick retina: mechanisms that control differentiation. Development. 1999;126:5713–5724. doi: 10.1242/dev.126.24.5713. [DOI] [PubMed] [Google Scholar]
- Millard SS, Zipursky SL. Dscam-mediated repulsion controls tiling and self-avoidance. Current Opinion in Neurobiology. 2008;18:84–89. doi: 10.1016/j.conb.2008.05.005. [DOI] [PMC free article] [PubMed] [Google Scholar]
- Morgan JL, Dhingra A, Vardi N, Wong RO. Axons and dendrites originate from neuroepithelial-like processes of retinal bipolar cells. Nature Neuroscience. 2006;9:85–92. doi: 10.1038/nn1615. [DOI] [PubMed] [Google Scholar]
- Novelli E, Resta V, Galli-Resta L. Mechanisms controlling the formation of retinal mosaics. Progress in Brain Research. 2005;147:141–153. doi: 10.1016/S0079-6123(04)47011-3. [DOI] [PubMed] [Google Scholar]
- Parrish JZ, Emoto K, Kim MD, Jan YN. Mechanisms that regulate establishment, maintenance, and remodeling of dendritic fields. Annual Review of Neuroscience. 2007;30:399–423. doi: 10.1146/annurev.neuro.29.051605.112907. [DOI] [PubMed] [Google Scholar]
- Perry VH, Linden R. Evidence for dendritic competition in the developing retina. Nature. 1982;297:683–685. doi: 10.1038/297683a0. [DOI] [PubMed] [Google Scholar]
- Poché RA, Raven MA, Kwan KM, Furuta Y, Behringer RR, Reese BE. Somal positioning and dendritic growth of horizontal cells are regulated by interactions with homotypic neighbors. European Journal of Neuroscience. 2008;27:1607–1614. doi: 10.1111/j.1460-9568.2008.06132.x. [DOI] [PMC free article] [PubMed] [Google Scholar]
- Raven MA, Eglen SJ, Ohab JJ, Reese BE. Determinants of the exclusion zone in dopaminergic amacrine cell mosaics. Journal of Comparative Neurology. 2003;461:123–136. doi: 10.1002/cne.10693. [DOI] [PubMed] [Google Scholar]
- Raven MA, Reese BE. Horizontal cell density and mosaic regularity in pigmented and albino mouse retina. Journal of Comparative Neurology. 2002;454:168–176. doi: 10.1002/cne.10444. [DOI] [PubMed] [Google Scholar]
- Raven MA, Stagg SB, Nassar H, Reese BE. Developmental improvement in the regularity and packing of mouse horizontal cells: Implications for mechanisms underlying mosaic pattern formation. Visual Neuroscience. 2005;22:569–573. doi: 10.1017/S095252380522504X. [DOI] [PubMed] [Google Scholar]
- Raymond PA, Barthel LK. A moving wave patterns the cone photoreceptor mosaic array in the zebrafish retina. International Journal of Developmental Biology. 2004;48:935–945. doi: 10.1387/ijdb.041873pr. [DOI] [PubMed] [Google Scholar]
- Reese BE. Mosaics, tiling and coverage by retinal neurons. In: Masland RH, Albright T, editors. The Senses: Vision. Oxford: Elsevier; 2008. pp. 439–456. [Google Scholar]
- Reese BE. Retinal mosaics: Pattern formation driven by ocal interactions between homotypic neighbors. Frontiers in Neural Circuits. 2012;6:24. doi: 10.3389/fncir.2012.00024. [DOI] [PMC free article] [PubMed] [Google Scholar]
- Reese BE, Galli-Resta L. The role of tangential dispersion in retinal mosaic formation. Progress in Retinal and Eye Research. 2002;21:153–168. doi: 10.1016/s1350-9462(01)00024-6. [DOI] [PubMed] [Google Scholar]
- Reese BE, Keeley PW, Lee SC, Whitney IE. Developmental plasticity of dendritic morphology and the establishment of coverage and connectivity in the outer retina. Developmental Neurobiology. 2011;71:1273–1285. doi: 10.1002/dneu.20903. [DOI] [PMC free article] [PubMed] [Google Scholar]
- Reese BE, Necessary BD, Tam PPL, Faulkner-Jones B, Tan SS. Clonal expansion and cell dispersion in the developing mouse retina. European Journal of Neuroscience. 1999;11:2965–2978. doi: 10.1046/j.1460-9568.1999.00712.x. [DOI] [PubMed] [Google Scholar]
- Reese BE, Raven MA, Stagg SB. Afferents and homotypic neighbors regulate horizontal cell morphology, connectivity and retinal coverage. Journal of Neuroscience. 2005;25:2167–2175. doi: 10.1523/JNEUROSCI.4876-04.2005. [DOI] [PMC free article] [PubMed] [Google Scholar]
- Resta V, Novelli E, Di Virgilio F, Galli-Resta L. Neuronal death induced by endogenous extracellular ATP in retinal cholinergic neuron density control. Development. 2005;132:2873–2882. doi: 10.1242/dev.01855. [DOI] [PubMed] [Google Scholar]
- Rockhill RL, Euler T, Masland RH. Spatial order within but not between types of retinal neurons. Proceedings of the National Academy of Sciences of the United States of America. 2000;97:2303–2307. doi: 10.1073/pnas.030413497. [DOI] [PMC free article] [PubMed] [Google Scholar]
- Rodieck RW. The density recovery profile: A method for the analysis of points in the plane applicable to retinal studies. Visual Neuroscience. 1991;6:95–111. doi: 10.1017/s095252380001049x. [DOI] [PubMed] [Google Scholar]
- Roorda A, Metha AB, Lennie P, Williams DR. Packing arrangement of the three cone classes in primate retina. Vision Research. 2001;41:1291–1306. doi: 10.1016/s0042-6989(01)00043-8. [DOI] [PubMed] [Google Scholar]
- Sanes JR, Zipursky SL. Design principles of insect and vertebrate visual systems. Neuron. 2010;66:15–36. doi: 10.1016/j.neuron.2010.01.018. [DOI] [PMC free article] [PubMed] [Google Scholar]
- Schmucker D, Chen B. Dscam and DSCAM: complex genes in simple animals, complex animals yet simple genes. Genes and Development. 2009;23:147–156. doi: 10.1101/gad.1752909. [DOI] [PubMed] [Google Scholar]
- Shelley J, Dedek K, Schubert T, Feigenspan A, Schultz K, Hombach S, Willecke K, Weiler R. Horizontal cell receptive fields are reduced in connexin57-deficient mice. European Journal of Neuroscience. 2006;23:3176–3186. doi: 10.1111/j.1460-9568.2006.04848.x. [DOI] [PubMed] [Google Scholar]
- Soba P, Zhu S, Emoto K, Younger S, Yang SJ, Yu HH, Lee T, Jan LY, Jan YN. Drosophila sensory neurons require Dscam for dendritic self-avoidance and proper dendritic field organization. Neuron. 2007;54:403–416. doi: 10.1016/j.neuron.2007.03.029. [DOI] [PMC free article] [PubMed] [Google Scholar]
- Solecki DJ. Sticky situations: recent advances in control of cell adhesion during neuronal migration. Current Opinion in Neurobiology. 2012;22:791–798. doi: 10.1016/j.conb.2012.04.010. [DOI] [PMC free article] [PubMed] [Google Scholar]
- Stacy RC, Wong ROL. Developmental relationship between cholinergic amacrine cell processes and ganglion cell dendrites of the mouse retina. Journal of Comparative Neurology. 2003;456:154–166. doi: 10.1002/cne.10509. [DOI] [PubMed] [Google Scholar]
- Stenkamp DL, Cameron DA. Cellular pattern formation in the retina: retinal regeneration as a model system. Molecular Vision. 2002;8:280–293. [PubMed] [Google Scholar]
- Stenkamp DL, Powers MK, Carney LH, Cameron DA. Evidence for two distinct mechanisms of neurogenesis and cellular pattern formation in regenerated goldfish retinas. Journal of Comparative Neurology. 2001;431:363–381. doi: 10.1002/1096-9861(20010319)431:4<363::aid-cne1076>3.0.co;2-7. [DOI] [PubMed] [Google Scholar]
- Strettoi E, Volpini M. Retinal organization in the bcl-2-overexpressing transgenic mouse. Journal of Comparative Neurology. 2002;446:1–10. doi: 10.1002/cne.10177. [DOI] [PubMed] [Google Scholar]
- Sugimura K, Shimono K, Uemura T, Mochizuki A. Self-organizing mechanism for development of space-filling neuronal dendrites. PLoS Computational Biology. 2007;3 doi: 10.1371/journal.pcbi.0030212. [DOI] [PMC free article] [PubMed] [Google Scholar]
- Sun LO, Jiang Z, Rivlin-Etzion M, Hand R, Brady CM, Matsuoka RL, Yau K-W, Feller MB, Kolodkin AL. On and Off retinal circuit assembly by divergent molecular mechanisms. Science. 2013:342. doi: 10.1126/science.1241974. [DOI] [PMC free article] [PubMed] [Google Scholar]
- Tong Y, Eigler T. Transcriptional targets for pituitary tumor-transforming gene-1. Journal of Molecular Endocrinology. 2002;43:179–185. doi: 10.1677/JME-08-0176. [DOI] [PubMed] [Google Scholar]
- Tsukamoto Y, Omi N. Functional allocation of synaptic contacts in microcircuits from rods via rod bipolar to aii amacrine cells in the mouse retina. Journal of Comparative Neurology. 2013;521:3541–3555. doi: 10.1002/cne.23370. [DOI] [PMC free article] [PubMed] [Google Scholar]
- Tyler MJ, Carney LH, Cameron DA. Control of cellular pattern formation in the vertebrate inner retina by homotypic regulation of cell-fate decisions. Journal of Neuroscience. 2005;25:4565–4576. doi: 10.1523/JNEUROSCI.0588-05.2005. [DOI] [PMC free article] [PubMed] [Google Scholar]
- Waites CL, Craig AM, Garner CC. Mechanisms of vertebrate synaptogenesis. Annual Review of Neuroscience. 2005;28:251–274. doi: 10.1146/annurev.neuro.27.070203.144336. [DOI] [PubMed] [Google Scholar]
- Wässle H, Peichl L, Boycott BB. Topography of horizontal cells in the retina of the domestic cat. Proceedings of the Royal Society of London B. 1978;203:269–291. doi: 10.1098/rspb.1978.0105. [DOI] [PubMed] [Google Scholar]
- Wässle H, Peichl L, Boycott BB. Dendritic territories of cat retinal ganglion cells. Nature. 1981;292:344–345. doi: 10.1038/292344a0. [DOI] [PubMed] [Google Scholar]
- Wässle H, Puller C, Müller F, Haverkamp S. Cone contacts, mosaics and territories of bipolar cells in the mouse retina. Journal of Neuroscience. 2009;29:106–117. doi: 10.1523/JNEUROSCI.4442-08.2009. [DOI] [PMC free article] [PubMed] [Google Scholar]
- Wässle H, Riemann HJ. The mosaic of nerve cells in the mammalian retina. Proceedings of the Royal Society of London B. 1978;200:441–461. doi: 10.1098/rspb.1978.0026. [DOI] [PubMed] [Google Scholar]
- Whitney IE, Raven MA, Ciobanu DC, Poché RA, Ding Q, Elshatory Y, Gan L, Williams RW, Reese BE. Genetic modulation of horizontal cell number in the mouse retina. Proceedings of the National Academy of Sciences of the United States of America. 2011;108:9697–9702. doi: 10.1073/pnas.1103253108. [DOI] [PMC free article] [PubMed] [Google Scholar]
- Whitney IE, Raven MA, Ciobanu DC, Williams RW, Reese BE. Multiple genes on chromosome 7 regulate dopaminergic amacrine cell number in the mouse retina. Investigative Ophthalmology and Visual Science. 2009;50:1996–2003. doi: 10.1167/iovs.08-2556. [DOI] [PMC free article] [PubMed] [Google Scholar]
- Whitney IE, Raven MA, Keeley PW, Reese BE. Spatial patterning of cholinergic amacrine cells in the mouse retina. Journal of Comparative Neurology. 2008;508:1–12. doi: 10.1002/cne.21630. [DOI] [PMC free article] [PubMed] [Google Scholar]
- Willardsen MI, Link BA. Cell biological regulation of division fate in vertebrate neuroepithelial cells. Developmental Dynamics. 2011;240:1865–1879. doi: 10.1002/dvdy.22684. [DOI] [PMC free article] [PubMed] [Google Scholar]
- Witkovsky P. Dopamine and retinal function. Documenta Ophthalmologica. 2004;108:17–40. doi: 10.1023/b:doop.0000019487.88486.0a. [DOI] [PubMed] [Google Scholar]
- Zhang L, Song NN, Chen JY, Huang Y, Li H, Ding YQ. Satb2 is required for dendritic arborization and soma spacing in mouse cerebral cortex. Cerebral Cortex. 2012;22:1510–1519. doi: 10.1093/cercor/bhr215. [DOI] [PubMed] [Google Scholar]
- Zhang Y, Kim IJ, Sanes JR, Meister M. The most numerous ganglion cell type of the mouse retina is a selective feature detector. Proceedings of the National Academy of Sciences of the United States of America. 2012;109:2391–2398. doi: 10.1073/pnas.1211547109. [DOI] [PMC free article] [PubMed] [Google Scholar]