Abstract
Background
Most methods of assessing colonic motility are poorly acceptable to patients. Magnetic resonance imaging (MRI) can monitor gastrointestinal motility and fluid distributions. We predicted that a dose of oral polyethylene glycol (PEG) and electrolyte solution would increase ileo-colonic inflow and stimulate colonic motility. We aimed to investigate the colonic response to distension by oral PEG electrolyte in healthy volunteers (HVs) and to evaluate the effect of single 2 L vs split (2 × 1 L) dosing.
Methods
Twelve HVs received a split dose (1 L the evening before and 1 L on the study day) and another 12 HVs a single dose (2 L on the main study day) of PEG electrolyte. They underwent MRI scans, completed symptom questionnaires, and provided stool samples. Outcomes included small bowel water content, ascending colon motility index, and regional colonic volumes.
Key Results
Small bowel water content increased fourfold from baseline after ingesting both split (p = 0.0010) and single dose (p = 0.0005). The total colonic volume increase from baseline was smaller for the split dose at 35 ± 8% than for the single dose at 102 ± 27%, p = 0.0332. The ascending colon motility index after treatment was twofold higher for the single dose group (p = 0.0103).
Conclusions & Inferences
Ingestion of 1 and 2 L PEG electrolyte solution caused a rapid increase in the small bowel and colonic volumes and a robust rise in colonic motility. The increase in both volumes and motility was dose dependent. Such a challenge, being well-tolerated, could be a useful way of assessing colonic motility in future studies.
Keywords: colon, intestinal fluid, motility, small bowel, symptoms
Key Messages.
Current methods of assessing colonic motility have significant limitations of expense, availability and patient acceptability.
We aimed to investigate the use of oral polyethylene glycol (PEG) electrolyte as standardized colonic stimulation and magnetic resonance imaging (MRI) to monitor fluid distributions and gastrointestinal motility noninvasively.
Standard MRI, now widely available, showed that ingestion of PEG electrolyte solution increased the small bowel water content fourfold.
The size of the colon doubled after dosing and the ascending colon motility index rose markedly, the increase being dose dependent.
Such a challenge was well tolerated and could be a useful way of assessing colonic motility in future studies.
INTRODUCTION
Most current methods of assessing colonic motility are invasive, involving intestinal intubation which is arduous for the patient and require a highly skilled investigator.1 As such they are limited in their use to highly selected patients. While ambulatory manometry using a radio-pill does allow non-invasive measurement of motility, because its transit is uncontrolled it is not possible to reliably assess any particular area of colon or its response to stimulation.2 Furthermore without a standard provocation, colonic motor activity shows marked diurnal variation1,3 and repeated transit measures show poor reproducibility with 27–31% variation,4 suggesting variables like diet and activity alter colonic motility. Magnetic resonance imaging (MRI) can non-invasively monitor gastrointestinal motility and fluid distributions5–12 and may be suitable for assessment of colonic function after an appropriate stimulus.
Oral polyethylene glycol (PEG) formulations have been shown to be effective colonic stimulants at a 4 L dose.13 Smaller volumes (2 L) of PEG-based solutions containing ascorbic acid and electrolyte ions have comparable efficacy and may be better tolerated.14–18 PEG is administered as a hyper-osmotic 402 mOsmol/L non-nutrient solution. When given with the poorly absorbed SO42− ion, it would therefore be expected to generate a net inflow of fluid into the highly permeable upper small intestine.19 As such, the solution would be predicted to pass unabsorbed through the small bowel causing a substantial increase in its fluid content leading to an increased inflow into the colon distending the lumen and thereby stimulating motility. Until recently there was no way of imaging serially and non-invasively gastrointestinal fluid volumes, but recent developments in MRI of gastrointestinal function show that it is now feasible to provide functional information on the gastrointestinal tract with both excellent spatial and temporal characteristics.20 With specific reference to gastrointestinal fluids, MRI has been recently used to investigate fasting and postprandial fluid distribution in health21,22 and disease8 and also to investigate the mode of action of drugs such as loperamide23 and a 5-HT3 antagonist.24
Our hypothesis was that PEG electrolyte would increase small bowel and colonic water content and stimulate colonic motility which would be clearly detectable with MRI imaging.
MATERIALS AND METHODS
Study design
This was an open-label, parallel group design study in healthy volunteers (HVs) using MRI to compare the effects of a split, 2 × 1 L doses (separated by an overnight fast) vs one single 2 L dose of PEG (Macrogol 3550) electrolyte solution (MOVIPREP®; Norgine Pharmaceuticals Ltd, Harefield, UK) given on the morning of the treatment day. This trial was registered on the EU Clinical Trials Register with EudraCT Number 2010-021879-85. There were no changes to the protocol. It was approved by the National Research Ethics Service (approval 10/H0906/50), the NHS Trust R&D (approval 10GA018), and by the Medicines and Healthcare products Regulatory Agency (MHRA Clinical Trial Authorization CTA 03057/0045/001-0001, protocol 10050). All volunteers gave informed written consent before participating and the studies were carried out to Good Clinical Practice standards. Study product supplies and dispensing was organized by the Clinical Trials Pharmacy of Nottingham University Hospitals.
Group 1 received 1 L of PEG electrolyte solution at 1 pm on Day −1 and 1 L at 8 am the next morning on ‘Study day’. On each occasion, they were allowed 1 h to drink the 1 L solution. Group 2 was given a single dose of 2 L PEG electrolyte solution at 8 am on ‘Study day’. They were allowed 2 h to drink the 2 L solution. A range of gastrointestinal MRI parameters and stool characteristics were assessed at baseline and at intervals as shown in Fig.1. This schematic diagram shows the timeline of each stool collection, transit measurement, and MRI scans. It also shows the timing of the split and single dosing. Whole gut transit was assessed by giving the subjects inert MRI marker pills to ingest 24 h before undergoing a MRI transit scan. This was performed at Day −8 and then again at Days 14 and 28. The subjects were asked to provide samples of the first stool of the day at Day −1. The split dose group later on the same Day −1 received the first PEG electrolyte split dose, but the stool was provided before treatment. Subjects underwent MRI scanning at intervals during the study day. They attended again for morning scans at days 1, 3, 14, and 28 after purgation. They provided stool samples at Day −1, on the ‘Study day’, after dosing when the stool had become liquid and at Day 14 and at Day 28. All baseline MRI scans were taken on the study day after an overnight fast and before ingesting the PEG electrolyte. Throughout the study, subjects completed a daily Bristol Stool Diary,25 documenting bowel symptoms, stool frequency, and consistency. The average of values from the stool diary from Day −8 to Day −1 were taken to be ‘Pre-study week average’ values.
Figure 1.
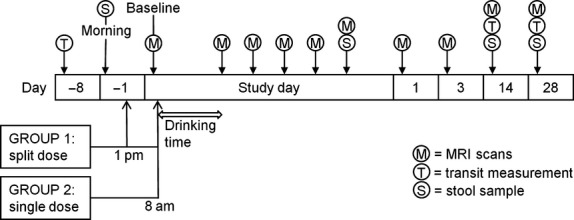
Schematic diagram of the study protocol.
Subjects
Twenty-four HVs were recruited from the general campus population by advertisement. The inclusion criteria were male or female, 18–65 years of age, body mass index (BMI) between 18 and 28 kg/m2. The exclusion criteria were pregnancy, any history of serious acute or chronic illness especially gastrointestinal, use of medication known to affect gastrointestinal transit, such as opiates and constipating drugs, substance abuse, and unsuitability for MRI scanning (such as having any contra-indicated metal implants or pacemakers). Subjects were asked to avoid alcohol for 24 h before the study day. They were divided into two age–sex-matched groups of 12 subjects. At enrollment, they all filled in a Hospital Anxiety and Depression Scale,26 Perceived Stress27 and a Patient Health Questionnaire 15.28 The demographic data are given in Table S1.
Magnetic resonance imaging
The MRI scanning was carried out on a 1.5 T Philips Achieva scanner (Philips Healthcare, Best, The Netherlands). Each volunteer was positioned supine in the scanner with a 4-element, parallel imaging body coil wrapped around the abdomen. After acquiring a scout scan to locate the position of the abdominal organs, a range of MRI scans were taken. A balanced gradient echo (balanced turbo field echo, BTFE) sequence with echo time TE = 1.19 ms and repetition time TR = 2.4 ms was used to assess gastric emptying. This comprised 20 transverse images with an in-plane resolution of 1.56 mm × 1.56 mm and slice thickness of 10 mm, with no gap between slices. A single shot, fast spin echo sequence (similar to that used for MR cholangiopancreatography [MRCP]) with effective TE = 320 ms was used to assess small bowel water content.10 This comprised 24 coronal images with in-plane resolution interpolated to 0.78 mm × 0.78 mm and a slice thickness of 7 mm, with no gap between slices (acquired voxel size = 1.56 × 2.83 × 7 mm3). A dual gradient echo imaging sequence (dual-echo fast field echo, FFE) with TE1 = 2.3 ms, TE2 = 4.6 ms, and TR = 158 ms was used to visualize the anatomy. This comprised 24 coronal plane and 45 transverse images with in-plane resolution 1.76 mm × 1.76 mm and a slice thickness of 7 mm, with no gap between slices. Each image set was acquired on a single expiration breath-hold, the duration of which varied between 13 and 24 s depending on the sequence. Including set-up and imaging the volunteers spent ∼15 min in the scanner for every time point, spending the rest of the time sitting upright in an adjacent room.
Ascending colon motility index
The motility of the ascending colon was assessed from a dynamic ‘cine’ MRI scan. This acquired a single, sagittal slice through the ascending colon every second for 2 min, with the subjects simply resting and breathing gently. The images were then used to measure the ‘motility index score’ which was calculated by dividing the ascending colon into three sections and calculating the sum of the duration of contractions in minutes observed multiplied by the number of sections of the ascending colon that showed motility. Thus, if motility was observed involving the whole ascending colon for 15 s and later involving only one-third of the ascending colon for 20 s, the corresponding motility index would be = (15 × 3) + (20 × 1) = 65 in units of segment × s.
Ascending colon chyme heterogeneity scores
The apparent heterogeneity of the ascending colon chyme was graded by an experienced operator on high resolution images of the ascending colon.23 The grading consisted in assigning a score to the appearance of the chyme based on a predetermined score card. The scores ranged between 1 (all dark) and 5 (all bright) with 3 having a mixture of dark and bright patches. This chyme heterogeneity scoring system, which was developed in-house using a mannitol model of diarrhea, has good inter-observer (weighted kappa 0.82) and intra-observer (weighted kappa 0.84) variability.29
Ascending colon chyme relaxation times T1
The longitudinal relaxation times (T1) of the ascending colon chyme were measured from a single, sagittal slice through the ascending colon using an Inversion Recovery balanced Turbo Field Echo sequence with the following parameters: 1 sagittal slice, TR/TE = 3.0/1.5 ms, field of view = 400 × 400 mm, matrix size 256 × 256, slice thickness = 10 mm, and eight different inversion times (TI) ranging from 100 to 5000 ms. Each image was acquired during a breath-hold with 15 s of free breathing between each different TI to allow for full relaxation of the MRI signal. T1 reflects water proton mobility with cerebrospinal fluid having (at 1.5 T) a T1 of the order of 2400 ms and liver tissue a T1 of the order of 500 ms. The appearance of the chyme was mostly relatively uniform throughout the region but in two of the subjects who took the single dose, the colonic contents appeared to be divided between ‘brighter/wetter’ and ‘darker/drier’ contents, suggesting a wash-in of watery ileal fluid which had not mixed well with the thicker colonic contents. In this case, the relaxation data reported are from the brighter/wetter region.
Abdominal symptoms
On the study day, the subjects were asked to complete 100 mm VAS scales assessing their bowel sensation every time they came out of the MRI scanner. The VASs assessed bloating, distension, pain/discomfort, and nausea/sickness.
Whole gut transit time
The transit scans were carried out at three time points throughout the study: 8 days before dosing (defined as Day −8), 14 days after dosing, and 28 days after dosing. For each of these occasions, the volunteers swallowed three inert MRI transit marker capsules, with as much water as they desired, 24 h before the scan and under the supervision of one of the study investigators. The inert polyoxymethylene (POM) capsules (prescription pill shaped, 2.5 cm long with 1.0 cm diameter) were filled with water, traces of Gadolinium contrast agent (0.2 mL of 15 μM Gd), and perfluorooctyl bromide (PFOB, 0.6 mL) so that they would be visible both on T1-weighted 1H proton MRI scans and on 19F fluorine MRI scans. The dual-label transit marker pills were developed and tested under separate Ethics approval G/05/2010. On the transit measurement day, the volunteers attended the study center having fasted overnight and a transit scan was performed. A series of proton (1H) and fluorine (19F) images were acquired on a 3T Philips Achieva scanner (Philips Healthcare) equipped with a multinuclear channel and an abdominal fluorine MRI coil (PulseTeq, Chobham, Surrey, UK) to localize the position of the capsules in the gut. On the Days 14 and 28 of the protocol, the transit measurements were performed first on the 3 T scanner and immediately after that, all the other abdominal scans were performed on the 1.5 T scanner. The transit was assessed by scoring the position of the capsules according to previous gamma scintigraphy methods with score 1 = in the small bowel, 2 = lower ascending colon, 3 = upper ascending colon, 4 = right transverse colon, 5 = left transverse colon, 6 = descending colon, 7 = recto-sigmoid, and score 8 = expelled from the rectum. The mean position was calculated to give a single final score. A recent study using improved, smaller capsules showed that this measure is moderately reproducible with a correlation between measures repeated 1 week apart being 0.69,30 though there are outliers who show up to 25 h differences in transit between assessments as other have also found,31 variability which may in part reflect genuine changes in transit with diet and other factors rather than error in measurement. The method correlates well with the standard radio-opaque marker technique of Metcalf, r = 0.85.32
Stool pH
The subjects were asked to provide samples of the first stool of the day at Day −1 and at Day 14 and Day 28. They were also asked to provide a sample on the main study day, after treatment when the stool had become liquid. A small amount of the stool sample was placed in a laboratory tube containing 3 mL distilled water with pH = 7. The mixture was then shaken to break up the stool using a bench vortex mixer (Fisher Scientific, Loughborough, UK) at a medium speed, for around 10–15 s, or until there were no visible solid pieces. The sample's pH was then determined as an average of two repeated measurement made using pH indicator strips (Fisher Scientific).
Image analysis
Measurements of the volume of the gastric contents were carried out on the axial images by manually tracing a region of interest around the meal within the stomach on each image slice using Analyze6 software (Biomedical Imaging Resource, Mayo Foundation, Rochester, MN, USA) and summing across the slices to determine the total volume at the different time points. The surrounding organs and gastrointestinal gas were easily discriminated and excluded from the region of interest.
The small bowel water content images were analyzed as previously described.10 Briefly, regions of interest were drawn manually around the small bowel on each of the MRCP images excluding regions such as the stomach, gall bladder, and blood vessels using in-house software on an IDL platform (IDL, Exelis Visual Information Solutions, Boulder, CO, USA). The software then calculated the number of voxels (a 3-dimensional dataset) in each of the regions of interest with an intensity above a threshold calibrated using the corresponding subject's cerebrospinal fluid.10
Colonic volumes were measured by drawing manually on each relevant slice of the coronal dual-echo fast field echo images on Analyze9 software (Biomedical Imaging Resource, Mayo Foundation). Separate regions of interest were drawn on the ascending, transverse, and descending colon as described previously and then summed across each dataset, yielding also the total colonic volume as the sum of the three regions.33
Power and statistical analysis
The primary endpoint was the small bowel water content with colonic water content, motility, and associated symptoms as secondary endpoints. Previous work using mannitol and glucose8 showed that the small bowel water content was 47 mL (SD 15 mL) at 40 min postprandially after ingesting 300 mL glucose solution. We calculated that we could detect an increase of 20 mL in excess of this (which is very much less than that observed after the mannitol challenge) with 90% power using n = 12 subjects.
The data are presented as mean ± SEM. Normality of the data was tested using Shapiro–Wilk's test. The data were log transformed to achieve normal distribution after which two-way repeated measures anova was used. Normal distribution of the data was not achieved even after log transform for the ascending colon motility index, chyme heterogeneity scores, and T1, or for the abdominal symptoms on the MRI day. The temporal averages for the two treatments on the study day were compared by calculating the AUC from end of treatment to 4 h (AUC4h) using the trapezoidal method. Comparisons between groups were performed using two tailed unpaired t-test or Mann–Whitney's U-test, respectively. Correlations were assessed using Pearson's or Spearman's test, respectively. Statistical analysis was carried out using GraphPad Prism 5 (GraphPad Software Inc, La Jolla, CA, USA). Differences were considered significant when p < 0.05.
RESULTS
The two treatment groups were well matched for age, gender, BMI, and psychological assessments (Table S1). The study procedures were generally well-tolerated with only one withdrawal from Group 1.
The MRI images showed clearly that as hypothesized the ingestion of the PEG electrolyte solution caused a rapid total increase in small bowel and colonic water content (Fig.2).
Figure 2.
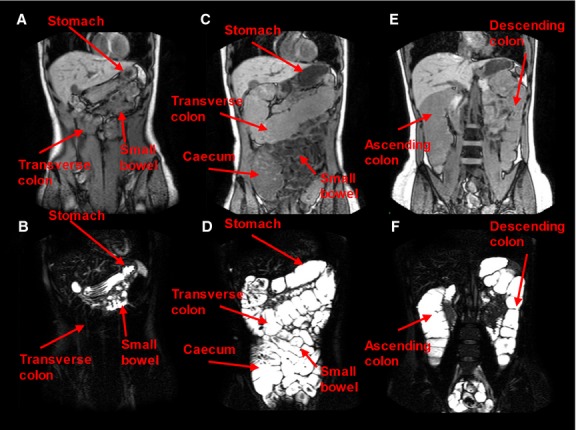
Representative anatomical images (upper panel) and bowel water images (lower panel) for a subject that drank a single 2 L PEG electrolyte dose. (A) and (B) were acquired at fasting baseline before dosing. In (B), a small amount of fluid can be seen in the small bowel, the transverse colon appears very dark, and the stomach shows the presence of limited resting fluid. The other images (C–F) were taken immediately after the subject completed the 2 L PEG electrolyte dose (2 h after starting the drink). (D) It shows the small bowel full of bright fluid and a marked distension of the cecum and transverse colon, both full of bright fluid. (F) is from a more posterior image plane and shows the marked distension of the ascending and descending colon, also both full of bright fluid.
Small bowel water content
There was a significant effect of treatment on small bowel water content (p = 0.0127, Table S2). Upon dosing, the small bowel water content (shown in Fig.3) significantly increased fourfold from the fasting baseline value for both the split dose (p = 0.0010) and for the single dose (p = 0.0005). Peak small bowel water content volumes ranged between 233 to 792 mL with no difference between treatments (p < 0.8). Small bowel water volumes returned to baseline values the following day.
Figure 3.
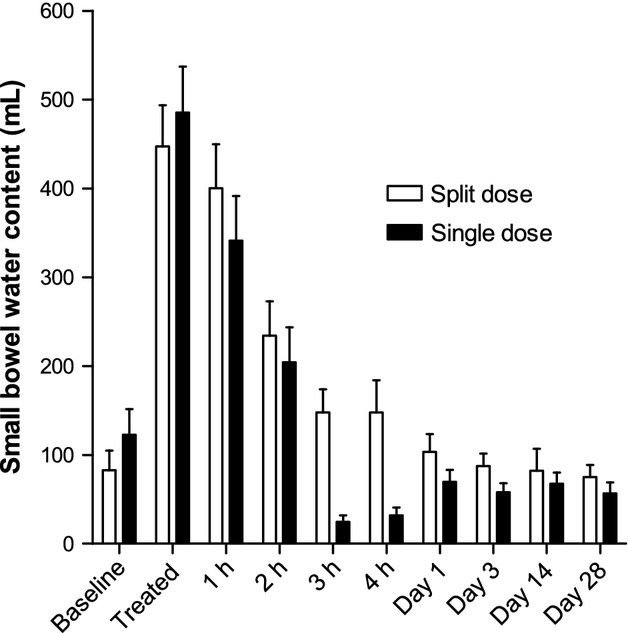
Small bowel water content (SBWC) for the group of 11 healthy volunteers who took the split 2 × 1 L dose of PEG electrolyte and the separate group of 12 healthy volunteers who took the single 2 L dose of PEG electrolyte. Values are mean volume (mL) ±SEM.
Colon volumes
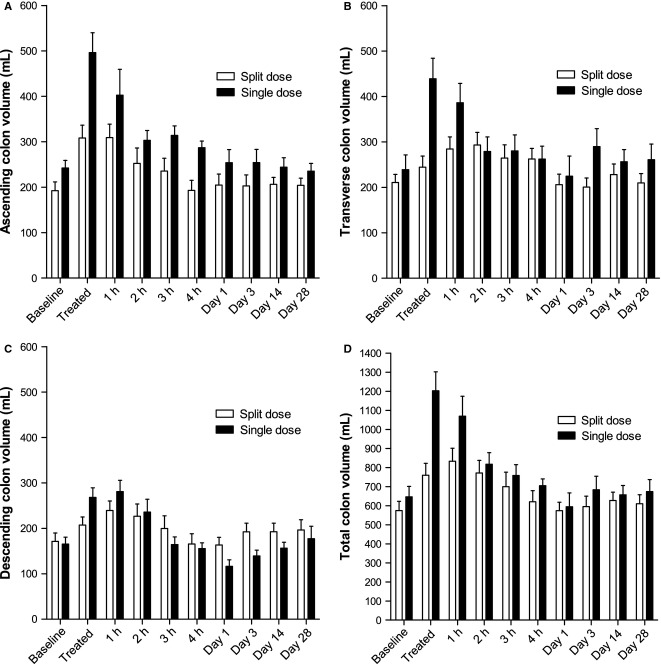
Colonic volumes increased markedly upon dosing (Fig.4). As expected after treatment, the increase in total colonic volumes from baseline values was smaller for the 1 L split dose at 35 ± 8% (range 0–81%) than for the single 2 L dose at 102 ± 27% (range 9–289%) p = 0.0332. The largest changes were found in the ascending and transverse colon with little change in the descending colon, although most subjects defecated during the study showing the solution had passed through the descending colon. The ascending colon volumes were significantly greater with the 2 L dose, p = 0.0099 (Table S2). The volumes gradually returned to baseline values toward the end of the study day.
Figure 4.
Regional anatomical volumes of the (A) ascending, (B) transverse, and (C) descending colon for the group of 11 healthy volunteers who took the split 2 × 1 L dose of PEG electrolyte and the separate group of 12 healthy volunteers who took the single 2 L dose of PEG electrolyte. (D) The corresponding total colonic volume. Values are mean volume (mL) ±SEM.
Ascending colon motility index
The baseline ascending colon motility index (Fig.5) was close to zero for most subjects. Both dosing regimens induced marked increases in ascending colon motility in all subjects. After treatment, the motility index was twofold higher for the single 2 L dose compared with the 1 L split dose group (p = 0.0103). The scores were numerically higher for the single dose throughout the study day though the difference in AUC4h was not statistically significant (Table S3). The peak change from baseline values in ascending colonic motility index correlated positively and significantly with change from baseline values in ascending colon volume, Spearman's r = 0.53, p = 0.0128 (Fig.6). Removing the outlier at 800 mL change in ascending colon volume from baseline does not change the Spearman's correlation r = 0.53, p = 0.0161. Two ascending colon motility MRI movies are shown in Supporting Information (Movie S1 and S2).
Figure 5.
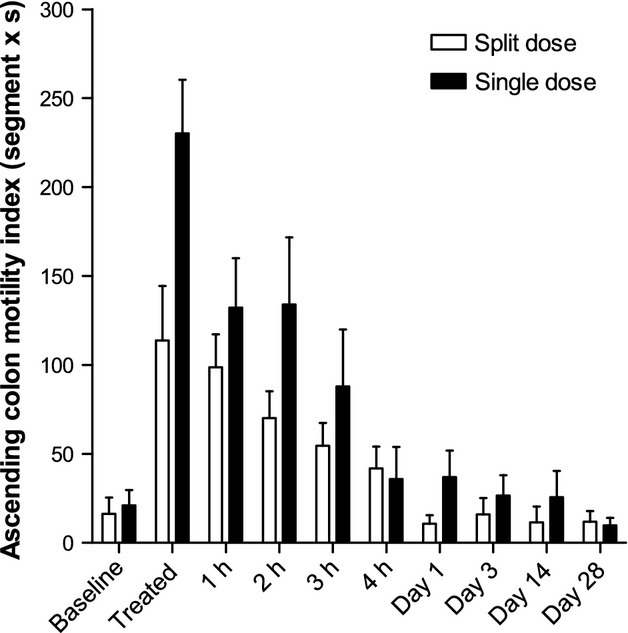
Ascending colon motility index for the group of 11 healthy volunteers who took the split 2 × 1 L dose of PEG electrolyte and the separate group of 12 healthy volunteers who took the single 2 L dose of PEG electrolyte. Values are mean Motility Index (segment × second) ±SEM.
Figure 6.
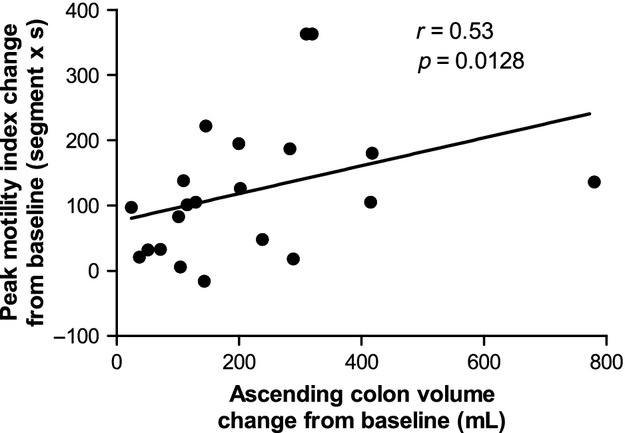
Correlation between peak change from baseline ascending colon motility index (values are in segment × second) and change from baseline ascending colon volume (values are in mL). Data are from both groups of healthy volunteers who took the split 2 × 1 L dose or the single 2 L dose of PEG electrolyte.
Ascending colon chyme heterogeneity scores
The baseline ascending colon chyme heterogeneity scores (shown in Fig.7A) for the split dose 2.6 ± 0.2 were significantly higher than those for the baseline of the single dose group 1.8 ± 0.2 (p = 0.0198; Fig.7B). On the study day the scores doubled after dosing compared to baseline for both the split dose (p = 0.0003) and the single dose (p < 0.0001), they remained sustained throughout the study day and returned to baseline the following day.
Figure 7.
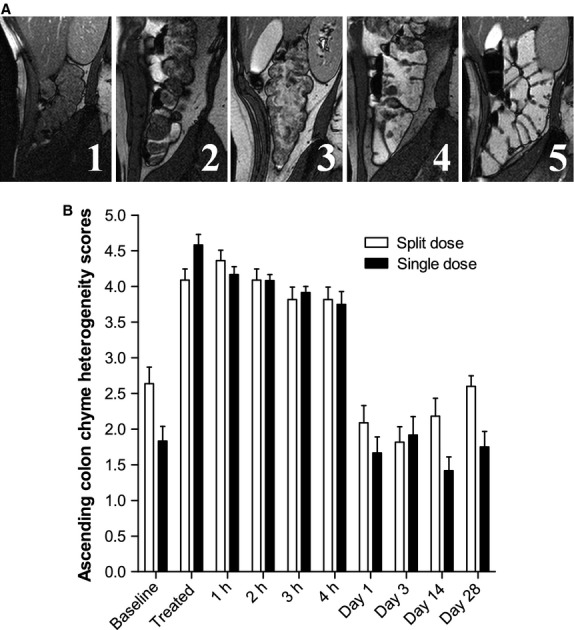
Heterogeneity scores of the appearance of the ascending colon chyme on high resolution sagittal MRI images. (A) The scoring card with scores ranging from 1 (all dark materials) to 5 (all bright fluid) and 3 having a mixture of dark and bright regions. (B) Heterogeneity scores for the group of 11 healthy volunteers who took the split 2 × 1 L dose of PEG electrolyte and the separate group of 12 healthy volunteers who took the single 2 L dose of PEG electrolyte. Values are the operator's heterogeneity scores ±SEM.
Ascending colon chyme relaxation times T1
The baseline value of ascending colon chyme T1 for the split dose was significantly higher than of the single dose group, p = 0.0496 (Fig.8). The T1 significantly increased fourfold from baseline values upon dosing for both the split dose (p < 0.0004) and the single dose (p < 0.0005). The split dose T1 values remained higher than for the single dose throughout the study day, but the difference was not significant (Table S3). The T1 values returned to baseline values the following day.
Figure 8.
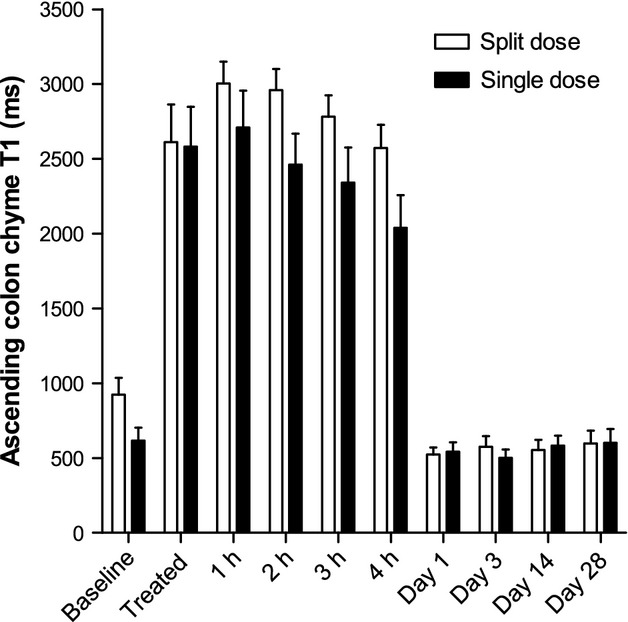
Ascending colon chyme longitudinal relaxation time T1 for the group of 11 healthy volunteers who took the split 2 × 1 L dose of PEG electrolyte and the separate group of 12 healthy volunteers who took the single 2 L dose of PEG electrolyte. Values are mean relaxation time T1 (in seconds) ±SEM.
Gastric volumes
At the first imaging point taken immediately after the period allowed for drinking the volume of liquid remaining in the stomach was comparable between groups (524 ± 80 mL for the split dose group vs 449 ± 63 mL for the single dose group, p = 0.4665), despite the difference in volumes consumed.
Abdominal symptoms
Abdominal symptoms on the study day were mild in this healthy population. Symptoms rose immediately upon dosing and declined during the study day returning to baseline values (Figure S1). The split dose had consistently lower AUC4h values than the single dose, but there were no significant differences in symptoms between the two dosing regimens (Table S3).
Correlations of MRI bowel parameters with abdominal symptoms
There was a relatively weak but significant correlation between the peak change from baseline feeling of bloating and the change from baseline small bowel water content (Spearman's r = 0.47, p = 0.0231, Figure S2A), but the correlation with change from baseline total colon volume was not significant (Spearman r = 0.11, p = 0.6345, Figure S2B). Similarly, peak change from baseline feeling of distension correlated with change from baseline small bowel water content. This correlation was again relatively weak but significant (Pearson's r = 0.44, p = 0.0371, Figure S2C). The correlation with change from baseline total colonic volume was not significant (Spearman's r = 0.31, p = 0.1675, Figure S2D).
Whole gut transit time
The mean position score of the MRI marker pills was not different between the groups allocated to split dose or single dose at Day −8 (6.2 ± 0.4 vs 5.4 ± 0.6, p = 0.2527), at Day 14 (5.8 ± 0.4 vs 5.5 ± 0.5, p = 0.6076), or at Day 28 (6.1 ± 0.5 vs 6.6 ± 0.3 respectively, p = 0.3327). Pooling the data from both treatment together shows no difference in whole gut transit between Days −8 and 14 after treatment (p = 0.7750) or Day 28 after treatment (p = 0.2350).
Stool frequency, consistency, and pH
The frequency of bowel movements (Figure S3A) increased sevenfold from baseline on the treatment study day for both the split dose (p < 0.0001) and the single dose (p = 0.0025) with no difference between treatments (p = 0.7075). Stool frequency returned to baseline values the following day.
Stool consistency scores (Figure S3B) doubled on the treatment study day to virtually liquid stool for both the split dose (p = 0.0089) and the single dose (p = 0.0005). The consistency scores on the study day were marginally but significantly higher for the single dose treatment (p = 0.0236). Stool consistency scores reduced but remained elevated (i.e., softer) compared to baseline (average for Days −8 to Day −1) on Day 1 and Day 3 though the differences from baseline were not significant (p = 0.4–1). Stool consistency scores returned to baseline at Day 14.
Stool pH increased significantly from baseline 7.0 ± 0.1 to pH 7.9 ± 0.1 after dosing for both the split dose (p < 0.0003) and the single dose (p < 0.0002). There was no difference between treatments (p < 0.7). The stool pH returned to baseline values at Days 14 and 28.
DISCUSSION
Ingestion of the low-dose PEG electrolyte solution either as a single dose or a split dose caused a rapid increase in small bowel and colonic fluid content, and a marked increase in colon volumes and motility. Gastric emptying of this non-nutrient meal was rapid and driven by gastric distension. However, the fluid volumes in the small bowel were similar in the first postprandial scan for both the 1 and 2 L dose suggesting that it was maximally distended by the 1 L so that increased input with the 2 L dose led to more rapid evacuation into the colon. The right colon, in keeping with its major role as a region where fermentation of unabsorbed carbohydrate takes place prior to absorption, is better able to accommodate the increased input which is reflected in the increase in ascending colon volume. However, as others have shown34 rapid input overwhelms the absorptive capacity, distending the ascending colon leading to greater motor response with increasing inflow. The vigorous contractions, which could be clearly seen on cine imaging, explain why the transverse colon volume was also increased as fluid was propelled distally. These two proximal regions of the colon appeared able to accommodate the increased load at least for the first 2 h. Thereafter, many subjects defecated which prevented the total colon volume increasing beyond an average of 1.2 L. It is worth noting that, in keeping with the descending colon's largely propulsive rather than accommodative function, its volume did not increase, although the chyme passed through this region as shown by the fact that most subjects defecated within 1–2 h of PEG ingestion. The sensation of bloating, distension, discomfort, and nausea all peaked immediately after ingestion and then declined being close to baseline within 2 h suggesting a mainly upper gut origin. Our finding that bloating correlated better with small bowel, but not colon volumes with a steeper rise in symptoms for any given rise in volume supports idea that the right colon is better able to adapt to increased volume than the small bowel.
These were HVs and the effect on patients with functional gastrointestinal disease and associated visceral hypersensitivity remains to be investigated but we do know that in IBS-D there appears to be less postprandial accommodation of the ascending colon33 which may account for the associated faster colonic transit. Preliminary studies in constipated individuals show that some show impaired motility response and enhanced symptoms with PEG electrolyte challenge and this is subject of ongoing research. Previous scintigraphic studies have also suggested that rapid clearance of the ascending colon correlates with increased stool weight and faster overall transit in IBS-D.35 The stimulation of colonic motility was greater for the 2 L single dose in keeping with the greater distension induced, but the effect on small bowel motility was not assessed.
Both dosing regimens increased ascending colon chyme heterogeneity scores, T1 relaxation times, and had a marked effect on stool pH postpurging. An increase in T1 relaxation times measured posttreatment, with values approaching the T1 of free water, reflects the dilution of colonic contents.
The alkalinization of stool we found is a feature of other diarrheal conditions and reflects loss of the short chain fatty acids produced by the colonic microbiota allowing the normally alkaline ileal contents to pass unaltered through the impermeable colon.
Many studies of bowel cleansing prior to colonoscopy have shown the effectiveness of 2 L of PEG-based solutions with ascorbic acid.14–18 There is also some evidence that taking the smaller volume in two split 1 L doses may be advantageous giving better bowel cleansing but similar tolerability.36 The lesser distension of the ascending and transverse colon was associated with numerically lower symptom scores, but this difference was not significant in our HVs, probably because they evacuated fluid rapidly per rectum, preventing excessive colonic distension with the higher dose.
In conclusion, this imaging study has shown for the first time the changes in intestinal fluid after oral PEG electrolyte bowel preparation. PEG electrolyte caused a rapid fluid volume increase in the small bowel and in the right side of the colon, stimulating colonic motility and propulsion of the PEG electrolyte through the colon. The technique is well-tolerated and pilot data suggest that this colonic stimulation can provide a patient acceptable way to distinguish different degrees of colonic responsiveness which are likely to characterize disorder of colonic function like constipation and diarrhea.
Acknowledgments
The authors thank the Nottingham Digestive Diseases Biomedical Research Unit for help. The views expressed are those of the authors and not necessarily those of the NHS, the NIHR, or the Department of Health. They also thank Dr Marc Halphen, Norgine Pharmaceuticals Ltd, for his support.
FUNDING
This study was supported by an Investigator Initiated Study research grant from Norgine Pharmaceuticals Limited. Norgine had no role in study design, data collection and analysis, and the authors had complete access to all the data.
CONFLICTS OF INTEREST
Professor Spiller has received research funding from Lesaffre and Ironwood and free drug for clinical trial from Norgine. He has also acted on Advisory Boards for Almirall, Astellas, Danone and Sanofi. The other authors have no competing interests.
AUTHOR CONTRIBUTION
RCS conceived the study. LM, KCG, CLH, JJT, VMdV, PAG, and RCS contributed to study design. CC operated the MRI scanner. LM, KCG, AF, and IF acquired the data. CLH designed the MRI sequences and developed the image analysis software. LM, KCG, CLH, SEP, EP, KM, GC, and CL analyzed the data. LM, KCG, AF, IF, CL, VMdV, PAG, and RCS interpreted the data. LM and KCG drafted the manuscript. All authors revised the manuscript and gave their approval of the final version.
Supporting Information
Additional supporting information may be found in the online version of this article at the publisher's web site:
Abdominal symptoms on the study day: bloating, distension, pain/discomfort, and nausea/sickness.
Figure S2. Correlation between peak change from baseline of the symptoms of bloating and distension vs the change from baseline in small bowel water content and total colon volume.
Figure S3. Stool diaries for frequency and consistency.
Table S1. Study population demographic data.
Table S2. Two-way repeated measures anova for primary and secondary outcomes.
Table S3. Area under the curve (AUC) for primary and secondary outcomes.
Ascending colon motility MRI movie.
Ascending colon mass movement MRI movie.
References
- 1.Dinning PG, Zarate N, Szczesniak MM, Mohammed SD, Preston SL, Fairclough PD, Lunniss PJ, Cook IJ, et al. Bowel preparation affects the amplitude and spatiotemporal organization of colonic propagating sequences. Neurogastroenterol Motil. 2010;22:633–e176. doi: 10.1111/j.1365-2982.2010.01480.x. [DOI] [PubMed] [Google Scholar]
- 2.Camilleri M, Thorne NK, Ringel Y, Hasler WL, Kuo B, Esfandyari T, Gupta A, Scott SM, et al. Wireless pH-motility capsule for colonic transit: prospective comparison with radiopaque markers in chronic constipation. Neurogastroenterol Motil. 2010;22:874–e233. doi: 10.1111/j.1365-2982.2010.01517.x. [DOI] [PMC free article] [PubMed] [Google Scholar]
- 3.Rao SSC, Sadeghi P, Beaty J, Kavlock R. Ambulatory 24-hour colonic manometry in slow-transit constipation. Am J Gastroenterol. 2004;99:2405–16. doi: 10.1111/j.1572-0241.2004.40453.x. [DOI] [PubMed] [Google Scholar]
- 4.Deiteren A, Camilleri M, Bharucha AE, Burton D, McKinzie S, Rao AS, Zinsmeister AR. Performance characteristics of scintigraphic colon transit measurement in health and irritable bowel syndrome and relationship to bowel functions. Neurogastroenterol Motil. 2010;22:413–e95. doi: 10.1111/j.1365-2982.2009.01441.x. [DOI] [PMC free article] [PubMed] [Google Scholar]
- 5.Schiller C, Frohlich CP, Giessmann T, Siegmund W, Monnikes H, Hosten N, Weitschies W. Intestinal fluid volumes and transit of dosage forms as assessed by magnetic resonance imaging. Aliment Pharmacol Ther. 2005;22:971–9. doi: 10.1111/j.1365-2036.2005.02683.x. [DOI] [PubMed] [Google Scholar]
- 6.Schwizer W, Fraser R, Borovicka J, Asal K, Crelier G, Kunz P, Boesiger P, Fried M. Measurement of proximal and distal gastric motility with magnetic resonance imaging. Am J Physiol. 1996;271:G217–22. doi: 10.1152/ajpgi.1996.271.1.G217. [DOI] [PubMed] [Google Scholar]
- 7.Schwizer W, Fraser R, Borovicka J, Crelier G, Boesiger P, Fried M. Measurement of gastric emptying and gastric motility by magnetic resonance imaging (MRI) Dig Dis Sci. 1994;39:S101–3. doi: 10.1007/BF02300384. [DOI] [PubMed] [Google Scholar]
- 8.Marciani L, Cox EF, Hoad CL, Pritchard S, Totman JJ, Foley S, Mistry A, Evans S, et al. Postprandial changes in small bowel water content in healthy subjects and patients with irritable bowel syndrome. Gastroenterology. 2010;138:469–77. doi: 10.1053/j.gastro.2009.10.055. [DOI] [PubMed] [Google Scholar]
- 9.Marciani L, Young P, Wright J, Moore R, Coleman N, Gowland PA, Spiller RC. Antral motility measurements by magnetic resonance imaging. Neurogastroenterol Motil. 2001;13:511–8. doi: 10.1046/j.1365-2982.2001.00285.x. [DOI] [PubMed] [Google Scholar]
- 10.Hoad CL, Marciani L, Foley S, Totman JJ, Wright J, Bush D, Cox EF, Campbell E, et al. Non-invasive quantification of small bowel water content by MRI: a validation study. Phys Med Biol. 2007;52:6909–22. doi: 10.1088/0031-9155/52/23/009. [DOI] [PubMed] [Google Scholar]
- 11.Ajaj W, Lauenstein T, Papanikolaou N, Holtmann G, Goehde SC, Ruehm SG, Debatin JF. Real-time high-resolution MRI for the assessment of gastric motility: pre- and postpharmacological stimuli. J Magn Reson Imaging. 2004;19:453–8. doi: 10.1002/jmri.20029. [DOI] [PubMed] [Google Scholar]
- 12.Froehlich JM, Patak MA, von Weymarn C, Juli CF, Zollikofer CL, Wentz KU. Small bowel motility assessment with magnetic resonance imaging. J Magn Reson Imaging. 2005;21:370–5. doi: 10.1002/jmri.20284. [DOI] [PubMed] [Google Scholar]
- 13.Ell C, Fischbach W, Keller R, Dehe M, Mayer G, Schneider B, Albrecht U, Schuette W, et al. A randomized, blinded, prospective trial to compare the safety and efficacy of three bowel-cleansing solutions for colonoscopy (HSG-01*) Endoscopy. 2003;35:300–4. doi: 10.1055/s-2003-38150. [DOI] [PubMed] [Google Scholar]
- 14.Bitoun A, Ponchon T, Barthet M, Coffin B, Dugue C, Halphen M, Grp N. Results of a prospective randomised multicentre controlled trial comparing a new 2-L ascorbic acid plus polyethylene glycol and electrolyte solution vs. sodium phosphate solution in patients undergoing elective colonoscopy. Aliment Pharmacol Ther. 2006;24:1631–42. doi: 10.1111/j.1365-2036.2006.03167.x. [DOI] [PubMed] [Google Scholar]
- 15.Kelly NM, Rodgers C, Patterson N, Jacob SG, Mainie I. A prospective audit of the efficacy, safety, and acceptability of low-volume polyethylene glycol (2 L) versus standard volume polyethylene glycol (4 L) versus magnesium citrate plus stimulant laxative as bowel preparation for colonoscopy. J Clin Gastroenterol. 2012;46:595–601. doi: 10.1097/MCG.0b013e3182432162. [DOI] [PubMed] [Google Scholar]
- 16.Corporaal S, Kleibeuker JH, Koornstra JJ. Low-volume PEG plus ascorbic acid versus high-volume PEG as bowel preparation for colonoscopy. Scand J Gastroenterol. 2010;45:1380–6. doi: 10.3109/00365521003734158. [DOI] [PubMed] [Google Scholar]
- 17.Worthington J, Thyssen M, Chapman G, Chapman R, Geraint M. A randomised controlled trial of a new 2 litre polyethylene glycol solution versus sodium picosulphate plus magnesium citrate solution for bowel cleansing prior to colonoscopy. Curr Med Res Opin. 2008;24:481–8. doi: 10.1185/030079908x260844. [DOI] [PubMed] [Google Scholar]
- 18.Jansen SV, Goedhard JG, Winkens B, van Deursen CTBM. Preparation before colonoscopy: a randomized controlled trial comparing different regimes. Eur J Gastroenterol Hepatol. 2011;23:897–902. doi: 10.1097/MEG.0b013e32834a3444. [DOI] [PubMed] [Google Scholar]
- 19.Spiller RC, Jones BJM, Silk DBA. Jejunal water and electrolyte absorption from two proprietary enteral feeds in man: importance of sodium content. Gut. 1987;28:681–7. doi: 10.1136/gut.28.6.681. [DOI] [PMC free article] [PubMed] [Google Scholar]
- 20.Marciani L. Assessment of gastrointestinal motor functions by MRI: a comprehensive review. Neurogastroenterol Motil. 2011;23:399–407. doi: 10.1111/j.1365-2982.2011.01670.x. [DOI] [PubMed] [Google Scholar]
- 21.Marciani L, Pritchard SE, Hellier-Woods C, Costigan C, Hoad CL, Gowland PA, Spiller RC. Delayed gastric emptying and reduced postprandial small bowel water content of equicaloric whole meal bread versus rice meals in healthy subjects: novel MRI insights. Eur J Clin Nutr. 2013;67:754–8. doi: 10.1038/ejcn.2013.78. [DOI] [PMC free article] [PubMed] [Google Scholar]
- 22.Marciani L, Hall N, Pritchard SE, Cox EF, Totman JJ, Lad M, Hoad CL, Foster TJ, et al. Preventing gastric sieving by blending a solid/water meal enhances satiation in healthy humans. J Nutr. 2012;142:1253–8. doi: 10.3945/jn.112.159830. [DOI] [PubMed] [Google Scholar]
- 23.Placidi E, Marciani L, Hoad CL, Napolitano A, Garsed KC, Pritchard SE, Cox EF, Costigan C, et al. The effects of loperamide, or loperamide plus simethicone, on the distribution of gut water as assessed by MRI in a mannitol model of secretory diarrhoea. Aliment Pharmacol Ther. 2012;36:64–73. doi: 10.1111/j.1365-2036.2012.05127.x. [DOI] [PubMed] [Google Scholar]
- 24.Marciani L, Wright J, Foley S, Hoad CL, Totman JJ, Bush D, Hartley C, Armstrong A, et al. Effects of a 5-HT3 antagonist, ondansetron, on fasting and postprandial small bowel water content assessed by magnetic resonance imaging. Aliment Pharmacol Ther. 2010;32:655–63. doi: 10.1111/j.1365-2036.2010.04395.x. [DOI] [PubMed] [Google Scholar]
- 25.Heaton KW, Odonnell LJD. An office guide to whole gut transit - time patients recollection of their stool form. J Clin Gastroenterol. 1994;19:28–30. doi: 10.1097/00004836-199407000-00008. [DOI] [PubMed] [Google Scholar]
- 26.Zigmond AS, Snaith RP. The hospital anxiety and depression scale. Acta Psychiatr Scand. 1983;67:361–70. doi: 10.1111/j.1600-0447.1983.tb09716.x. [DOI] [PubMed] [Google Scholar]
- 27.Levenstein S, Prantera C, Varvo V, Scribano ML, Berto E, Luzi C, Andreoli A. Development of the Perceived Stress Questionnaire: a new tool for psychosomatic research. J Psychosom Res. 1993;37:19–32. doi: 10.1016/0022-3999(93)90120-5. [DOI] [PubMed] [Google Scholar]
- 28.Kroenke K. Physical symptom disorder: a simpler diagnostic category for somatization-spectrum conditions. J Psychosom Res. 2006;60:335–9. doi: 10.1016/j.jpsychores.2006.01.022. [DOI] [PubMed] [Google Scholar]
- 29.Placidi E, Hoad CL, Marciani L, Gowland PA, Spiller RC. Effects of an osmotic laxative on the distribution of water between the small and large intestine in humans. Gut. 2010;59:A141-A. [Google Scholar]
- 30.Chaddock G, Lam C, Hoad CL, Costigan C, Cox EF, Placidi E, Thexton I, Wright J, et al. Novel MRI tests of orocecal transit time and whole gut transit time: studies in normal subjects. Neurogastroenterol Motil. 2014;26:205–14. doi: 10.1111/nmo.12249. [DOI] [PMC free article] [PubMed] [Google Scholar]
- 31.Degen LP, Phillips SF. Variability of gastrointestinal transit in healthy women and men. Gut. 1996;39:299–305. doi: 10.1136/gut.39.2.299. [DOI] [PMC free article] [PubMed] [Google Scholar]
- 32.Metcalf AM, Phillips SF, Zinsmeister AR, Maccarty RL, Beart RW, Wolff BG. Simplified assessment of segmental colonic transit. Gastroenterology. 1987;92:40–7. doi: 10.1016/0016-5085(87)90837-7. [DOI] [PubMed] [Google Scholar]
- 33.Pritchard SE, Marciani L, Garsed KC, Hoad CL, Thongborisute W, Roberts E, Gowland PA, Spiller RC. Fasting and postprandial volumes of the undisturbed colon: normal values and changes in diarrhea-predominant irritable bowel syndrome measured using serial MRI. Neurogastroenterol Motil. 2014;26:124–30. doi: 10.1111/nmo.12243. [DOI] [PMC free article] [PubMed] [Google Scholar]
- 34.Debongnie JC, Phillips SF. Capacity of human colon to absorb fluid. Gastroenterology. 1978;74:698–703. [PubMed] [Google Scholar]
- 35.Vassallo M, Camilleri M, Phillips SF, Brown ML, Chapman NJ, Thomforde GM. Transit through the proximal colon influences stool weight in the irritable bowel syndrome. Gastroenterology. 1992;102:102–8. doi: 10.1016/0016-5085(92)91789-7. [DOI] [PubMed] [Google Scholar]
- 36.Marmo R, Rotondano G, Riccio G, Marone A, Bianco MA, Stroppa I, Caruso A, Pandolfo N, et al. Effective bowel cleansing before colonoscopy: a randomized study of split-dosage versus non-split dosage regimens of high-volume versus low-volume polyethylene glycol solutions. Gastrointest Endosc. 2010;72:313–20. doi: 10.1016/j.gie.2010.02.048. [DOI] [PubMed] [Google Scholar]
Associated Data
This section collects any data citations, data availability statements, or supplementary materials included in this article.
Supplementary Materials
Abdominal symptoms on the study day: bloating, distension, pain/discomfort, and nausea/sickness.
Figure S2. Correlation between peak change from baseline of the symptoms of bloating and distension vs the change from baseline in small bowel water content and total colon volume.
Figure S3. Stool diaries for frequency and consistency.
Table S1. Study population demographic data.
Table S2. Two-way repeated measures anova for primary and secondary outcomes.
Table S3. Area under the curve (AUC) for primary and secondary outcomes.
Ascending colon motility MRI movie.
Ascending colon mass movement MRI movie.


