

Short abstract
Central artery stiffness has emerged over the past 15 years as a clinically significant indicator of cardiovascular function and initiator of disease. Loss of elastic fiber integrity is one of the primary contributors to increased arterial stiffening in aging, hypertension, and related conditions. Elastic fibers consist of an elastin core and multiple glycoproteins; hence defects in any of these constituents can adversely affect arterial wall mechanics. In this paper, we focus on mechanical consequences of the loss of fibulin-5, an elastin-associated glycoprotein involved in elastogenesis. Specifically, we compared the biaxial mechanical properties of five central arteries—the ascending thoracic aorta, descending thoracic aorta, suprarenal abdominal aorta, infrarenal abdominal aorta, and common carotid artery—from male and female wild-type and fibulin-5 deficient mice. Results revealed that, independent of sex, all five regions in the fibulin-5 deficient mice manifested a marked increase in structural stiffness but also a marked decrease in elastic energy storage and typically an increase in energy dissipation, with all differences being most dramatic in the ascending and abdominal aortas. Given that the primary function of large arteries is to store elastic energy during systole and to use this energy during diastole to work on the blood, fibulin-5 deficiency results in a widespread diminishment of central artery function that can have significant effects on hemodynamics and cardiac function.
Keywords: aorta, carotid, biaxial stiffness, stress, energy dissipation, regional variations
1. Introduction
The elastin-associated glycoprotein fibulin-5 is essential for effective elastogenesis, particularly via the cross-linking of tropoelastin [1]. Whereas deficiencies in the elastin-associated glycoproteins fibrillin-1 and fibulin-4 lead to aortic aneurysms and dissections [2,3], the primary gross vascular phenotype exhibited by mice deficient in fibulin-5 is elongated and tortuous central arteries [4]. Associated microstructural consequences of fibulin-5 deficiency include disorganized and disrupted elastic laminae, particularly in the outer media of the central arteries [5,6]. Consistent with this observation, it was originally suggested that the reported increase in central pulse pressure resulted from arterial stiffening, which was subsequently confirmed for common carotid arteries both qualitatively [7] and quantitatively [8,9].
Stiffening of central arteries, particularly the aorta and common carotids, is recognized as an indicator and initiator of cardiovascular disease [10,11]. Amongst other reasons, a stiffer artery propagates the pressure wave faster, which results in an earlier return of reflected waves that augments central pulse pressure [12,13]. An increased central pulse pressure increases the afterload on the heart and decreases coronary perfusion pressure, both of which compromise left ventricular function [14]. The gold standard clinical measure of increased arterial stiffness is the carotid-femoral pulse wave velocity (cf-PWV), which depends primarily on stiffening of the DTA and abdominal aorta. Yet, noting that arterial stiffening is a natural consequence of aging [15,16], it appears that the ascending aorta may be the first central artery to manifest aging-related elongation and stiffening [17–19]. There is strong motivation, therefore, to quantify possible regional differences in the stiffening of central arteries. Moreover, defects in, damage to, or degradation of elastic fibers play fundamental roles in central arterial stiffening [20–22], hence there is strong motivation to study the role of fibulin-5 in central artery stiffness. Of course, rigorous quantification of arterial mechanics necessitates using consistent methods of biaxial testing and data analysis that focus on near physiologic conditions [23,24].
This paper addresses these multiple needs by comparing, for the first time, the passive biaxial mechanical properties of five central arteries from male and female wild-type (Fbln5+/+) and fibulin-5 deficient (Fbln5 −/−) mice: the ascending thoracic aorta (ATA), proximal descending thoracic aorta (DTA), suprarenal abdominal aorta (SAA), infrarenal abdominal aorta (IAA), and common carotid artery (CCA). Results are presented in terms of multiple mechanical metrics, including best-fit values of model parameters for a nonlinear anisotropic constitutive relation for wall stress, values of linearized stiffness computed at physiological loads, and the energy stored and dissipated during in vitro cyclic loading.
2. Methods
2.1. Animal Protocols.
All animal procedures were approved by the Institutional Animal Care and Use Committee of Yale University. Homozygous Fbln5+/+ and Fbln5−/− mice were obtained by breeding heterozygous Fbln5+/− pairs on a mixed C57BL/6 × 129/SvEv background. The animals were divided into four experimental groups to investigate effects of genotype and sex: Fbln5+/+ males (+/+ M), Fbln5+/+ females (+/+ F), Fbln5−/− males (−/− M), and Fbln5−/− females (−/− F). Conscious blood pressures were measured noninvasively, at 20–22 weeks of age, using a CODA tail-cuff system (Kent Scientific Corporation, Torrington, CT) following standard methods [25]. Animals were then euthanized via an overdose of Beuthanasia-D (150 mg/kg, intraperitoneal injection). Upon verification of death, we harvested for mechanical testing the ATA (from the aortic root to the brachiocephalic artery), DTA (from the left subclavian artery to the third pair of intercostal branches), SAA (from the final pair of intercostal branches to the right renal artery), IAA (from the left renal artery to the iliac bifurcation), and CCA (from the aorta to the carotid bifurcation).
2.2. Biomechanical Phenotyping.
Excised segments were gently cleaned of excess perivascular tissue and all side branches were ligated using one of the three strands of a braided 7-0 nylon suture. Specimens were cannulated on custom glass pipettes sized to the specific caliber and secured by tying 6-0 silk sutures around the anatomical landmarks defining the segment to be tested. For example, the ATA was cannulated proximally just past the aortic valve and distally at the base of the brachiocephalic trunk, with the left carotid and left subclavian arteries and the distal portion of the aortic arch ligated to allow pressurization. All specimens were placed within a custom computer-controlled biaxial testing system [26], equilibrated at 37 °C for 15–30 min in a Hank's buffered physiologic solution, and preconditioned using 4 cycles of pressurization from 10 to 140 mmHg at the estimated in vivo axial stretch. Next, we performed cyclic pressure–diameter (P–d) tests at three fixed axial lengths (in vivo and ∼5% above and below in vivo) and cyclic axial force–length (f–l) tests at four fixed pressures (10, 60, 100, and 140 mmHg). The maximum allowed axial load in each f–l protocol varied with arterial region and was determined via pilot studies: 4.5 g (44.13 mN) for the ATA, 3.0 g (29.42 mN) for the DTA, 2.5 g (24.52 mN) for the SAA and IAA, and 1.0 g (9.81 mN) for the CCA. Further details on experimental methods and data reduction are in Ref. [27], which demonstrate the importance of evaluating mechanical properties via biaxial tests. We used a sample size of n = 5 for each of the five locations and four experimental groups (i.e., 100 vessels).
The arteries were modeled as thin-walled cylindrical tubes, thus allowing calculation of in-plane stresses via equilibrium alone [27,28]. We then used a microstructurally motivated, four-fiber family constitutive model of the passive behavior to fit the pressure, diameter, axial force, and axial stretch data collected during the seven mechanical testing protocols (three P–d and four f–l). This constitutive model is defined by a strain energy function W of the form [27–32]
| (1) |
where c, , and are material parameters. is the right Cauchy–Green tensor, F the deformation gradient tensor, and a unit vector denoting the orientation of the ith family of locally parallel fibers, with angle computed relative to the axial (z) direction in a reference configuration. One family of fibers is oriented axially (), one circumferentially (), and two symmetric diagonally (). This collection of fibers reflects measured orientations of collagen fibers and passive smooth muscle cells [31] while capturing phenomenologically the possible effects of lateral cross-links. Regardless
| (2) |
for , with by incompressibility [33]. The passive Cauchy stresses are
| (3) |
where p is a Lagrange multiplier that enforces isochoric motions; it was calculated herein by assuming that the radial stress was small in comparison to the in-plane components.
Best-fit values of the eight model parameters (i.e., seven material parameters and one fiber angle) were determined from data sets combined from the seven biaxial testing protocols (with N the total number of equilibrium configurations) using a nonlinear least squares minimization of the error e, where
| (4) |
with P and f the distending pressure and total axial force, respectively, and th and exp denoting theoretically determined and experimentally inferred values, respectively; an overbar represents an average over all data points N included in the regression [8]. A nonparametric bootstrap previously revealed that reliable fixed-point estimates are obtained via this approach for the four fiber family model [34]. Regression analysis was performed in matlab R2013b using the built-in function lsqnonlin and assigning random initial guesses and appropriate physical constraints on the parameters [34]. A minimum of six minimization cycles per specimen ensured that best-fit parameters were independent of initial guesses. We focused on data obtained during unloading, which yields information on the stored energy that would be available to do work on the blood during elastic recoil (i.e., energy not dissipated during cyclic loading), which thereby captured an important function of a large artery.
The most relevant values of material stiffness are those at in vivo deformations. Hence, linearized stiffness was calculated via [35]
| (5) |
where is the deformation gradient associated with mappings from an appropriate reference to a finitely deformed in vivo configuration, and C o are associated components of the right Cauchy–Green tensor. Such a configuration is determined by fixing the axial stretch at its in vivo value (obtained as the cross-over point within the f–l data collected at 60, 100, and 140 mmHg) and prescribing a physiologically relevant pressure. A Newton–Raphson algorithm allowed an estimation of the geometry (loaded outer diameter and wall thickness) and circumferential stretch ratio associated with the in vivo values of axial stretch and distending pressure [28], which allowed calculation of the in vivo stored energy (Eq. (1)), biaxial stress (Eq. (3)), and biaxial stiffness (Eq. (5)).
Motivated by Ref. [36], the percent energy dissipation was calculated from the difference between the loading and unloading curves normalized by the energy associated with loading. Briefly, energies associated with loading (W L) and unloading (W U) were calculated as
| (6) |
where and are the nonzero components of the second Piola–Kirchhoff stress tensor , and and are components of the Green strain tensor . The two terms in Eq. (6) represent the sum of the energies stored circumferentially over the three P–d tests and axially over the four f–l tests. Note that the axial stress does not contribute to energy storage during P–d testing due to the fixed axial stretches, while the contribution of the circumferential stress in f–l testing at fixed pressures was small. The limits of integration were and evaluated at 10 and 140 mmHg, respectively, and and evaluated at f = 0 mN and f max, respectively. Integrations of the experimental data were accomplished using the trapezoidal rule. The resulting parameter, the energy dissipation ratio (EDR), was defined as
| (7) |
and represents the energy dissipated primarily due to viscoelastic effects.
We analyzed biaxial data from the 100 individual experiments (5 samples × 5 locations × 4 groups) using the above methods, as well as from 20 average data sets (5 locations × 4 groups averaged over n = 5 samples each), since we have previously shown the utility of average biaxial data in summarizing biomechanical behaviors within homogeneous groups [27].
2.3. Quantitative Histology.
Samples were fixed overnight in 4% formalin while unloaded, then stored in 70% ethanol at 4 °C until embedding in paraffin and sectioning at 5 μm. Sections were stained with Verhoeff van Gieson (VVG) to identify elastic fibers, Masson's trichrome (MTC) to identify fibrillar collagen and smooth muscle cell cytoplasm, or Movat's pentachrome (MOV) to identify glycosaminoglycans and proteoglycans (GAGs/PGs). Sections were imaged using an Olympus BX/51 microscope with a 40 × objective (400 × total magnification). Complete cross sectional views of the arterial wall were obtained by stitching individual images acquired via an Olympus DP70 digital camera and software (cellsens dimension). The resulting images were analyzed using a custom matlab script to identify area fractions of each load-bearing constituent using methods described elsewhere [32]. Briefly, image analysis first consisted of global thresholding to saturate the background to a uniform white value (R = 255, G = 255, and B = 255) and to eliminate variations in background illumination. Pixel-specific thresholding then distinguished constituents of interest based on their characteristic colors. Such pixel extraction was performed in the HSL (hue–saturation–lightness) color space, thus isolating pixels recognized as elastin (black: H = 0 deg–360 deg, S = 0.0–1.0, and L = 0.0–0.24) from VVG images, collagen (blue: H = 150 deg–260 deg, S = 0.1–1.0, and L = 0.10–0.93) and cytoplasm (red: H = 275 deg–10 deg, S = 0.1–1.0, and L = 0.10–0.93) from MTC images, and GAGs/PGs (blue–green: H = 120 deg–240 deg, S = 0.09–1.0, and L = 0.10–0.80) from MOV images. See the on-line version for colors. Area fractions for elastin (), collagen (), and smooth muscle () were computed as the ratios of positively identified constituent-specific pixels to the total number of pixels in the cross section. Area fractions for GAGs/PGs () were calculated as the ratios of positively identified pixels from the intima and media to the total number of pixels of the cross section. The intimal and medial layers contain primarily chondroitin sulfate PGs, a family of large PGs that aggregate with hyaluronan [37] and affect the viscoelastic behavior of the arterial wall. The smaller dermatan sulfate PGs are present in all arterial layers and associate closely with collagen fibrils. It has been shown, however, that the progressive increase in collagen fibril diameter from the intima to adventitia correlates with a decrease in overall GAGs/PGs content [38]. We thus considered the adventitial GAGs/PGs to be negligible.
Finally, we computed a parameter that reflected the shape of the internal elastic lamina (IEL). Applying the elastin-specific thresholding of VVG-stained cross sections, we extracted binary images of the elastic laminae. The contour of the luminal edge of the IEL was traced and subdivided into circular sectors with a central angle of 5 deg. We then computed the path length () and linear distance between the ends () for each of the 72 sectors of the IEL. Motivated by Ref. [39], we estimated overall IEL waviness via the global parameter
| (8) |
which can assume values between 0 and 1. Lower values indicate an overall straighter IEL and hence less undulated elastic laminae.
2.4. Statistical Analysis.
Experimental data are presented as mean ± SEM. A two-way analysis of variance (ANOVA) was used to assess differences in age, body mass, and blood pressure due to genotype and sex. Multivariate ANOVA was used to determine roles of genotype, region, and sex amongst the mean geometrical, mechanical, and microstructural variables. Post-hoc pairwise comparisons were performed using the Bonferroni correction, and p < 0.05 was considered significant. All analyses were performed using the open source statistical software R [40].
3. Results
3.1. General Observations.
All mice were ∼21 weeks old at the time of testing and the only significant difference in body mass was between Fbln5+/+ male (31.9 ± 1.8 g) and female (22.7 ± 0.8 g) animals; for completeness, the body mass of Fbln5−/− males was 30.5 ± 1.4 g and that of Fbln5−/− females was 27.5 ± 1.3 g. Blood pressures and heart rates were similar across genotype and sex under resting conditions (Table 1). Figure 1 (first column) shows representative video captures of specimens from each of the five regions while axially stretched and pressurized at near in vivo conditions. Table 2 lists basic geometric and mechanical metrics for all 20 groups: both genotypes (Fbln5+/+ and Fbln5−/−) and sexes (M and F) and all five regions (ATA, DTA, SAA, IAA, and CCA). The pressure-dependent biomechanical variables were calculated at the systolic configuration which, due to the similarity in blood pressures, facilitated comparisons amongst groups. Differences in these tabulated values due to genotype, region, and sex are discussed in detail below.
Table 1.
Blood pressure and heart rate for the four primary groups of mice: male (M), female (F), wild-type (Fbln5+/+), and fibulin-5 deficient (Fbln5−/−)
|
Fbln5 +/+ |
Fbln5 −/− |
|||
|---|---|---|---|---|
| M | F | M | F | |
| n | 10 | 10 | 10 | 10 |
| Blood pressure (mmHg) | ||||
| Systolic | 119.7 ± 6.0 | 120.9 ± 3.7 | 120.7 ± 6.7 | 122.7 ± 4.9 |
| Mean | 95.8 ± 5.6 | 97.2 ± 3.4 | 96.6 ± 6.9 | 97.5 ± 4.9 |
| Pulse | 35.7 ± 1.4 | 35.1 ± 1.6 | 35.5 ± 2.3 | 37.4 ± 2.5 |
| Heart rate (bpm) | 692 ± 19 | 615 ± 38 | 613 ± 38 | 658 ± 42 |
Fig. 1.
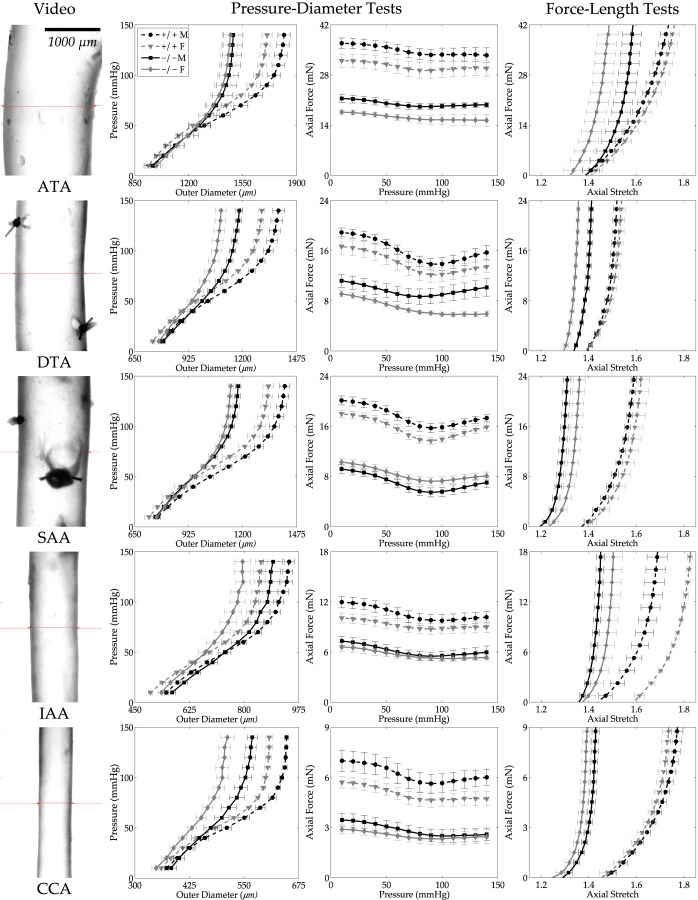
Pressure–diameter (P–d) and axial force–length (f–l) data (mean ± SEM) for all 20 groups (cf. Table 2): ATA, DTA, SAA, IAA, and CCA from male (M, black lines), female (F, gray lines), Fbln5+/+ (+/+, dashed lines), and Fbln5−/− (−/−, solid lines) mice. Each curve is the average of n = 5 experimental data sets. The first column shows video images of the central region of representative specimens under in vivo loads to highlight the different sizes. The second column shows P–d responses during inflation tests at the individual preferred values of axial stretch; note the different scales for the abscissas but the similar behaviors. The third column shows f–P responses during inflation tests, with force not changing much with pressurization as expected at the preferred value of axial stretch. Finally, the fourth column shows axial f–l responses during extension tests at 100 mmHg. Note the different scales for the ordinates in both the third and fourth columns, with overall lower forces exhibited by smaller arteries as expected.
Table 2.
Morphological and mechanical data (mean ± SEM) for central arteries from male (M) and female (F) mice: wild-type (Fbln5+/+) and fibulin-5 deficient (Fbln5−/−). All pressure-dependent values are computed at group systolic pressures measured via tail-cuff (Table 1). See text for vessel abbreviations ATA, DTA, SAA, IAA, and CCA.
|
M |
F |
|||||||||
|---|---|---|---|---|---|---|---|---|---|---|
| Fbln5 +/+ | ATA | DTA | SAA | IAA | CCA | ATA | DTA | SAA | IAA | CCA |
| n (number) | 5 | 5 | 5 | 5 | 5 | 5 | 5 | 5 | 5 | 5 |
| Unloaded dimensions | ||||||||||
| Outer diameter (μm) | 1090 ± 22 | 827 ± 17 | 832 ± 9 | 588 ± 9 | 409 ± 11 | 1024 ± 17 a | 771 ± 16 a | 781 ± 27 | 543 ± 15 a | 380 ± 5 a |
| Wall thickness (μm) | 105 ± 1 | 105 ± 3 | 92 ± 4 | 91 ± 3 | 84 ± 4 | 106 ± 5 | 107 ± 6 | 94 ± 2 | 82 ± 4 | 81 ± 3 |
| In vitro axial length (mm) | 3.4 ± 0.1 | 5.8 ± 0.2 | 5.7 ± 0.2 | 5.2 ± 0.4 | 5.2 ± 0.2 | 2.8 ± 0.2 a | 5.9 ± 0.1 | 5.0 ± 0.5 | 5.6 ± 0.2 | 4.9 ± 0.3 |
| Systolic dimensions | ||||||||||
| Outer diameter (μm) | 1783 ± 38 | 1357 ± 28 | 1386 ± 25 | 929 ± 16 | 642 ± 3 | 1674 ± 31 | 1284 ± 15 a | 1308 ± 28 | 841 ± 18 a | 603 ± 7 a |
| Wall thickness (μm) | 35 ± 0.5 | 38 ± 0.4 | 32 ± 1 | 30 ± 2 | 26 ± 1 | 35 ± 2 | 37 ± 2 | 32 ± 2 | 26 ± 1 a | 25 ± 1 |
| In vivo axial stretch | 1.71 ± 0.02 | 1.50 ± 0.01 | 1.56 ± 0.01 | 1.66 ± 0.04 | 1.73 ± 0.03 | 1.72 ± 0.03 | 1.52 ± 0.02 | 1.59 ± 0.04 | 1.78 ± 0.01 a | 1.70 ± 0.02 |
| Systolic Cauchy stresses (kPa) | ||||||||||
| Circumferential | 395.9 ± 6.0 | 268.1 ± 8.4 | 330.1 ± 14.8 | 230.4 ± 16.0 | 186.7 ± 12.1 | 381.0 ± 27.1 | 262.3 ± 11.3 | 314.3 ± 9.9 | 245.4 ± 8.4 | 181.8 ± 10.8 |
| Axial | 377.7 ± 4.6 | 251.2 ± 8.7 | 299.3 ± 16.9 | 275.1 ± 13.9 | 228.7 ± 21.1 | 362.3 ± 26.5 | 244.0 ± 6.7 | 288.0 ± 18.2 | 337.2 ± 19.5 | 233.7 ± 14.4 |
| Systolic stiffness (MPa) | ||||||||||
| Circumferential | 2.57 ± 0.10 | 1.81 ± 0.09 | 2.30 ± 0.07 | 1.86 ± 0.15 | 1.87 ± 0.22 | 2.41 ± 0.27 | 1.69 ± 0.09 | 2.16 ± 0.08 | 1.93 ± 0.11 | 1.75 ± 0.18 |
| Axial | 2.53 ± 0.05 | 4.21 ± 0.50 | 3.35 ± 0.19 | 4.08 ± 0.22 | 3.94 ± 0.83 | 2.50 ± 0.21 | 3.95 ± 0.18 | 3.31 ± 0.19 | 4.65 ± 0.16 | 3.42 ± 0.23 |
| Systolic stored energy (kPa) | 108.7 ± 1.8 | 64.4 ± 2.6 | 84.0 ± 4.1 | 61.2 ± 5.4 | 54.3 ± 4.0 | 105.1 ± 7.8 | 63.3 ± 2.5 | 81.3 ± 5.7 | 64.7 ± 2.2 | 50.0 ± 4.1 |
| Energy dissipation ratio (%) | 1.89 ± 0.56 | 3.90 ± 1.04 | 3.84 ± 0.36 | 5.84 ± 0.85 | 4.54 ± 0.71 | 2.78 ± 0.71 | 2.91 ± 0.50 | 4.31 ± 0.47 | 9.08 ± 1.16 | 7.00 ± 0.89 |
|
M |
F |
|||||||||
|---|---|---|---|---|---|---|---|---|---|---|
| Fbln5−/− | ATA | DTA | SAA | IAA | CCA | ATA | DTA | SAA | IAA | CCA |
| n (number) | 5 | 5 | 5 | 5 | 5 | 5 | 5 | 5 | 5 | 5 |
| Unloaded dimensions | ||||||||||
| Outer diameter (μm) | 1026 ± 56 | 830 ± 22 | 794 ± 9 b | 629 ± 14 b | 417 ± 13 | 1026 ± 34 | 784 ± 25 | 794 ± 12 | 590 ± 13 b | 376 ± 8 a |
| Wall thickness (μm) | 119 ± 7 | 116 ± 3 b | 91 ± 2 | 100 ± 6 | 72 ± 4 | 128 ± 12 | 116 ± 6 | 88 ± 2 | 94 ± 5 | 69 ± 7 |
| In vitro axial length (mm) | 4.2 ± 0.3 b | 5.9 ± 0.7 | 7.7 ± 0.1 b | 5.6 ± 0.3 | 5.4 ± 0.3 | 3.6 ± 0.2 b | 6.2 ± 0.2 | 6.7 ± 0.3 a b | 6.2 ± 0.5 | 5.5 ± 0.3 |
| Systolic dimensions | ||||||||||
| Outer diameter (μm) | 1475 ± 63 b | 1167 ± 14 b | 1159 ± 15 b | 878 ± 30 | 559 ± 11 b | 1454 ± 53 b | 1080 ± 25 a b | 1129 ± 14 b | 787 ± 23 a | 506 ± 14 a b |
| Wall thickness (μm) | 49 ± 2 b | 54 ± 2 b | 45 ± l b | 44 ± l b | 34 ± 2 b | 57 ± 3 b | 56 ± 3 b | 43 ± 2 b | 43 ± 3 b | 33 ± 3 b |
| In vivo axial stretch | 1.54 ± 0.04 b | 1.39 ± 0.01 b | 1.27 ± 0.02 b | 1.42 ± 0.02 b | 1.40 ± 0.02 b | 1.43 ± 0.04 b | 1.34 ± 0.01 a b | 1.33 ± 0.02 b | 1.47 ± 0.04 b | 1.36 ± 0.02 b |
| Systolic Cauchy stresses (kPa) | ||||||||||
| Circumferential | 229.2 ± 13.5 b | 159.8 ± 5 b | 189.9 ± 5.2 b | 143.7 ± 7 b | 120.3 ± 10.9 b | 193.9 ± 6.1 a b | 142.6 ± 10.4 b | 197.9 ± 9.3 b | 135.7 ± 8.2 b | 112.7 ± 9.5 b |
| Axial | 206.9 ± 12.l b | 152.5 ± 11.6 b | 146.0 ± 6.3 b | 176.1 ± 9 b | 149.6 ± 17.2 b | 171.0 ± 8.9 a b | 122.3 ± 16.4 b | 167.6 ± 7 b | 180.4 ± 11.9 b | 145.8 ± 28.9 b |
| Systolic stiffness (MPa) | ||||||||||
| Circumferential | 2.74 ± 0.41 | 1.52 ± 0.07 b | 1.85 ± 0.15 b | 1.33 ± 0.05 b | 1.24 ± 0.20 | 2.15 ± 0.10 | 1.48 ± 0.09 | 2.07 ± 0.13 | 1.29 ± 0.11 b | 1.07 ± 0.09 b |
| Axial | 2.55 ± 0.31 | 3.37 ± 0.53 | 2.63 ± 0.2 b | 4.11 ± 0.42 | 3.59 ± 0.42 | 2.12 ± 0.18 | 2.96 ± 0.56 | 3.12 ± 0.19 | 4.14 ± 0.41 | 3.82 ± 0.57 |
| Systolic stored energy (kPa) | 43.0 ± 1.9 b | 27.3 ± 1.8 b | 33.0 ± 1.5 b | 28.6 ± 1.5 b | 23.9 ± 2.2 b | 32.6 ± 1.7 a b | 22.5 ± 2.4 b | 34.2 ± 2.4 b | 27.5 ± 2.3 b | 20.8 ± 2.8 b |
| Energy dissipation ratio (%) | 7.06 ± 0.86 b | 6.94 ± 1.55 | 5.49 ± 0.51 b | 10.88 ± 0.81 b | 7.48 ± 1.27 | 5.04 ± 0.54 b | 6.42 ± 1.61 | 5.45 ± 0.51 | 6.87 ± 2.21 | 3.24 ± 2.82 |
p < 0.05 between M and F of the same genotype and location.
p < 0.05 between Fbln5 +/+ and Fbln5 − / − of the same sex and location.
3.2. Effect of Genotype.
Fibulin-5 deficiency was the major determinant of the observed differences in biomechanical behavior. Figure 1 (second column) compares average pressure–diameter behaviors at individual in vivo axial stretches and reveals that the Fbln5−/− arteries were consistently less distensible than the Fbln5+/+ counterparts. Data from Table 2 indicate that systolic outer diameters were significantly smaller in Fbln5−/− arteries compared with Fbln5+/+ in all regions except the IAA, which was the only region to exhibit significantly larger unloaded diameters in Fbln5−/− males and females. Conversely, the SAA had smaller unloaded diameters in Fbln5−/− males only. Figure 1 also shows average axial force–pressure behaviors (third column); note that the axial force required to maintain the energetically preferred axial stretch during pressurization was consistently lower in Fbln5−/− than Fbln5+/+ arteries. Axial force–axial stretch responses at 100 mmHg (Fig. 1, fourth column) further revealed a marked loss of extensibility in all Fbln5−/− arteries, consistent with the significantly lower values of in vivo axial stretch in all five regions (Table 2). Such reductions in axial extension within the ATA and SAA may have been related to an axial growth, as reflected by the significantly higher unloaded axial lengths in the male and female Fbln5−/− mice. This observation is consistent with the tortuosity phenotype reported previously [4].
Figure 2 shows calculated mean Cauchy stress–stretch responses (based on best-fit material parameters obtained from average data sets) to pressurization at the individual in vivo axial stretch for all 20 groups. Circumferential and axial Cauchy stresses were consistently lower at systolic pressure in Fbln5−/− arteries regardless of sex (Table 2 and Fig. 2). These values also reflect, of course, differences in geometry (Table 2) since mean wall stresses were computed as , where P is the pressure, a is the loaded inner radius, and h is the loaded wall thickness, and , where f is the total axial load (i.e., , with the transducer-measured force). Structural stiffness depends upon both material stiffness and geometry, all of which are listed in Table 2 for the systolic configuration. Values of material stiffness linearized about the in vivo state (Eq. (5)) are also superimposed graphically on the nonlinear stress–stretch curves in Fig. 2 and compared in Fig. 3; they were either the same or lower in Fbln5−/− mice. Systolic wall thickness was higher in each Fbln5−/− vessel, however, which was a key contributor to the increased structural stiffness in these vessels (Fig. 1).
Fig. 2.
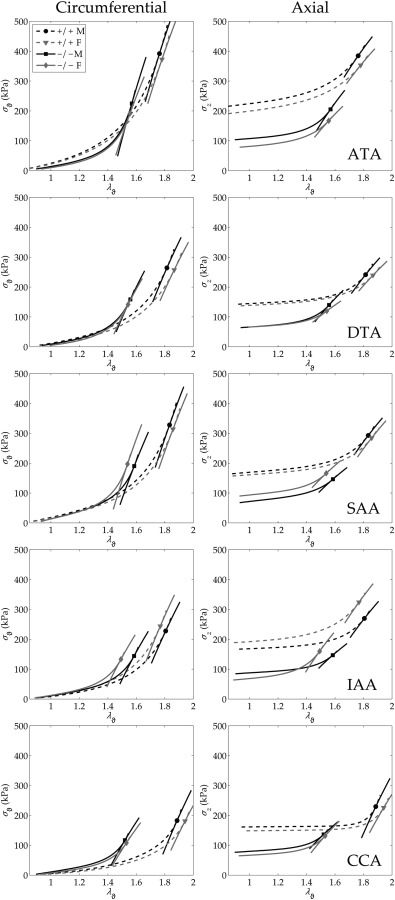
Average Cauchy stress–stretch responses calculated for all 20 groups (based on parameters in Table 3) by simulating P–d tests at the individual in vivo axial stretches (cf. Fig. 1). All data plotted using the same scale to facilitate visual comparisons. Notice the regionally consistent leftward shift in circumferential behavior and downward shift in axial behavior for Fbln5−/− (−/−, solid lines) mice relative to Fbln5+/+ (+/+, dashed lines). Results for stress (in kPa) and linearized stiffness (in MPa; see Table 2), the latter of which can be visualized by local tangents based on calculations via Eq. (5), were remarkably similar between males (M—black lines) and females (F—gray lines) in all tested regions.
Fig. 3.
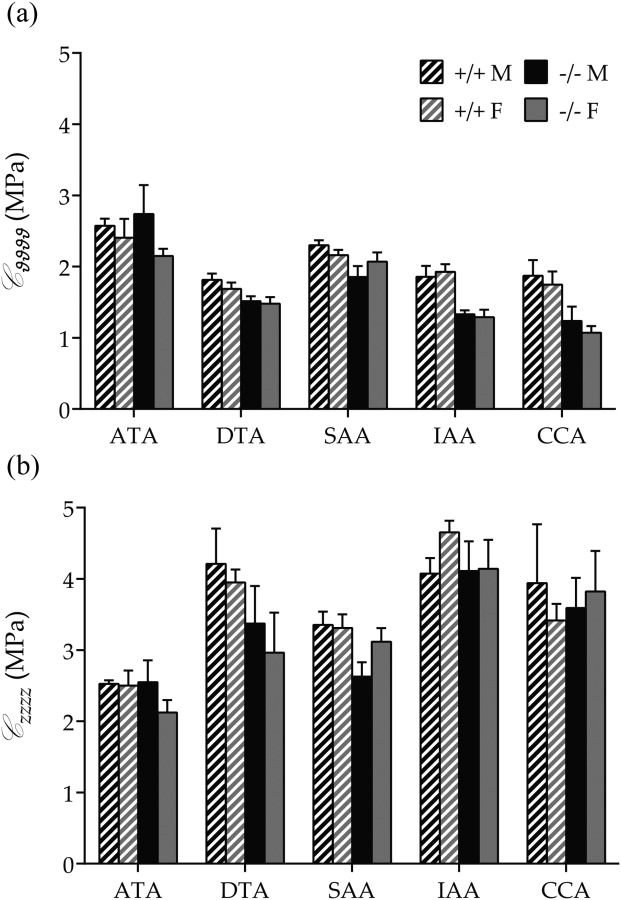
Average biaxial stiffness (mean ± SEM) in male (M, black bars), female (F, gray bars), Fbln5+/+ (+/+, shaded bars), and Fbln5−/− (−/−, solid bars) mice. (a) Circumferential stiffness of Fbln5−/− arteries was equal to or lower than wild-types. (b) Axial stiffness was similar between genotypes, independent of sex. Numerical values and significant differences with p < 0.05 are reported in Table 2.
Table 3 lists best-fit values of the eight model parameters for the four-fiber family model (Eq. (1)) for all 20 average data sets. Although not shown, the fit to the P–d, f–l data was consistently good, similar to that in Fig. 3 in Ref. [27]. The most relevant differences in the parameter values were that the neo-Hookean parameter c was larger for Fbln5+/+ ATAs and DTAs but smaller for SAAs, IAAs, and CCAs relative to Fbln5−/− arteries. Additionally, was consistently greater for Fbln5+/+ arteries, while was consistently larger for Fbln5−/− arteries. Because it is difficult to interpret consequences of differences in eight parameters in a highly nonlinear model, Fig. 4 shows iso-energy contours for all 20 groups based on the averaged data. These plots reveal clearly that all Fbln5−/− arteries had reduced distensibility (i.e., range of circumferential stretch) and extensibility (range of axial stretch). The values of W denoted by solid circles represent systolic values (cf. Fig. 5(a)), hence these symbols also reveal the in vivo values of circumferential and axial stretch, both of which were significantly lower in all Fbln5−/− arteries. Because the primary function of large arteries is to store energy during systole and to use that energy to work on the blood during diastole, such energy plots may represent the best overall means to visually assess differences in central arterial function. Finally, Fig. 5(b) compares values of in vivo axial stretch; note the marked reductions for Fbln5−/− relative to Fbln5+/+ in all five regions, independent of sex.
Table 3.
Best-fit values of material parameters in the four-fiber family model for central arteries from male (M) and female (F) mice: wild-type (Fbln5+/+) and fibulin-5 deficient (Fbln5−/−)
| Elastic fibers |
Axial collagen |
Circumferential collagen + SMC |
Symmetric diagonal collagen |
Error | ||||||
|---|---|---|---|---|---|---|---|---|---|---|
| Fbln5 +/ + | c (kPa) | c1 1 (kPa) | c 2 1 | c 1 2 (kPa) | c 2 2 | c 1 3,4 (kPa) | c2 3,4 | α0 (deg) | RMSE | |
| M | ATA | 26.159 | 16.653 | 0.080 | 14.881 | 0.081 | 4.729 | 0.433 | 44.055 | 0.079 |
| DTA | 20.377 | 15.952 | 0.536 | 12.218 | 0.112 | 0.045 | 2.796 | 26.545 | 0.073 | |
| SAA | 29.056 | 22.659 | 0.119 | 10.194 | 0.136 | 0.420 | 1.350 | 31.233 | 0.058 | |
| IAA | 12.634 | 16.888 | 0.162 | 10.748 | 0.124 | 0.035 | 1.682 | 29.394 | 0.077 | |
| CCA | 8.073 | 17.084 | 0.069 | 8.854 | 0.056 | 1.97 × 10⁻⁵ | 2.643 | 35.089 | 0.085 | |
| F | ATA | 23.329 | 16.799 | 0.037 | 15.138 | 0.102 | 4.189 | 0.435 | 39.887 | 0.081 |
| DTA | 14.864 | 20.622 | 0.314 | 11.941 | 0.086 | 0.097 | 2.289 | 24.710 | 0.077 | |
| SAA | 24.630 | 22.894 | 0.060 | 10.145 | 0.118 | 0.313 | 1.324 | 30.143 | 0.073 | |
| IAA | 13.388 | 6.844 | 0.227 | 10.946 | 0.144 | 0.264 | 0.856 | 34.263 | 0.114 | |
| CCA | 6.056 | 18.348 | 0.084 | 7.402 | 0.052 | 0.001 | 1.981 | 33.365 | 0.098 | |
| Elastic fibers |
Axial collagen |
Circumferential collagen + SMC |
Symmetric diagonal collagen |
Error | ||||||
|---|---|---|---|---|---|---|---|---|---|---|
| Fbln5 − / − | c (kPa) | c1 1 (kPa) | c 1 2 | c 1 2 (kPa) | c 2 2 | c 1 3,4 (kPa) | c2 3,4 | a0 (deg) | RMSE | |
| M | ATA | 21.031 | 6.911 | 0.527 | 7.467 | 0.662 | 0.823 | 1.721 | 38.903 | 0.074 |
| DTA | 17.440 | 1.472 | 3.165 | 9.702 | 0.497 | 0.203 | 4.416 | 28.760 | 0.077 | |
| SAA | 32.817 | 8.272 | 3.625 | 4.675 | 0.712 | 0.978 | 5.562 | 26.111 | 0.071 | |
| IAA | 21.252 | 2.084 | 2.352 | 6.321 | 0.543 | 0.004 | 6.654 | 22.982 | 0.091 | |
| CCA | 21.233 | 2.171 | 2.581 | 4.551 | 0.833 | 0.015 | 6.505 | 26.282 | 0.079 | |
| F | ATA | 14.967 | 7.573 | 0.989 | 9.298 | 0.575 | 2.081 | 1.894 | 36.008 | 0.060 |
| DTA | 10.038 | 7.395 | 2.636 | 13.185 | 0.456 | 0.265 | 5.491 | 26.188 | 0.094 | |
| SAA | 28.724 | 15.695 | 1.584 | 8.196 | 0.784 | 0.333 | 5.655 | 26.053 | 0.071 | |
| IAA | 20.424 | 0.034 | 4.241 | 6.872 | 0.727 | 0.243 | 3.330 | 31.454 | 0.097 | |
| CCA | 15.045 | 1.968 | 3.666 | 5.890 | 0.592 | 0.086 | 6.037 | 28.054 | 0.088 | |
Fig. 4.
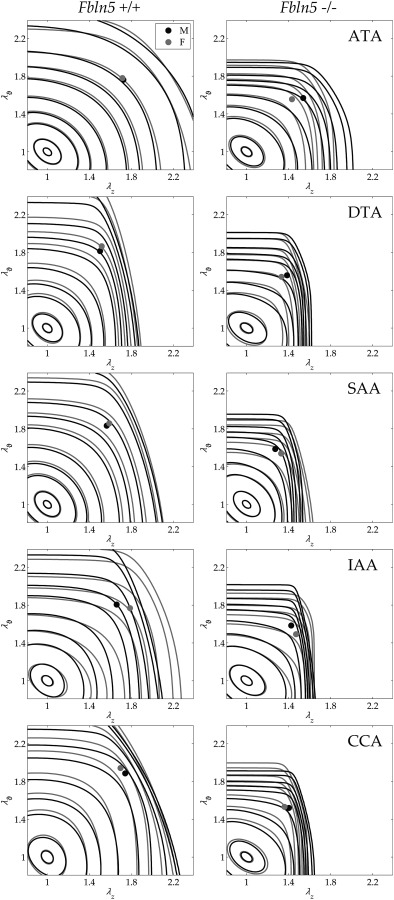
Average iso-energy contours of the stored energy calculated as a function of biaxial stretches W(λθ,λz). Fbln5+/+ are shown in the left column and Fbln5−/− in the right column; males are shown via black lines while females are shown via gray lines. Each panel shows energy levels corresponding to 0.1, 1, 5, 10, 20, 40, 60, 100, 250, and 500 kPa. Filled circles represent in vivo energy values computed at P sys and the individual in vivo axial stretches.
Fig. 5.
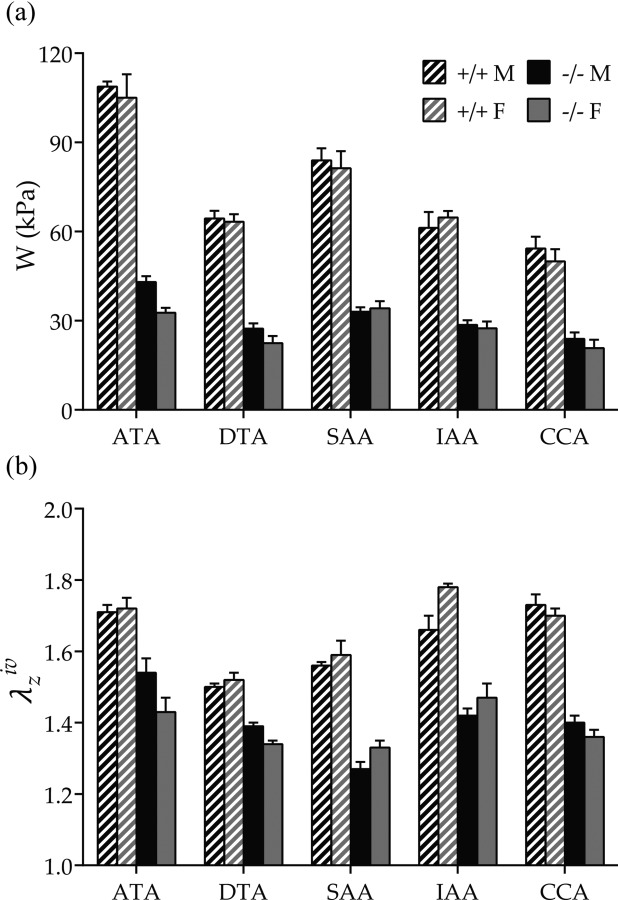
Average energy storage and in vivo axial stretch (mean ± SEM) from male (M, black bars), female (F, gray bars), Fbln5+/+ (+/+, shaded bars), and Fbln5−/− (−/−, solid bars) mice. (a) Energy stored at individual P sys and in vivo axial stretches (cf. Fig. 4) was significantly higher in wild-type versus fibulin-5 deficient arteries for each region, independent of sex. (b) in vivo axial stretch ratio was consistently higher in wild-type arteries. Sex differences were observed in Fbln5+/+ IAAs (increased in females) and Fbln5−/− DTAs (decreased in females). Numerical values and significant differences with p < 0.05 are reported in Table 2.
3.3. Effect of Location.
Regional differences in unloaded and systolic geometries are seen in Table 2 and Fig. 1. Note, too, that the in vivo axial force was largest in the ATA, for all four groups, similar for the DTA and SAA, and smallest in the IAA and CCA (cf. Fig. 1 in Ref. [27]). Interestingly, the in vivo axial stretches needed to maintain these axial forces did not follow the same trends. Rather, in Fbln5+/+ mice, the in vivo axial stretch was high in the ATA similar to the CCA, but dropped dramatically in the DTA and then increased when moving toward the SAA and IAA. Such regional variations tended to be less pronounced in fibulin-5 deficient animals, however, with the SAA (rather than the DTA) exhibiting the lowest value in both males and females. The most significant differences in unloaded geometry between Fbln5+/+ and Fbln5−/− arteries were in the ATA and SAA, which displayed higher axial lengths, and in the IAA, which exhibited larger unloaded diameters (Table 2). Interestingly, the DTA and SAA had the same diameter in both unloaded and systolic configurations, independent of genotype and sex, whereas the SAA systolic thickness was significantly lower than that in the DTA in all groups (with the exception of Fbln5+/+ females) and indistinguishable from that of the IAA. The relative magnitude of SAA diameter and thickness at systole led to a local increase in circumferential stress and stored energy. This trend, albeit reaching statistical significance only for Fbln5+/+ males, revealed that after the ATA, the SAA stored more elastic energy at systole than the other segments.
The most striking regional difference was that the ATA has unique biomechanical properties. It experienced, on average, higher biaxial stresses than the other regions (Table 2 and Fig. 2) and it exhibited nearly equibiaxial systolic stiffness, with circumferential stiffness consistently higher and axial stiffness consistently lower than that in all other regions. These equibiaxial states of stress and stiffness in the ATA were mirrored by the nearly symmetric iso-energy contours (Fig. 4). Finally, energy storage was consistently higher in the ATA under in vivo conditions than in all other regions for both genotypes (Fig. 5(a)). Indeed, the EDR tended to increase as a function of distance from the heart, although the only statistically significant differences were between ATA and IAA in male and female Fbln5+/+ arteries. Such unique properties of the ATA presumably correlate with its normally having the highest percentage of elastic fibers of any artery and it alone experiencing biaxial stretching during the cardiac cycle. Note, however, that the EDR was generally greater in fibulin-5 deficient than wild-type arteries, with significantly higher values in Fbln5−/− ATAs of both sexes and in male Fbln5−/− SAAs and IAAs.
Constitutively, Fbln5+/+ (but not Fbln5−/−) arteries showed a decreasing trend in the neo-Hookean parameter c as caliber decreased, with the exception of the SAA which had the highest value in all groups. Also, the parameter was greater than or nearly equal to in the ATA alone, which also had the largest angle associated with these diagonal fiber families.
3.4. Effect of Sex.
Differences between males and females were much more modest than those due to genotype and region and were mostly due to overall differences in body size; arteries from females had smaller diameters than males of the same genotype and age. In particular, Fbln5+/+ females had smaller values of unloaded outer diameters in all regions except the SAA and smaller unloaded lengths in the ATA. Less expectedly, the female Fbln5+/+ IAA had a significantly higher in vivo axial stretch, which led to higher values of axial stress and axial stiffness (Table 2). Similar to the regional variations, sex differences in Fbln5−/− arteries were less marked than those in Fbln5+/+ arteries. The only significant sex-dependent differences in Fbln5−/− mice were CCA unloaded diameter, SAA unloaded axial length, and DTA in vivo axial stretch.
3.5. Microstructure.
Due to the lack of major biomechanical differences between male and female arteries for both genotypes, we focused our histological examinations on males to permit future comparisons with most prior studies of other mouse models. We processed 3–4 samples per location for both genotypes for a total sample size of n = 32. Thus, quantifying two full arterial cross sections per stain (VVG, MTC, and MOV), we analyzed 192 images (32 samples × 3 stains × 2 cross sections). Figure 6(a) shows representative VVG-stained cross sections to highlight effects of fibulin-5 deficiency on elastic fiber integrity in the five regions of interest. As expected, Fbln5+/+ arteries exhibited wavy medial elastin, with a clear reduction in the number of medial lamellar units as the caliber decreased (left column). While preserving the same overall organization, Fbln5−/− arteries exhibited a generalized fragmentation of elastic fibers, with clusters of nonfunctional (i.e., nonload-bearing) elastin neighboring the primary lamellar structures (Fig. 6(a), right column). Note that the degree of disorganization suggested a radial gradient, with innermost laminae being the most intact. For completeness, Fig. 6(b) shows similar views of MOV- and MTC-stained cross sections for Fbln5+/+ and Fbln5−/− ATAs. In particular, MTC stains collagen blue and smooth muscle cytoplasm red. Because quantification of the blue in MTC images led to an overestimation of collagen area fractions (), and hence total wall composition, we also calculated what the area fraction should have been if the sum of all constituent area fractions equaled 1 (i.e., ). Based on the entire dataset (n = 32), calculated and measured collagen related linearly: (). Hence, it appeared that that overestimated total collagen content by 20%, presumably due to co-localization of positive collagen staining with medial elastic fibers. We thus corrected the collagen measurements using the above calibration, which essentially introduced an offset because the slope was nearly one.
Fig. 6.
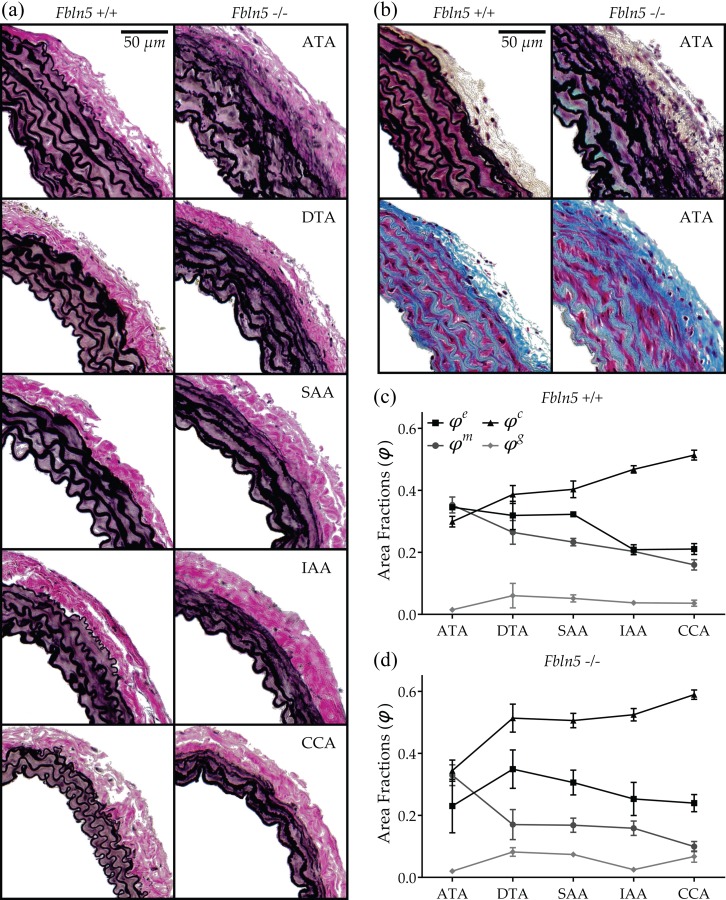
Microstructural composition of male Fbln5+/+ and Fbln5−/− arteries. (a) VVG-stained cross sections of central arteries from wild-type and fibulin-5 deficient animals. Note the generalized elastin (black) fragmentation and the loss of laminae waviness in the IAA and CCA of Fbln5−/− arteries. (b) MOV- and MTC-stained cross sections of ATAs showing collagen (blue in MTC), smooth muscle cytoplasm (red in MTC), and GAGs/PGs (blue–green in MOV). See on-line version for color. (c) and (d) Regional composition of Fbln5+/+ and Fbln5−/− arteries, respectively. Numerical values and significant differences with p < 0.05 are reported in Table 4.
Results for the microstructural composition of Fbln5+/+ arteries (Table 4) are seen in Fig. 6(c) where area fractions are plotted for each region and ordered by arterial caliber. Although the ATA possesses more elastic layers than either the DTA or SAA (Fig. 6(a)), the elastin area fractions were nearly the same among these three central arteries but dropped markedly when moving toward the IAA and CCA. Such a difference in the abdominal aortic wall composition constitutes an apparent discontinuity in the longitudinal distribution of elastin at the level of the renal arteries. Conversely, collagen and smooth muscle area fractions followed more gradual changes as diameter decreased (increasing and decreasing, respectively). As a result, the CCA had a higher content of collagen than all regions except the IAA, while the ATA had a higher content of smooth muscle than all regions except the DTA. Combining results, the collagen-to-elastin ratio was significantly higher in IAA and CCA with respect to the other regions. Finally, GAGs/PGs were distributed uniformly among all regions, with area fractions matching the 2–5% by dry weight traditionally reported [37].
Table 4.
Microstructural data (mean ± SEM) for central arteries from male (M), wild-type (Fbln5+/+), and fibulin-5 deficient (Fbln5−/−) mice
|
M |
|||||
|---|---|---|---|---|---|
| Fbln5 +/+ | ATA | DTA | SAA | IAA | CCA |
| n (number) | 3 | 3 | 3 | 3 | 3 |
| Area fractions | |||||
| Elastin | 0.345 ± 0.005 | 0.319 ±0.046 | 0.323 ± 0.010 | 0.209 ± 0.016 | 0.211 ± 0.018 |
| Collagen | 0.299 ± 0.017 | 0.387 ± 0.029 | 0.404 ± 0.027 | 0.468 ± 0.012 | 0.514 ± 0.016 |
| Smooth muscle | 0.353 ± 0.026 | 0.265 ± 0.039 | 0.233 ± 0.012 | 0.203 ± 0.011 | 0.160 ± 0.017 |
| GAGs/PGs | 0.015 ± 0.004 | 0.061 ± 0.040 | 0.052 ± 0.012 | 0.037 ± 0.007 | 0.036 ± 0.010 |
| IEL waviness | 0.252 ± 0.016 | 0.277 ± 0.012 | 0.293 ± 0.012 | 0.290 ±0.012 | 0.261 ± 0.015 |
| Collagen-to-elastin ratio | 0.867 ± 0.057 | 1.280 ±0.239 | 1.248 ± 0.053 | 2.281 ± 0.250 | 2.480 ± 0.254 |
|
M |
|||||
|---|---|---|---|---|---|
| Fbln5 −/− | ATA | DTA | SAA | IAA | CCA |
| n (number) | 3 | 3 | 3 | 3 | 3 |
| Area fractions | |||||
| Elastin | 0.230 ± 0.086 | 0.349 ± 0.062 | 0.306 ± 0.040 | 0.253 ± 0.053 | 0.240 ± 0.028 |
| Collagen | 0.344 ± 0.034 | 0.514 ± 0.045 | 0.506 ± 0.024 a | 0.525 ± 0.020 | 0.590 ± 0.015 a |
| Smooth muscle | 0.330 ± 0.034 | 0.170 ± 0.049 | 0.169 ± 0.023 | 0.158 ± 0.023 | 0.100 ± 0.016 |
| GAGs/PGs | 0.020 ± 0.007 | 0.082 ± 0.014 | 0.074 ± 0.007 | 0.025 ± 0.008 | 0.067 ± 0.018 |
| IEL waviness | 0.302 ± 0.023 | 0.277 ± 0.026 | 0.248 ± 0.024 | 0.237 ± 0.008 a | 0.162 ± 0.014 a |
| Collagen-to-elastin ratio | 2.051 ± 0.753 | 1.727 ± 0.485 | 1.736 ± 0.226 | 2.258 ± 0.439 | 2.524 ± 0.283 |
p < 0.05 between Fbln5 +/+ and Fbln5 −/− of the same location.
Notwithstanding the considerable disorganization of the elastic laminae, Fbln5−/− arteries did not show significant differences in elastin area fractions across regions. In particular, the expected sudden decrease in elastin content across the renal arteries was no longer evident. An opposite result surfaced by examining IEL waviness, however (Table 4). Fbln5+/+ arteries displayed a nearly constant undulation of elastin in all regions whereas Fbln5−/− arteries had a waviness index that decreased with the vessel diameter. Consequently, Fbln5−/− IAAs and CCAs exhibited significantly lower IEL waviness than their Fbln5+/+ counterparts, a result confirmed qualitatively (Fig. 6(a)). Collagen content tended to be higher in Fbln5−/− arteries, reaching statistical significance in the SAA and CCA, while trending toward significance (p < 0.1) in the DTA and IAA. Collagen-to-elastin ratio was increased uniformly, albeit never significantly, in Fbln5−/− arteries with respect to Fbln5+/+. Neither smooth muscle nor GAG/PG area fractions seemed to be affected by the loss of fibulin-5, although some regional differences arose in GAG/PG distribution, with the DTA showing significantly higher contents than ATA and IAA. Finally, quantification of microstructural contents in Fbln5−/− vessels was characterized by a higher variability than in Fbln5+/+.
4. Discussion
Defects in, damage to, or degradation of elastic fibers can play fundamental roles in central artery stiffening [20–22,41]. In particular, loss of elastic fiber integrity can directly affect collagen undulation [31], and thus bulk mechanical properties, and smooth muscle phenotype [42], and thus subsequent adaptive responses. We focused on effects of a germline mutation to the gene that codes the elastin-associated glycoprotein fibulin-5 (Fbln5); this mutation yields a severe arterial elastopathy without aneurysmal dilatation or dissection [5]. Consistent with prior results [7,8], we also found that Fbln5−/− CCAs exhibited a marked increase in structural stiffness relative to Fbln5+/+ (Fig. 1). In addition, however, this increased stiffness manifested in all central arteries, independent of sex, at the age considered (∼21 weeks). It is important to note in this regard that Wan and Gleason [9] reported that, unlike in Fbln5+/+ mice, CCAs in Fbln5−/− mice do not change biomechanically during maturation from 3 to 13 weeks of age, noting of course that behaviors beyond 12 weeks of age typically remain similar for significant periods even in wild-types. It would be of interest, therefore, to determine if the differences in structural stiffness observed herein manifest uniformly prior to 3 weeks of age, when hemodynamic conditions are changing rapidly (cf. Ref. [43]), and if they are preserved in much older mice. It is the structural stiffness, of course, that governs the hemodynamics, particularly stiffness-related changes in pulse wave velocity and central pulse pressure.
Another conspicuous and consistent difference between Fbln5−/− and Fbln5+/+ arteries, independent of region or sex, was the significantly lower value of the energetically preferred value of axial stretch for the fibulin-5 deficient mice (Table 2). Such reductions have been reported for elastin-deficient [44] and fibrillin-1 deficient [30] CCAs, both of which represent less severe forms of elastopathy than the fibulin-5 deficient CCA. It is interesting, therefore, that the preferred axial stretch for CCAs in male mice reduces from ∼1.71 for wild-type to ∼1.63 (Fbn1mgR/mgR [30]), ∼1.40 (Fbln5−/− [8] and herein), ∼1.27 (aortic banding [45]), and ∼1.05 (complete removal of elastin via elastase [31]). Noting that there was a significantly increased deposition of collagen in the aortic banding model, these graded differences in preferred axial stretch may reflect differences in the collagen-to-elastin ratio similar to findings for CCAs across species [46]. Regardless, it appears that central arteries reduce axial stretch, and thus biaxial stress, as one way to compensate for genetic defects in structural proteins or increased hemodynamic loads. This potential compensatory mechanism arose consistently herein in all five regions and re-emphasizes the importance of biaxial data. Indeed, this finding is particularly striking given the differences in axial stretch normally experienced by these five vessels: The ATA extends significantly throughout every cardiac cycle due in part to the axial motion of the heart, the CCA likely extends with dramatic changes in the position of the head, and the DTA, SAA, and IAA probably do not extend significantly due to either the cardiac cycle or changes in body position.
Although central artery stiffness is now a clinically valued metric of cardiovascular function and risk, values are computed in vivo and in vitro in terms of many different parameters. Whereas some of these computations are not theoretically founded (e.g., incremental relations stemming from linear elasticity), values of material stiffness having in vivo relevance can be obtained via appropriate linearizations of the nonlinear anisotropic mechanical behavior (cf. Eq. (5)). Toward this end, we used the theory of small deformations superimposed on large [35] that is summarized well in Ref. [47]. Such a linearization resulted in two primary components of stiffness, circumferential and axial, that can be very informative (cf. Table 2 while noting that representations in Fig. 2 were computed directly from W and nevertheless matched well the local slopes in the stress–stretch plots for tests at a fixed in vivo axial stretch). It is obvious, however, that a single (scalar) metric would be easier to interpret. Recalling that the primary function of a large artery is to store elastic energy during systole and to use that energy to work on the blood during diastole, we suggest that the scalar metric W may be a better comparator of changes in “stiffness” (see Ref. [33] for a general context and Refs. [28,48] for applications to murine arteries). As revealed by Fig. 5, energy storage was significantly lower for Fbln5−/− arteries in all five regions independent of sex. The primary reason for this reduced elastic functionality was the decreased distension (range of λϑ) and extension (range of λz) revealed in Fig. 4, which would typically be interpreted as increased stiffness although the actual slope of the stress–stretch response need not be that different (cf. Fig. 2). Table 2 also lists an EDR, namely, the ratio of the energy lost during cyclic loading relative to the total energy stored in the vessel upon loading. The Fbln5+/+ ATA stored the most energy and dissipated the least whereas fibulin-5 deficiency resulted in the greatest decrease in stored energy and greatest increase in energy dissipation in the ATA. Interestingly, the IAA had the overall greatest energy dissipation. With two exceptions (IAA and CCA in Fbln5−/− females), energy dissipation tended to increase with the fibulin-5 deficiency, thus suggesting a less efficient functionality. Motivated by the structure–function relationship commonly hypothesized for biological tissues, Fig. 7 relates the average systolic stored energy and EDR (indicators of biomechanical function) with average area fractions of elastin and collagen (indicators of wall structure), respectively. As expected, Fbln5+/+ arteries had a good structure–function relation, with systolic energy storage increasing with higher () and energy dissipation increasing with higher (). In contrast, loss of such correlations ( and ) in Fbln5−/− vessels suggested that structure and function were decoupled uniformly, as highlighted by the uniform decrease in energy storage and increase in energy dissipation across all central arteries.
Fig. 7.
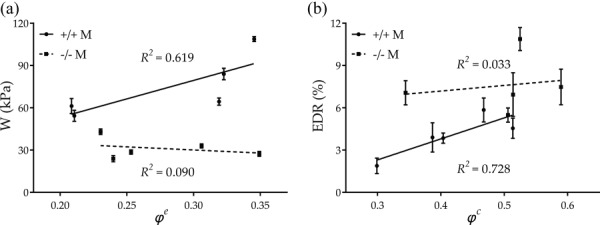
Structure–function relationship for Fbln5+/+ and Fbln5−/− arteries showing the uniform loss of functionality due to fibulin-5 deficiency. (a) Systolic stored energy is consistently decreased in Fbln5−/− arteries. (b) EDR is consistently increased in Fbln5−/− arteries.
Because of the inherent nonlinear behavior exhibited by central arteries, the structural stiffness, and similarly the wall thickness and material stiffness upon which it depends, is a strong function of pressure. All pressure-dependent values reported in Table 2 were evaluated at the mouse-specific P sys measured at rest via a tail-cuff method (Table 1). There has been little study, however, of how tail-cuff measurements in mice at rest compare with central blood pressures either at rest or under normal activity despite well-known differences between peripheral and central pressures in humans [11]. Moreover, there has been little study of how increases in blood pressure with activity or decreases with anesthesia may differ between wild-types and mutants. Interestingly, values of resting P sys reported in Table 1 (∼120 mmHg) are similar to previous reports of central P mean (∼113 mmHg) in Fbln5+/+ and Fbln5−/− deficient mice measured via an indwelling catheter at an unidentified level of conscious activity [5]. Hence, whether values in Table 2 represent properties at resting systolic or active mean pressures, it appears that the Fbn5−/− arteries over-compensated during development in response to the mutation. That is, wall thicknesses were consistently greater and axial stretches consistently lower in the Fbln5−/− mice, which contributed to lower circumferential and axial stresses in all five regions relative to Fbln5+/+ mice, independent of sex. It is often thought, of course, that wall shear stress and especially circumferential stress are maintained near normal values in vessels that adapt properly [28,49].
Regional variations in elastic and viscoelastic properties were first reported by Fung and colleagues based on uniaxially tested specimens from eight locations along the canine aorta [50]. More recently, Sokolis and colleagues reported variations in geometry, composition, and uniaxial mechanical properties along the porcine aorta for both male [51] and female [52] animals, though potential differences between the sexes were not evaluated. These data again revealed a higher stiffness in the distal segments under physiologic conditions. Associated microstructural data appeared consistent with this finding in that collagen content was lower than elastin content in the thoracic aorta but higher in the abdominal aorta, with a marked change immediately after the diaphragm; GAGs/PGs were not considered although they likely contribute to viscoelastic effects. Zhao et al. [53] performed free-end pressurization tests on rat arteries, including the DTA, IAA, and CCA. Consistent with our results, they showed that the DTA is the least extensible. Guo and Kassab [54] performed in situ pressurization tests on intact wild-type mouse aortas and reported P–d results at five locations from the ascending to the infrarenal aorta; these incremental tests did not include axial measurements of force, however, and the data were reduced using inappropriate incremental moduli (resulting in E inc ∼ 50–150 kPa). Faury et al. [55] presented P–d data and calculations of distensibility for the ascending aorta, abdominal aorta, and carotid arteries from Eln+/+ and Eln+/− mice, but did not quantify material properties. Wagenseil et al. [44] extended these studies by reporting biaxial (P–d–f) data at multiple values of in vivo axial stretch for the same vessels and genotypes. Although stress–stretch plots were presented, there was no constitutive formulation. Most other studies of murine arteries, including our prior work, have tended to focus on but a single arterial location. In this regard, our results for the CCA agreed with those of Wan et al. [8] in terms of in vivo axial stretches, unloaded and loaded geometries, and loaded stresses despite differences in the ages of the mice (13 versus 21 weeks). The main differences between these two studies were trends in the best-fit material parameters; they estimated lower values of the neo-Hookean parameter for Fbln5−/− CCAs. Such differences could arise because they pressurized vessels up to 180 mmHg during P–d testing whereas we pressurized to 140 mmHg, thus reminding us of the key role of experimental conditions when comparing results across studies.
In summary, the present data represent, to the best of our knowledge, the first consistent biaxial quantification of regional differences in central artery material behavior and composition in mice. As revealed by Table 2, and reflected by Figs. 2 and 4, the normal DTA, IAA, and CCA exhibited similar levels of circumferential (∼1.85 MPa in males and ∼1.79 MPa in females) and axial (∼4.0 MPa in males and females) material stiffness at the individual values of preferred axial stretch and tail-cuff measured P sys. That the axial stiffness was consistently higher revealed a strong anisotropy. These circumferential values are the same order of magnitude as the E inc ∼ 1 MPa at P sys reported by Wagenseil and Mecham [56], which may have been calculated based on implicit assumptions of isotropy and incremental elasticity. The normal ATA and SAA were different, however, since they exhibited higher values of circumferential stiffness and lower values of axial stiffness with respect to the other regions. In particular, the ATA was unique; it alone had a more nearly equibiaxial stiffness (2.49 MPa circumferentially and 2.51 MPa axially, when averaged across males and females). Interestingly, both circumferential and axial stresses were higher at systole in the ATA compared with the other five regions. Toward this end, the high preferred value of axial stretch exhibited by the ATA was similar to that of the CCA in wild-type animals whereas the DTA tended to have the lowest value. Such a high value of axial stretch for the ATA is in contrast with previously reported values. Han and Fung [57] (for pig and dogs) and later by Guo and Kassab [54] (for mice) reported that the axial stretch ratio increases monotonically from the ascending to the infrarenal aorta. It should be noted, however, that these studies measured axial retraction upon dissection and the axial length of the ATA was measured after arresting the heart. Moreover, the in situ pressurization tests performed by Guo and Kassab [54] required cannulation of the ascending aorta by inserting a 25-gauge needle through the apex of the heart, with a proximal suturing of the ATA. Hence, possible axial motions of the ATA upon pressurization were likely restricted by their experimental design.
As noted earlier, the ATA normally experiences significant circumferential distensions and axial extensions during each cardiac cycle due to ventricular traction. For example, Beller et al. [58] quantified downward displacements of the aortic root up to 14 mm in the human ATA using angiography whereas Jin et al. [59] confirmed the presence of such axial stretching via MR imaging. The latter group showed further that blood velocity measured using PC-MRI could be reproduced accurately by a computational model only when accounting for the observed axial movements due to the beating heart. Recently, Labrosse et al. [60] performed in vitro free-end pressurization tests on human ATA, DTA, and IAA from both male and female donors. They showed that, under free extension conditions, the ATA consistently exhibits the highest axial stretch within each group of patients with no reported differences between the two sexes. Indeed, Roccabianca et al. [24] compared biaxial properties of human ATA, DTA, and IAA from young, middle-aged, and older subjects based on data from the literature. Strikingly, they also found that, within each age group, the ATA shows the highest axial extensibility, thus supporting the uniqueness of its biomechanical properties. We thus submit that although the energetically preferred axial stretch estimated herein for the mouse ATA is higher than previously reported values, its objective determination in vitro (via the cross-over point in f–l tests) allowed us to compare biomechanical properties consistently across groups (i.e., genotype, region, and sex) while presumably representing the in vivo value at systole.
5. Limitations
The unloaded length was much less in the Fbln5+/+ ATA than in other regions due to anatomical limitations. A short sample can cause measured pressure–diameter behavior in the central region to depend on end-effects. Hence, we maximized the testable length of the ATA by suturing proximally at the aortic valve and distally at the base of the brachiocephalic trunk. The SAA exhibited significant circumferential and axial residual stresses. Although nearly straight in vivo, the SAA underwent significant anterior bending upon excision. Thus, it had to be straightened prior to determining the unloaded configuration; effects of such residual strains were not addressed. Regarding the histological analysis, quantifications were based on pixel-specific thresholds to quantify each constituent based on color. While areal constituent density is important for understanding mechanical behavior, additional metrics such as collagen fiber diameter, elastin fragmentation, degree of fiber cross-linking, and prestretch can also influence the global mechanical behavior; they need to be considered in future studies.
6. Closure
The present findings revealed that a germline mutation causing a severe elastopathy results, in maturity, in marked increases in structural stiffness despite modest differences in material stiffness, marked decreases in elastic energy storage, and typically increases in energy dissipation throughout the central arteries—ATA, DTA, SAA, IAA, and CCAs—independent of sex. Interestingly, these differences manifested despite an apparent attempt by the Fbln5−/− arteries to compensate for the severe structural defect. That is, all fibulin-5 deficient arteries exhibited thicker walls and a much reduced axial stretch, which appeared to contribute to the lower values of intramural stresses and in some cases material stiffness. Nevertheless, structural stiffening manifested primarily as reductions in distensibility and extensibility, which in turn appeared to contribute significantly to the reduced elastic energy storage, especially in the ascending aorta. Because the most dramatic differences manifested in the ascending aorta, which is not within the region of measurement of the current gold standard clinical metric of stiffness (cf-PWV), there is motivation to consider other clinical metrics. Indeed, given that large artery function is defined primarily by its ability to recoil during diastole to augment blood flow, assessing changes in the scalar metric “stored energy” may be better for quantifying large artery functionality and its possible effects on hemodynamics and cardiac function.
Acknowledgment
This work was supported by grants from the NIH (R01 HL105297 and R03 EB016810).
Contributor Information
J. Ferruzzi, Department of Biomedical Engineering, Malone Engineering Center, Yale University, New Haven, CT 06520
M. R. Bersi, Department of Biomedical Engineering, Malone Engineering Center, Yale University, New Haven, CT 06520
S. Uman, Department of Biomedical Engineering, Malone Engineering Center, Yale University, New Haven, CT 06520
H. Yanagisawa, Department of Molecular Biology, University of Texas Southwestern, Medical Center, Dallas, TX 75390
J. D. Humphrey, Fellow ASME, Department of Biomedical Engineering, Malone Engineering Center, Yale University, New Haven, CT 06520; Vascular Biology and Therapeutics Program, Yale School of Medicine, New Haven, CT 06510, e-mail: jay.humphrey@yale.edu.
References
- [1]. Yanagisawa, H. , and Davis, E. C. , 2010, “Unraveling the Mechanism of Elastic Fiber Assembly: The Roles of Short Fibulins,” Int. J. Biochem. Cell Biol., 42(7), pp. 1084–1093. 10.1016/j.biocel.2010.03.009 [DOI] [PMC free article] [PubMed] [Google Scholar]
- [2]. Ramirez, F. , and Dietz, H. C. , 2007, “Fibrillin-Rich Microfibrils: Structural Determinants of Morphogenetic and Homeostatic Events,” J. Cell. Physiol., 213(2), pp. 326–330. 10.1002/jcp.21189 [DOI] [PubMed] [Google Scholar]
- [3]. Huang, J. , Davis, E. C. , Chapman, S. L. , Budatha, M. , Marmorstein, L. Y. , Word, R. A. , and Yanagisawa, H. , 2010, “Fibulin-4 Deficiency Results in Ascending Aortic Aneurysms: A Potential Link Between Abnormal Smooth Muscle Cell Phenotype and Aneurysm Progression,” Circ. Res., 106(3), pp. 583–592. 10.1161/CIRCRESAHA.109.207852 [DOI] [PMC free article] [PubMed] [Google Scholar]
- [4]. Nakamura, T. , Lozano, P. R. , Ikeda, Y. , Iwanaga, Y. , Hinek, A. , Minamisawa, S. , Cheng, C.-F. , Kobuke, K. , Dalton, N. , Takada, Y. , Tashiro, K. , Ross, J., Jr. , Honjo, T. , and Chien, K. R. , 2002, “Fibulin-5/DANCE is Essential for Elastogenesis In Vivo,” Nature, 415(6868), pp. 171–175. 10.1038/415171a [DOI] [PubMed] [Google Scholar]
- [5]. Yanagisawa, H. , Davis, E. C. , Starcher, B. C. , Ouchi, T. , Yanagisawa, M. , Richardson, J. A. , and Olson, E. N. , 2002, “Fibulin-5 is an Elastin-Binding Protein Essential for Elastic Fibre Development In Vivo,” Nature, 415(6868), pp. 168–171. 10.1038/415168a [DOI] [PubMed] [Google Scholar]
- [6]. Yanagisawa, H. , Schluterman, M. K. , and Brekken, R. A. , 2009, “Fibulin-5, an Integrin-Binding Matricellular Protein: Its Function in Development and Disease,” J. Cell Commun. Signalling, 3(3–4), pp. 337–347. 10.1007/s12079-009-0065-3 [DOI] [PMC free article] [PubMed] [Google Scholar]
- [7]. Spencer, J. A. , Hacker, S. L. , Davis, E. C. , Mecham, R. P. , Knutsen, R. H. , Li, D. Y. , Gerard, R. D. , Richardson, J. A. , Olson, E. N. , and Yanagisawa, H. , 2005, “Altered Vascular Remodeling in Fibulin-5-Deficient Mice Reveals a Role of Fibulin-5 in Smooth Muscle Cell Proliferation and Migration,” Proc. Natl. Acad. Sci. USA, 102(8), pp. 2946–2951. 10.1073/pnas.0500058102 [DOI] [PMC free article] [PubMed] [Google Scholar]
- [8]. Wan, W. , Yanagisawa, H. , and Gleason, R. L., Jr. , 2010, “Biomechanical and Microstructural Properties of Common Carotid Arteries From Fibulin-5 Null Mice,” Ann. Biomed. Eng., 38(12), pp. 3605–3617. 10.1007/s10439-010-0114-3 [DOI] [PMC free article] [PubMed] [Google Scholar]
- [9]. Wan, W. , and Gleason, R. L. , 2013, “Dysfunction in Elastic Fiber Formation in Fibulin-5 Null Mice Abrogates the Evolution in Mechanical Response of Carotid Arteries During Maturation,” Am. J. Physiol.: Heart Circ. Physiol., 304(5), pp. H674–H686. 10.1152/ajpheart.00459.2012 [DOI] [PMC free article] [PubMed] [Google Scholar]
- [10]. Boutouyrie, P. , Laurent, S. , and Briet, M. , 2008, “Importance of Arterial Stiffness as Cardiovascular Risk Factor for Future Development of New Type of Drugs,” Fundam. Clin. Pharmacol., 22(3), pp. 241–246. 10.1111/j.1472-8206.2008.00584.x [DOI] [PubMed] [Google Scholar]
- [11]. Adji, A. , O'Rourke, M. F. , and Namasivayam, M. , 2011, “Arterial Stiffness, Its Assessment, Prognostic Value, and Implications for Treatment,” Am. J. Hypertens., 24(1), pp. 5–17. 10.1038/ajh.2010.192 [DOI] [PubMed] [Google Scholar]
- [12]. Najjar, S. S. , Scuteri, A. , Shetty, V. , Wright, J. G. , Muller, D. C. , Fleg, J. L. , Spurgeon, H. P. , Ferrucci, L. , and Lakatta, E. G. , 2008, “Pulse Wave Velocity is an Independent Predictor of the Longitudinal Increase in Systolic Blood Pressure and of Incident Hypertension in the Baltimore Longitudinal Study of Aging,” J. Am. Coll. Cardiol., 51(14), pp. 1377–1383. 10.1016/j.jacc.2007.10.065 [DOI] [PMC free article] [PubMed] [Google Scholar]
- [13]. Wang, K.-L. , Cheng, H.-M. , Sung, S.-H. , Chuang, S.-Y. , Li, C.-H. , Spurgeon, H. A. , Ting, C.-T. , Najjar, S. S. , Lakatta, E. G. , Yin, F. C. P. , Chou, P. , and Chen, C.-H. , 2010, “Wave Reflection and Arterial Stiffness in the Prediction of 15-Year All-Cause and Cardiovascular Mortalities: A Community-Based Study,” Hypertension, 55(3), pp. 799–805. 10.1161/HYPERTENSIONAHA.109.139964 [DOI] [PMC free article] [PubMed] [Google Scholar]
- [14]. Agabiti-Rosei, E. , Mancia, G. , O'Rourke, M. F. , Roman, M. J. , Safar, M. E. , Smulyan, H. , Wang, J.-G. , Wilkinson, I. B. , Williams, B. , and Vlachopoulos, C. , 2007, “Central Blood Pressure Measurements and Antihypertensive Therapy: A Consensus Document,” Hypertension, 50(1), pp. 154–160. 10.1161/HYPERTENSIONAHA.107.090068 [DOI] [PubMed] [Google Scholar]
- [15]. Lakatta, E. G. , Wang, M. , and Najjar, S. S. , 2009, “Arterial Aging and Subclinical Arterial Disease are Fundamentally Intertwined at Macroscopic and Molecular Levels,” Med. Clin. N. Am., 93(3), pp. 583–604. 10.1016/j.mcna.2009.02.008 [DOI] [PMC free article] [PubMed] [Google Scholar]
- [16]. Safar, M. E. , 2010, “Arterial Aging—Hemodynamic Changes and Therapeutic Options,” Nat. Rev. Cardiol., 7(8), pp. 442–449. 10.1038/nrcardio.2010.96 [DOI] [PubMed] [Google Scholar]
- [17]. Sugawara, J. , Hayashi, K. , Yokoi, T. , and Tanaka, H. , 2008, “Age-Associated Elongation of the Ascending Aorta in Adults,” JACC Cardiovasc. Imaging, 1(6), pp. 739–748. 10.1016/j.jcmg.2008.06.010 [DOI] [PubMed] [Google Scholar]
- [18]. Hickson, S. S. , Butlin, M. , Graves, M. , Taviani, V. , Avolio, A. P. , McEniery, C. M. , and Wilkinson, I. B. , 2010, “The Relationship of Age With Regional Aortic Stiffness and Diameter,” JACC Cardiovasc. Imaging, 3(12), pp. 1247–1255. 10.1016/j.jcmg.2010.09.016 [DOI] [PubMed] [Google Scholar]
- [19]. Redheuil, A. , Yu, W.-C. , Wu, C. O. , Mousseaux, E. , Cesare, A. , de, Yan, R. , Kachenoura, N. , Bluemke, D. , and Lima, J. A. C. , 2010, “Reduced Ascending Aortic Strain and Distensibility: Earliest Manifestations of Vascular Aging in Humans,” Hypertension, 55(2), pp. 319–326. 10.1161/HYPERTENSIONAHA.109.141275 [DOI] [PMC free article] [PubMed] [Google Scholar]
- [20]. O'Rourke, M. F. , and Hashimoto, J. , 2007, “Mechanical Factors in Arterial Aging: A Clinical Perspective,” J. Am. Coll. Cardiol., 50(1), pp. 1–13. 10.1016/j.jacc.2006.12.050 [DOI] [PubMed] [Google Scholar]
- [21]. Lacolley, P. , Challande, P. , Osborne-Pellegrin, M. , and Regnault, V. , 2009, “Genetics and Pathophysiology of Arterial Stiffness,” Cardiovasc. Res., 81(4), pp. 637–648. 10.1093/cvr/cvn353 [DOI] [PubMed] [Google Scholar]
- [22]. Wagenseil, J. E. , and Mecham, R. P. , 2012, “Elastin in Large Artery Stiffness and Hypertension,” J. Cardiovasc. Transl. Res., 5(3), pp. 264–273. 10.1007/s12265-012-9349-8 [DOI] [PMC free article] [PubMed] [Google Scholar]
- [23]. Rachev, A. , Greenwald, S. , and Shazly, T. , 2013, “Are Geometrical and Structural Variations Along the Length of the Aorta Governed by a Principle of ‘Optimal Mechanical Operation’?,” ASME J. Biomech. Eng., 135(8), p. 081006. 10.1115/1.4024664 [DOI] [PubMed] [Google Scholar]
- [24]. Roccabianca, S. , Figueroa, C. A. , Tellides, G. , and Humphrey, J. D. , 2014, “Quantification of Regional Differences in Aortic Stiffness in the Aging Human,” J. Mech. Behav. Biomed. Mater., 29(1), pp. 618–634. 10.1016/j.jmbbm.2013.01.026 [DOI] [PMC free article] [PubMed] [Google Scholar]
- [25]. Daugherty, A. , Rateri, D. , Hong, L. , and Balakrishnan, A. , 2009, “Measuring Blood Pressure in Mice Using Volume Pressure Recording, a Tail-Cuff Method,” J. Vis. Exp., (27). 10.3791/1291 [DOI] [PMC free article] [PubMed] [Google Scholar]
- [26]. Gleason, R. L. , Wilson, E. , Humphrey, J. D. , and Gray, S. P. , 2005, “A Multiaxial Computer-Controlled Organ Culture and Biomechanical Device for Mouse Carotid Arteries,” ASME J. Biomech. Eng., 126(6), pp. 787–795. 10.1115/1.1824130 [DOI] [PubMed] [Google Scholar]
- [27]. Ferruzzi, J. , Bersi, M. R. , and Humphrey, J. D. , 2013, “Biomechanical Phenotyping of Central Arteries in Health and Disease: Advantages of and Methods for Murine Models,” Ann. Biomed. Eng., 41(7), pp. 1311–1330. 10.1007/s10439-013-0799-1 [DOI] [PMC free article] [PubMed] [Google Scholar]
- [28]. Bersi, M. R. , Ferruzzi, J. , Eberth, J. F. , Gleason, R. L. , and Humphrey, J. D. , 2014, “Consistent Biomechanical Phenotyping of Common Carotid Arteries From Seven Genetic, Pharmacological, and Surgical Mouse Models,” Ann. Biomed. Eng., 42(6), pp. 1207–1223. 10.1007/s10439-014-0988-6 [DOI] [PMC free article] [PubMed] [Google Scholar]
- [29]. Gleason, R. L. , Dye, W. W. , Wilson, E. , and Humphrey, J. D. , 2008, “Quantification of the Mechanical Behavior of Carotid Arteries From Wild-Type, Dystrophin-Deficient, and Sarcoglycan-δ Knockout Mice,” J. Biomech., 41(15), pp. 3213–3218. 10.1016/j.jbiomech.2008.08.012 [DOI] [PMC free article] [PubMed] [Google Scholar]
- [30]. Eberth, J. F. , Taucer, A. I. , Wilson, E. , and Humphrey, J. D. , 2009, “Mechanics of Carotid Arteries in a Mouse Model of Marfan Syndrome,” Ann. Biomed. Eng., 37(6), pp. 1093–1104. 10.1007/s10439-009-9686-1 [DOI] [PMC free article] [PubMed] [Google Scholar]
- [31]. Ferruzzi, J. , Collins, M. J. , Yeh, A. T. , and Humphrey, J. D. , 2011, “Mechanical Assessment of Elastin Integrity in Fibrillin-1-Deficient Carotid Arteries: Implications for Marfan Syndrome,” Cardiovasc. Res., 92(2), pp. 287–295. 10.1093/cvr/cvr195 [DOI] [PMC free article] [PubMed] [Google Scholar]
- [32]. Bersi, M. R. , Collins, M. J. , Wilson, E. , and Humphrey, J. D. , 2012, “Disparate Changes in the Mechanical Properties of Murine Carotid Arteries and Aorta in Response to Chronic Infusion of Angiotensin-II,” Int. J. Adv. Eng. Sci. Appl. Math., 4(4), pp. 228–240. 10.1007/s12572-012-0052-4 [DOI] [PMC free article] [PubMed] [Google Scholar]
- [33]. Humphrey, J. D. , 2002, Cardiovascular Solid Mechanics: Cells, Tissues, and Organs, Springer, New York. [Google Scholar]
- [34]. Ferruzzi, J. , Vorp, D. A. , and Humphrey, J. D. , 2011, “On Constitutive Descriptors of the Biaxial Mechanical Behaviour of Human Abdominal Aorta and Aneurysms,” J. R. Soc. Interface, 8(56), pp. 435–450. 10.1098/rsif.2010.0299 [DOI] [PMC free article] [PubMed] [Google Scholar]
- [35]. Baek, S. , Gleason, R. L. , Rajagopal, K. R. , and Humphrey, J. D. , 2007, “Theory of Small on Large: Potential Utility in Computations of Fluid–Solid Interactions in Arteries,” Comput. Methods Appl. Mech. Eng., 196(31–32), pp. 3070–3078. 10.1016/j.cma.2006.06.018 [DOI] [Google Scholar]
- [36]. Warriner, R. K. , Johnston, K. W. , and Cobbold, R. S. C. , 2008, “A Viscoelastic Model of Arterial Wall Motion in Pulsatile Flow: Implications for Doppler Ultrasound Clutter Assessment,” Physiol. Meas., 29(2), pp. 157–159. 10.1088/0967-3334/29/2/001 [DOI] [PubMed] [Google Scholar]
- [37]. Wight, T. N. , 1989, “Cell Biology of Arterial Proteoglycans,” Arterioscler. Thromb. Vasc. Biol., 9(1), pp. 1–20. 10.1161/01.ATV.9.1.1 [DOI] [PubMed] [Google Scholar]
- [38]. Merrilees, M. J. , Tiang, K. M. , and Scott, L. , 1987, “Changes in Collagen Fibril Diameters Across Artery Walls Including a Correlation With Glycosaminoglycan Content,” Connect. Tissue Res., 16(3), pp. 237–257. 10.3109/03008208709006979 [DOI] [PubMed] [Google Scholar]
- [39]. Rezakhaniha, R. , Agianniotis, A. , Schrauwen, J. T. C. , Griffa, A. , Sage, D. , Bouten, C. V. C. , van de Vosse, F. N. , Unser, M. , and Stergiopulos, N. , 2012, “Experimental Investigation of Collagen Waviness and Orientation in the Arterial Adventitia Using Confocal Laser Scanning Microscopy,” Biomech. Model. Mechanobiol., 11(3–4), pp. 461–473. 10.1007/s10237-011-0325-z [DOI] [PubMed] [Google Scholar]
- [40]. Crawley, M. J. , 2012, The R Book, Wiley, Chichester, UK. [Google Scholar]
- [41]. Arribas, S. M. , Hinek, A. , and González, M. C. , 2006, “Elastic Fibres and Vascular Structure in Hypertension,” Pharmacol. Ther., 111(3), pp. 771–791. 10.1016/j.pharmthera.2005.12.003 [DOI] [PubMed] [Google Scholar]
- [42]. Karnik, S. K. , Brooke, B. S. , Bayes-Genis, A. , Sorensen, L. , Wythe, J. D. , Schwartz, R. S. , Keating, M. T. , and Li, D. Y. , 2003, “A Critical Role for Elastin Signaling in Vascular Morphogenesis and Disease,” Development, 130(2), pp. 411–423. 10.1242/dev.00223 [DOI] [PubMed] [Google Scholar]
- [43]. Carta, L. , Wagenseil, J. E. , Knutsen, R. H. , Mariko, B. , Faury, G. , Davis, E. C. , Starcher, B. , Mecham, R. P. , and Ramirez, F. , 2009, “Discrete Contributions of Elastic Fiber Components to Arterial Development and Mechanical Compliance,” Arterioscler. Thromb. Vasc. Biol., 29(12), pp. 2083–2089. 10.1161/ATVBAHA.109.193227 [DOI] [PMC free article] [PubMed] [Google Scholar]
- [44]. Wagenseil, J. E. , Nerurkar, N. L. , Knutsen, R. H. , Okamoto, R. J. , Li, D. Y. , and Mecham, R. P. , 2005, “Effects of Elastin Haploinsufficiency on the Mechanical Behavior of Mouse Arteries,” Am. J. Physiol.: Heart Circ. Physiol., 289(3), pp. H1209–H1217. 10.1152/ajpheart.00046.2005 [DOI] [PubMed] [Google Scholar]
- [45]. Eberth, J. F. , Gresham, V. C. , Reddy, A. K. , Popovic, N. , Wilson, E. , and Humphrey, J. D. , 2009, “Importance of Pulsatility in Hypertensive Carotid Artery Growth and Remodeling,” J. Hypertens., 27(10), pp. 2010–2021. 10.1097/HJH.0b013e32832e8dc8 [DOI] [PMC free article] [PubMed] [Google Scholar]
- [46]. Humphrey, J. D. , Eberth, J. F. , Dye, W. W. , and Gleason, R. L. , 2009, “Fundamental Role of Axial Stress in Compensatory Adaptations by Arteries,” J. Biomech., 42(1), pp. 1–8. 10.1016/j.jbiomech.2008.11.011 [DOI] [PMC free article] [PubMed] [Google Scholar]
- [47]. Truesdell, C. , and Noll, W. , 2004, The Non-Linear Field Theories of Mechanics, Springer, Berlin, Germany. [Google Scholar]
- [48]. Eberth, J. F. , Cardamone, L. , and Humphrey, J. D. , 2011, “Evolving Biaxial Mechanical Properties of Mouse Carotid Arteries in Hypertension,” J. Biomech., 44(14), pp. 2532–2537. 10.1016/j.jbiomech.2011.07.018 [DOI] [PMC free article] [PubMed] [Google Scholar]
- [49]. Humphrey, J. D. , 2008, “Vascular Adaptation and Mechanical Homeostasis at Tissue, Cellular, and Sub-Cellular Levels,” Cell Biochem. Biophys., 50(2), pp. 53–78. 10.1007/s12013-007-9002-3 [DOI] [PubMed] [Google Scholar]
- [50]. Tanaka, T. T. , and Fung, Y.-C. , 1974, “Elastic and Inelastic Properties of the Canine Aorta and Their Variation Along the Aortic Tree,” J. Biomech., 7(4), pp. 357–370. 10.1016/0021-9290(74)90031-1 [DOI] [PubMed] [Google Scholar]
- [51]. Sokolis, D. P. , 2007, “Passive Mechanical Properties and Structure of the Aorta: Segmental Analysis,” Acta Physiol., 190(4), pp. 277–289. 10.1111/j.1748-1716.2006.01661.x [DOI] [PubMed] [Google Scholar]
- [52]. Sokolis, D. P. , Boudoulas, H. , and Karayannacos, P. E. , 2008, “Segmental Differences of Aortic Function and Composition: Clinical Implications,” Hell. J. Cardiol., 49(3), pp. 145–154, available at: http://www.hellenicjcardiol.com/archive/full_text/2008/3/2008_3_145.pdf http://dx.doi.org/ [PubMed] [Google Scholar]
- [53]. Zhao, J. , Day, J. , Yuan, Z. F. , and Gregersen, H. , 2002, “Regional Arterial Stress–Strain Distributions Referenced to the Zero-Stress State in the Rat,” Am. J. Physiol.: Heart Circ. Physiol., 282(2), pp. H622–H629. 10.1152/ajpheart.00620.2000 [DOI] [PubMed] [Google Scholar]
- [54]. Guo, X. , and Kassab, G. S. , 2003, “Variation of Mechanical Properties Along the Length of the Aorta in C57bl/6 Mice,” Am. J. Physiol.: Heart Circ. Physiol., 285(6), pp. H2614–H2622. 10.1152/ajpheart.00567.2003 [DOI] [PubMed] [Google Scholar]
- [55]. Faury, G. , Pezet, M. , Knutsen, R. H. , Boyle, W. A. , Heximer, S. P. , McLean, S. E. , Minkes, R. K. , Blumer, K. J. , Kovacs, A. , Kelly, D. P. , Li, D. Y. , Starcher, B. , and Mecham, R. P. , 2003, “Developmental Adaptation of the Mouse Cardiovascular System to Elastin Haploinsufficiency,” J. Clin. Invest., 112(9), pp. 1419–1428. 10.1172/JCI19028 [DOI] [PMC free article] [PubMed] [Google Scholar]
- [56]. Wagenseil, J. E. , and Mecham, R. P. , 2009, “Vascular Extracellular Matrix and Arterial Mechanics,” Physiol. Rev., 89(3), pp. 957–989. 10.1152/physrev.00041.2008 [DOI] [PMC free article] [PubMed] [Google Scholar]
- [57]. Han, H.-C. , and Fung, Y.-C. , 1995, “Longitudinal Strain of Canine and Porcine Aortas,” J. Biomech., 28(5), pp. 637–641. 10.1016/0021-9290(94)00091-H [DOI] [PubMed] [Google Scholar]
- [58]. Beller, C. J. , Labrosse, M. R. , Thubrikar, M. J. , and Robicsek, F. , 2004, “Role of Aortic Root Motion in the Pathogenesis of Aortic Dissection,” Circulation, 109(6), pp. 763–769. 10.1161/01.CIR.0000112569.27151.F7 [DOI] [PubMed] [Google Scholar]
- [59]. Jin, S. , Oshinski, J. , and Giddens, D. P. , 2003, “Effects of Wall Motion and Compliance on Flow Patterns in the Ascending Aorta,” ASME J. Biomech. Eng., 125(3), pp. 347–354. 10.1115/1.1574332 [DOI] [PubMed] [Google Scholar]
- [60]. Labrosse, M. R. , Gerson, E. R. , Veinot, J. P. , and Beller, C. J. , 2013, “Mechanical Characterization of Human Aortas From Pressurization Testing and a Paradigm Shift for Circumferential Residual Stress,” J. Mech. Behav. Biomed. Mater., 17, pp. 44–55. 10.1016/j.jmbbm.2012.08.004 [DOI] [PubMed] [Google Scholar]