

Abstract
Levels of pituitary growth hormone (GH), a metabolic homeostatic factor with strong lipolytic activity, are decreased in obese individuals. GH declines prior to the onset of weight gain in response to excess caloric intake and hyperinsulinemia; however, the mechanism by which GH is reduced is not clear. We used transgenic mice expressing the human GH (hGH) gene, GH1, to assess the effect of high caloric intake on expression as well as the local chromosome structure of the intact GH1 locus. Animals exposed to 3 days of high caloric intake exhibited hyperinsulinemia without hyperglycemia and a decrease in both hGH synthesis and secretion, but no difference in endogenous production of murine GH. Efficient GH1 expression requires a long-range intrachromosomal interaction between remote enhancer sequences and the proximal promoter region through “looping” of intervening chromatin. High caloric intake disrupted this interaction and decreased both histone H3/H4 hyperacetylation and RNA polymerase II occupancy at the GH1 promoter. Incorporation of physical activity muted the effects of excess caloric intake on insulin levels, GH1 promoter hyperacetylation, chromosomal architecture, and expression. These results indicate that energy homeostasis alters postnatal hGH synthesis through dynamic changes in the 3-dimensional chromatin structure of the GH1 locus, including structures required for cell type specificity during development.
Introduction
Growth hormone (GH) insufficiency is considered a typical feature of obesity, regardless of age and gender (1). This is in addition to a spectrum of other significant metabolic derangements, including changes in levels of and/or peripheral responsiveness to multiple endocrine factors, as defined by hyperinsulinemia, hyperleptinemia, hyperglycemia, and high levels of free fatty acids (2, 3). GH, a major metabolic homeostatic factor involved extensively in lipid metabolism, is implicated in adipose tissue remodeling to help maintain a healthy balance between energy intake and expenditure via its strong lipolytic activity (2–4). Obesity and its associated metabolic changes are brought on by excessive energy intake with insufficient energy expenditure over a prolonged period. This leads to a greater weight/height ratio, reflecting additional adipose tissue expansion (5). Notably, GH levels are extremely sensitive to increased caloric intake within the continuum of obesity progression. A recent study identified a 77% decrease in plasma GH levels in a group of healthy individuals aged 24 years who exhibited no significant weight gain during 3 days of overeating (6). Furthermore, GH levels continued to be suppressed in this group within 2 weeks of overeating, during which time the subjects gained significant weight (6). Thus, GH insufficiency appears to be a feature at all stages of obesity development. It was suggested that hyperinsulinemia likely mediates the rapid suppression of human GH (hGH) production observed at 3 days, which occurred independent of significant body weight changes (6). It was also suggested that the effect of excess insulin was to impair GH secretion; however, the data did not exclude a negative effect of overeating on GH synthesis by pituitary somatotrophs. An effect on synthesis might affect the data interpretation, specifically, the perceived effectiveness of GH secretagogues as antiobesity agents. Furthermore, the significance of somatotrophs as sensors with the ability to receive metabolic signals and respond to alterations in metabolic pathways has been suggested previously (7). Thus, we here sought to determine the effect of acute excess caloric intake (by high-fat diet [HFD] feeding) on the regulation of hGH synthesis as well as on hGH secretion by the pituitary.
Physical activity protects against obesity development by means of increased energy expenditure caused by the activity itself as well as by changes in endocrine factors that increase the resting metabolic rate (8, 9). More importantly, GH is a target for physical exercise; it is well known that a linear dose-response relationship exists between exercise intensity and the GH secretory pattern in healthy individuals (10–14). This is suggested to be an important factor because of the potent lipolytic effect of GH, which further increases energy expenditure and prevents obesity (15). Thus, prescribed physical activity (swimming) was also incorporated into our HFD treatment regimen to promote use of excess energy and better assess the overall effect on GH production.
Investigation of hGH synthesis under physiological and pathophysiological conditions, specifically at the level of gene expression versus secretion, is limited, due to limited access to human pituitary samples as well as distinct differences between the human (primate) GH1 and murine (nonprimate) Gh, including the flanking and coding DNA. For example, only 0.3 kb of rat Gh promoter and upstream DNA is required to direct efficient pituitary expression of a transgene in mice, compared with 14.5 kb of GH1 (16, 17). In terms of coding DNA, differences are reflected in the ability of primate GH to bind both GH and prolactin receptors, whereas murine GH (mGH) will bind only the GH receptor (18–20). As a result, hGH and mGH have the potential for different regulatory control and function (16–19, 21–23). We and others have previously generated transgenic mice that contain human GH1 under the control of a locus control region (LCR) (hGH/CS-TG mice; refs. 24, 25). The LCR can act as a tissue- and cell-specific enhancer, but importantly, it is also a novel eukaryotic genetic regulatory element sufficient to confer appropriate site of integration-independent gene expression, including that of a transgene (24–27). Consequently, multiple independent transgenic mouse lines with inclusion of the GH1 LCR demonstrated integration site–independent and pituitary expression of GH1 (24, 25). hGH/CS-TG mice express appropriate levels of GH, grow normally, and show no evidence of gigantism due to overproduction of “total” GH (16, 24, 25, 28–30). This is reflected in an unchanged number of somatotrophs in hGH/CS-TG versus WT mice (25), consistent with normal development of pituitary in the context of functional somatotrophs and with appropriate regulatory or feedback control of GH1 together with endogenous murine Gh. These transgenic mice have been maintained for more than 5 years and continue to express GH1 preferentially in pituitary somatotrophs under the control of the GH1 LCR, with no apparent change in the pattern of expression (16, 24, 25, 28, 29).
The GH1 LCR includes essential hypersensitive site (HS) regions I, II, III and V, located 14–32 kb upstream of the GH1 promoter (24). The GH1 LCR is critical for tissue- and cell-specific activation of the pituitary GH1 promoter during embryonic development (16, 31). This process is facilitated by histone H3 and H4 hyperacetylation of the gene locus, which is associated with a more “open” chromatin configuration (32) and is centered at HS I/II (27, 33), but tracks out to include HS V upstream and the GH1 promoter downstream (27). HS I/II possesses pituitary enhancer activity in vitro and in vivo and is the major determinant of efficient expression (34). This HS I/II enhancer activity is located in the upstream-flanking DNA of the adjacent CD79B gene, but exerts its effect on the GH1 promoter about 15 kb downstream via a long-range interaction involving “looping” of intervening chromatin between the 2 regions (35, 36). Formation of this “expression” loop, and resulting interaction between pituitary transcription factor PIT-1 binding sites at HS I/II and the promoter, is essential for GH1 activation during development (16, 36). Recent studies suggest that this interaction also continues to be important for efficient postnatal GH1 expression into adult life (37). Thus, the 3-dimensional chromosomal architecture, specifically, the presence of the expression loop, is a marker of efficient GH1 expression (16, 36) and can thus be used, together with relative H3/H4 hyperacetylation, as a functional endpoint.
In the present study, we found that acute excess caloric intake decreased hGH production after only 2 days of HFD challenge. A similar reduction in mGH was not detected. This rapid regulation of hGH occurred at the transcriptional level and involved changes in the 3-dimensional chromatin structure of the GH1 LCR and promoter regions, leading to decreased gene expression. However, these changes linked to overeating were effectively prevented by increased energy expenditure through prescribed physical activity.
Results
hGH synthesis and secretion are decreased within 3 days of HFD challenge.
To determine the effect of acute high caloric intake on hGH production, transgenic 171hGH/CS-TG mice (containing intact GH1 and the LCR in a 171-kb fragment of human chromosome 17; see Methods) were fed HFD or a control low-fat diet (LFD) beginning at 4 weeks of age. Mice were maintained on their respective diets until time of euthanasia and assay. At 1 day after introduction of diet, there was no detectable differences in the GH1 RNA levels of LFD- and HFD-fed mice, as assessed by quantitative RT-PCR (qPCR). Starting from day 2, however, there was a significant 75% reduction in GH1 transcript levels with HFD challenge (P < 0.001, n = 4–12; Figure 1A). This reduction remained low at day 3 and was still evident after 3 weeks of HFD feeding (P < 0.01, n = 6; Figure 1A). Serum hGH in HFD-fed mice was also reduced to 50% of the level in LFD-fed mice throughout the study period (3 days and 3 weeks), as assessed by ELISA (P < 0.01, n = 6–12; Figure 1B). Similar decreases in GH1 RNA (50%, P < 0.001, n = 4–6) and serum hGH (32%, P < 0.05, n = 4–5) were also observed in a second transgenic line, 141hGH/CS-TG (see Methods), in response to 3 days of HFD feeding (Figure 1, C and D).
Figure 1. Decreased human GH1 synthesis and hGH secretion within 3 days of HFD challenge.

(A) Total pituitary RNA from 171hGH/CS-TG mice fed HFD or LFD was assessed for GH1 RNA by qPCR. Results (mean ± SEM) are expressed relative to LFD (arbitrarily set to 100%). (B) Secreted hGH levels were also assessed by ELISA at 3 days and 3 weeks (mean ± SEM). (C and D) Effect of 3 days of HFD or LFD on GH1 RNA (C) and serum hGH (D), assessed as in A and B, in 141hGH/CS-TG mice. Significance was assessed by t test (n = 4–12 [A and B]; 4–5 [C and D]). *P < 0.05, **P < 0.01, ***P < 0.001.
mGH production is not affected by 3 days of HFD challenge.
There were no detectable differences in Gh RNA levels in mice fed LFD versus HFD for 3 days, as assessed by qPCR (Figure 2A). This lack of response was sustained in 171hGH/CS-TG mice even after 3 weeks of HFD feeding; a decreasing trend was observed, but this was not statistically significant. There was also no significant effect of HFD versus LFD on secreted mGH levels, as assessed by ELISA. Secreted mGH levels were reduced after 3 weeks of HFD feeding, but as with RNA levels, this did not reach statistical significance (Figure 2B). WT CD1 mice, like the 171hGH/CS-TG mice, exhibited no detectable differences in murine Gh RNA and serum mGH levels after 3 days of HFD versus LFD challenge, as assessed by qPCR and ELISA (Figure 2, C and D).
Figure 2. Murine Gh and mGH are not affected by 3 days of HFD feeding.

(A) Mouse pituitary Gh RNA in 171hGH/CS-TG mice fed HFD or LFD for 3 days or 3 weeks, as assessed by qPCR. Results (mean ± SEM) are expressed relative to LFD (arbitrarily set to 100%) (n = 4–12). (B) Serum mGH in 171hGH/CS-TG mice fed HFD or LFD for 3 days or 3 weeks, assessed by ELISA. Values are mean ± SEM. (C and D) Murine Gh RNA (C) and secreted mGH protein (D), assessed as in A and B, in WT CD1 mice at 3 days of diet (n = 6). Significance (HFD vs. LFD) was assessed at each independent time point by t test.
The HFD-induced reduction in hGH production is not associated with significant changes in hypothalamic factor/receptor gene expression at the pituitary level.
RNA levels of GH-releasing hormone (Ghrh) and the GH inhibitor somatostatin (Sst) in the hypothalamus, and of their respective receptors (Ghrhr and Sst1–Sst5) in the pituitary, were assessed in 171hGH/CS-TG mice fed LFD or HFD for 3 days. Overeating had no significant effect on Ghrh, Ghrhr, Sst, or Sst1–Sst5 RNA levels (Figure 3). HFD feeding suggested a decreasing trend for Ghrhr and GH secretagogues receptor (Ghsr) RNA levels, as well as an increase in Sst transcript levels; however, these did not reach statistical significance (n = 9–12 per group; Figure 3).
Figure 3. Overeating has no effect on RNA levels of Ghrh, Sst, or their respective receptors.

Total pituitary and hypothalamic RNA from 171hGH/CS-TG mice fed HFD or LFD, assessed by qPCR using specific and independent primer sets for mouse Ghrh, Sst, Ghrhr, Ghsr, and Sst1–Sst5 RNA. Results (mean ± SEM) are expressed relative to LFD (arbitrarily set to 100%). Significance was assessed by t test (n = 9–12).
HFD challenge for 3 days creates a state of excess C-peptide (insulin), but not hyperglycemia.
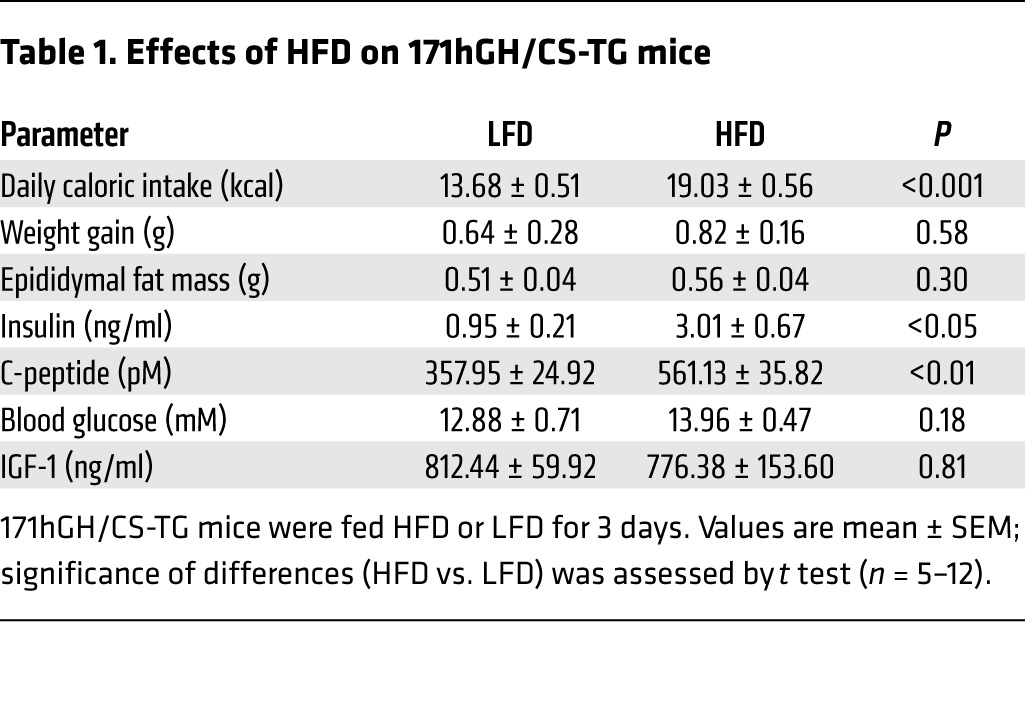
A significant 1.5-fold increase in caloric intake (P < 0.001, n = 12) was observed in 171hGH/CS-TG mice fed HFD for 3 days (Table 1). ELISA was used to determine serum levels of insulin as well as C-peptide, a surrogate marker for insulin secretion, and IGF-1. Blood glucose levels were measured with a glucometer, and changes in body and gonadal fat pad weight were assessed as a measure of adipose tissue expansion. HFD challenge for 3 days resulted in excess insulin and C-peptide, but neither hyperglycemia nor significant changes in body and gonadal fat pad weight (Table 1). In addition, comparable levels of serum IGF-1 were detected in 171hGH/CS-TG and WT CD1 mice (812 ± 60 and 821 ± 75 ng/ml, respectively; n = 6), and there was also no significant effect on these levels after 3 days of HFD feeding (Table 1).
Table 1.
Effects of HFD on 171hGH/CS-TG mice
HFD-induced GH1 RNA reduction is consistent with an increased association of NCOR with the proximal GH1 promoter region.
Elevated insulin has been linked to transcriptional repression of GH1 (30). Nuclear corepressor factor (NCOR) is a transcriptional corepressor that has been implicated in repression of many genes, including GH1, in pituitary lactotrophs (38–41). HFD challenge resulted in a 4-fold increase in association of NCOR with the human GH1 promoter region in the pituitary, as assessed by ChIP assay (P < 0.01, n = 3; Figure 4A). Conversely, there was no significant effect of HFD on NCOR interaction with the murine Gh promoter region (Figure 4B).
Figure 4. Increased association of NCOR with the human GH1 promoter region, but not the murine Gh promoter region, in response to 3 days of HFD.

Pituitary chromatin from 171hGH/CS-TG mice fed HFD or LFD for 3 days was assessed by ChIP-qPCR using anti-NCOR antibody. Binding events were calculated based on signals obtained from the immunoprecipitated/input DNA amplification, using specific PCR primers for the (A) human GH1 and (B) murine Gh promoter regions as well as a control untranscribed region of mouse chromosome 6 (Untr6). Results (mean ± SEM) are expressed relative to LFD group Untr6 value (arbitrarily set to 1). Significance was assessed by 1-way ANOVA with Bonferroni post-test (n = 3). ***P < 0.001.
HFD challenge disrupts the chromosomal architecture involving the GH1 LCR and proximal GH1 promoter region.
The relative level of histone H3/H4 hyperacetylation across the GH1 LCR and promoter in pituitary tissue from 171hGH/CS-TG mice fed LFD or HFD was assessed by ChIP assay combined with qPCR (ChIP-qPCR). HFD challenge caused a modest decrease in H3/H4 hyperacetylation in the HS III fragment and significant reductions in the HS I/II and proximal GH1 promoter region fragments, whereas no difference was observed for HS V (Figure 5).
Figure 5. Histone H3/H4 hyperacetylation is reduced by excess caloric intake at the HS I/II and GH1 promoter regions.

Relative levels of hyperacetylated (HAc) histone H3 and H4 in pituitary chromatin from HFD- or LFD-fed 171hGH/CS-TG mice, assessed by ChIP-qPCR. Input and immunoprecipitated (bound) chromatin fractions were assessed using specific PCR primer sets for upstream HS V, HS III, HS I/II, and proximal (–0.5 kb) GH1 promoter regions. Results are expressed relative to LFD group HS V value (arbitrarily set to 1). Significance was assessed by 1-way ANOVA with Bonferroni post-test (n = 6). **P < 0.01, ***P < 0.001.
The effect of 3 days of HFD versus LFD on chromosomal structure and expression loop integrity in the pituitaries of 171hGH/CS-TG mice was assessed by quantitative chromosome conformation capture (3C) assay (Figure 6A). Cross-linked GH1 locus chromatin was digested with Bgl II restriction enzyme and ligated, and the ligation frequency between the HS I/II and GH1 promoter region fragments was assessed using specific primers to amplify the ligated product by qPCR (Figure 6B). There was no detectable ligated product — which would represent combined fragments containing HS I/II and GH1 promoter regions — in the no-ligase control of digested chromatin (Figure 6C). HFD-fed 171hGH/CS-TG mice exhibited significant 75% expression loop reduction (i.e., ligation frequency of the HS I/II and GH1 promoter fragment) in the pituitary (P < 0.001, n = 6; Figure 6D). The 3C assay was also performed on heart tissue from the same mice, which confirmed that expression loop formation was specific to the pituitary (Figure 6E).
Figure 6. Disruption of the HS I/II–GH1 promoter region interaction by excess caloric intake.

(A) 3C assay: crosslinking of the interacting chromatin with formaldehyde, digestion of DNA by an appropriate restriction enzyme, and ligation of digested cross-linked chromatin fragments that can be quantified by qPCR. (B) Effect of HFD versus LFD on long-range chromatin-chromatin interactions that permit efficient expression of pituitary GH1 in vivo. The map of Bgl II restriction fragments and positions of primers (arrows) used to determine and quantify the ligated products representing HS I/II and GH1 promoter physical interaction are shown below the locus. (C) Detection of combined Bgl II fragments resulting from physical interaction between HS I/II and the GH1 promoter in the presence or absence of ligase, assessed by PCR and agarose gel electrophoresis. (D and E) HS I/II–GH1 promoter association in (D) pituitary and (E) heart tissue from 171hGH/CS-TG mice fed HFD versus LFD for 3 days. Ligation frequency was calculated as (ligation product/loading control) – (nonligation product/loading control). Results (mean ± SEM) were obtained from 3 independent samples (in duplicate). Significance was assessed by t test (n = 6). ***P < 0.001.
Prescribed physical activity blocks the repressive effect of HFD challenge on hGH production.
We next assessed the effect of incorporating prescribed physical activity into the acute (3-day) HFD and LFD feeding regimen. Addition of 50 minutes of swimming daily muted the HFD-mediated decrease in GH1 RNA and serum hGH protein levels observed in 171hGH/CS-TG and 141hGH/CS-TG mice, as assessed by qPCR and ELISA (Figure 7, A and B). However, although caloric intake differed significantly between the LFD and HFD groups with physical activity, there was no significant difference for HFD-fed mice with and without physical activity (Figure 8A and data not shown). Introduction of physical activity reduced body weight in both LFD- and HFD-fed 171hGH/CS-TG mice; however, there was no significant difference between the LFD and HFD groups (Figure 8B). In spite of high caloric intake, addition of swimming substantially muted the effect of 3-day HFD challenge on C-peptide levels (Figure 8C). There was no significant difference in IGF-1 level between HFD- and LFD-fed mice with addition of swimming, as assessed by ELISA (Figure 8D). These changes were not associated with glycemic levels, as there was no difference between blood glucose levels in LFD- and HFD-fed mice that received the same physical activity regimen (Figure 8E).
Figure 7. Prescribed physical activity blocks the repressive effect of excess caloric intake on human GH1 synthesis and hGH secretion.

Assessment of GH1 RNA and serum hGH protein levels in (A) 171hGH/CS-TG and (B) 141hGH/CS-TG mice fed HFD or LFD for 3 days, with incorporation of physical activity. Results (mean ± SEM) are expressed relative to LFD (arbitrarily set to 100%). Significance was assessed by t test (n = 4–10).
Figure 8. Prescribed physical activity prevents the hyperinsulinemic state associated with excess caloric intake.

Assessment of (A) daily caloric intake, (B) body weight change, (C) serum C-peptide, (D) serum IGF-1, and (E) blood glucose in 171hGH/CS-TG mice fed HFD or LFD for 3 days, with incorporation of physical activity. Results are mean ± SEM. Significance was assessed by t test (n = 4–10). ***P < 0.001.
Physical activity preserves histone H3/H4 hyperacetylation pattern and expression loop integrity in the GH1 locus.
The effect of incorporating daily physical activity in the 3-day HFD feeding regimen on histone H3/H4 hyperacetylation of the GH1 LCR and proximal promoter region was examined by ChIP-qPCR. The significant HFD-induced reduction in H3/H4 hyperacetylation we found at both HS I/II and GH1 promoter regions (Figure 5) was not observed with addition of physical activity (Figure 9, A and B). Furthermore, inclusion of swimming in the treatment regimen significantly muted the effect of short-term overeating on the expression loop, as detected by 3C assay (Figure 9C), consistent with maintenance of an intact chromatin-chromatin interaction between HS I/II and GH1 promoter regulatory regions.
Figure 9. Physical activity effectively preserves the histone H3/H4 hyperacetylation pattern of the GH1 locus and integrity of the expression loop.

ChIP detection of histone H3/H4 hyperacetylation (HAc) at (A) HS I/II and (B) GH1 promoter regions in pituitary chromatin from 171hGH/CS-TG mice fed HFD or LFD for 3 days, with addition of physical activity. Results are expressed relative to LFD value (arbitrarily set to 1). (C) HS I/II–GH1 promoter association in the pituitary. Ligation frequency was calculated as (ligation product/loading control) – (nonligation product/loading control). Results (mean ± SEM) were obtained from 3 independent samples (in duplicate). Significance was assessed by t test (n = 6). *P < 0.05.
Addition of prescribed physical activity blunts the HFD-related reduction in RNA polymerase II interaction with the GH1 promoter.
RNA polymerase (pol) II interaction with the GH1 promoter region was examined as an indication of corresponding changes in promoter accessibility and potential activity (42). Chromatin isolated from the pituitaries of 171hGH/CS-TG mice fed HFD or LFD for 3 days with and without prescribed physical activity was assessed by ChIP-qPCR. Specific antibodies against RNA pol II as well as RNA pol II with phosphorylated serine 5 at the C-terminal domain of the large subunit (Ser5-pRNA pol II) were used (the latter is associated with polymerase that is more readily detected at the transcription start site and primed for transcriptional elongation; refs. 43, 44). Short-term excess caloric intake significantly reduced the associations of RNA pol II and Ser5-pRNA pol II with the GH1 promoter in HFD-fed versus LFD-fed mice (P < 0.05, n = 3–6; Figure 10, A and B). These reductions in RNA pol II association were blunted when swimming was added to the treatment regimen (Figure 10, C and D).
Figure 10. The HFD-induced reduction of RNA pol II–GH1 promoter association is blunted by addition of physical activity.

ChIP assay of (A and C) RNA pol II and (B and D) Ser5-pRNA pol II, as indicators of the transcription complex at the GH1 promoter and transcriptional initiation/elongation, in 171hGH/CS-TG mice fed HFD or LFD for 3 days, without (A and B) or with (C and D) incorporation of physical activity (swimming). Binding events were calculated by qPCR based on signals obtained from the immunoprecipitated/input DNA amplification, using specific primers for the GH1 promoter and Untr6 control. Results (mean ± SEM) are expressed relative to LFD group Untr6 value (arbitrarily set to 1). Significance was assessed by 1-way ANOVA with Bonferroni post-test (n = 3–6). *P < 0.05, **P < 0.01.
Discussion
Sequence differences between primate GH1 and nonprimate Gh raise the possibility of distinct regulatory control of expression. We used transgenic mice containing the intact GH1 locus from human chromosome 17 to study the effects of excess caloric intake and physical activity on local chromosomal organization, and its specific relationship to efficient GH1 expression via reorganization in response to environmental influence. A significant decrease in GH1 RNA and secreted hGH protein levels was observed in transgenic 171hGH/CS-TG mice after 3 days of HFD challenge. Conversely, there was no significant effect on murine Gh and mGH levels in the same mice. These key observations were confirmed in a second independent transgenic mouse line, 141hGH/CS-TG, and in WT CD1 mice. In addition, we demonstrated that postnatal hGH synthesis is regulated at the transcriptional level via changes in 3-dimensional structure of the GH1 locus in terminally differentiated pituitary cells in vivo in response to both diet and physical activity. This reorganization involves histone modifications and loss of integrity of a chromatin loop that brings GH1 enhancer and promoter regions into close proximity. This interaction is essential for initial activation of the GH1 locus during somatotroph development (28, 36, 37).
Our findings indicate that hGH production is extremely sensitive to increased caloric intake within the continuum of obesity progression. Impaired spontaneous secretion of hGH and declined somatotroph responsiveness to all known pharmacological provocative stimuli in obese humans has been previously reported (1, 45–48). This suppression of hGH can occur as a result of impaired GH secretagogue signaling at the level of the somatotroph; however, it can also be explained in terms of decreased hGH synthesis and insufficient reserves for secretion in response to treatment with the GH secretagogue. Our data are consistent with the latter, and a negative effect of 3 days of HFD on hGH production. The lack of a significant effect on hypothalamic Ghrh and Sst transcripts and those of their respective pituitary receptors further supports a direct effect of overeating on hGH synthesis. Thus, it is possible that 3 days of HFD feeding does not markedly impair GH secretagogue signaling in the mouse pituitary.
In response to HFD feeding, hGH/CS-TG mice exhibited higher levels of circulatory insulin and its surrogate marker, C-peptide, without a significant effect on circulating IGF-1 levels, in conjunction with reduced hGH levels. This is consistent with a previous report in which healthy individuals who overate for 3 days displayed profound hyperinsulinemia and no significant change in levels of IGF-1 (one of the main regulators of GH production via negative feedback). Thus, it was suggested that the hyperinsulinemic condition associated with overeating is the potential mediator of the decrease in plasma hGH levels (6). Our present data suggest that the effect on plasma hGH levels is exerted at the level of synthesis. We showed previously that GH1 is regulated by insulin directly at the level of the somatotroph: a significant, dose-dependent decrease in GH1 transcript level was detected in primary pituitary cell cultures from hGH/CS-TG mice with insulin treatment (30). Moreover, elevated GH levels were detected upon somatotroph-specific loss of insulin receptors in a mouse model in vivo (49). These observations are consistent with a role for pituitary somatotrophs as the primary sensors of circulating insulin, which could determine GH output under conditions of elevated serum insulin, as with overeating and the HFD.
Unlike the human GH1, endogenous murine Gh displayed no negative response to the hyperinsulinemic conditions induced by acute excess caloric intake in hGH/CS-TG and WT CD1 mice in vivo. However, we previously determined that a higher dose of insulin was required to see a significant reduction in murine Gh versus GH1 gene expression in isolated primary pituitary cell cultures from hGH/CS-TG mice (30). Consequently, a longer duration of exposure to excess insulin might be required in order to decrease murine Gh RNA levels, but while a decreasing trend was detected after 3 weeks of HFD challenge, this did not reach statistical significance. A possible explanation for the differential response is the presence of an enhancer box (E-box) with the consensus sequence 5′-CACGTG-3′ at its core in the proximal GH1 promoter region that is absent from equivalent murine Gh promoter DNA (30). Importantly, we previously demonstrated that pharmacological inhibition of transcription factor binding to the E-box using echinomycin (which targets the 5′-CGTG-3′ sequence) blunted the negative effect of insulin on GH1 expression, but not Gh expression, in isolated pituitary cells from hGH/CS-TG mice (30). This suggests a potential role for one or more E-box binding factors in regulating the GH1 promoter in response to excess caloric intake in vivo. Our present data also implicated induction and recruitment of the transcriptional corepressor NCOR as part of the promoter complex in the decreased GH1 expression observed. The failure to detect a similarly increased association of NCOR with the murine Gh promoter is consistent with the lack of negative response to excess caloric intake. NCOR is known to interact with the pituitary transcription factor PIT-1 (40, 41). PIT-1 binds to sequences in HS I/II within the GH1 LCR as well as the proximal GH1 promoter region and is essential for activation of the GH1 locus during somatotroph development and for ongoing efficient postnatal expression (28, 34, 35, 37). An interaction between NCOR and PIT-1 was previously suggested as the mechanism by which GH1 is silenced in PIT-1–producing lactotrophs during embryonic differentiation of the anterior pituitary (40, 41). Our current observations suggest that NCOR may also act as a corepressor in the postnatal dynamic and the transient transcriptional suppression of GH1 in somatotrophs.
Histone H3/H4 hyperacetylation is often associated with a more open and active chromatin conformation, and thus considered permissive for gene expression; in contrast, deacetylation facilitates gene suppression (50). Involvement of NCOR would implicate class I histone deacetylases as possible mediators of transcriptional repression of GH1 (38, 51). Deacetylase inhibitors, such as trichostatin A (TSA), can effectively block NCOR-mediated transcriptional repression (52). In this context, treatment of primary pituitary cells from hGH/CS-TG mice with TSA muted the insulin-dependent decrease in GH1 RNA levels (30). Our data are also consistent with a substantial effect of altered energy homeostasis on histone H3/H4 hyperacetylation in the GH1 LCR. The pituitary-specific pattern of hyperacetylation for the active GH1 locus extends over 32 kb from HS V upstream to the GH1 promoter downstream, peaking at HS I/II (16, 30, 37). Reductions in H3/H4 hyperacetylation were observed at HS I/II and the GH1 promoter with excess caloric intake, and a decrease was also suggested at HS III (albeit not significant). These regulatory regions, HS I–HS V and the GH1 promoter, although distant from each other, are implicated in the initial activation of the GH1 locus during development as well as in maintaining appropriate hGH expression after birth under normal physiological conditions (16, 33, 35, 53, 54). Efficient RNA pol II recruitment and GH1 promoter activity requires HS I/II and GH1 promoter regions to be brought into close spatial proximity with each other via formation of an expression loop involving ~14–15 kb of intervening chromatin (31, 37). Physical interaction appears to be facilitated by hyperacetylation of these regions (37). Thus, as expected, the decrease in GH1 expression with excess caloric intake correlated with decreased detection of the expression loop (i.e., HS I/II–GH1 promoter interaction), as well as with significantly reduced interaction of RNA pol II with the proximal GH1 promoter region. These data support an important role for HS I/II in activation of the GH1 promoter, but also suggest that these regions are targets for physiological influence that can regulate hGH synthesis after birth.
The secretory response of GH to physical activity is markedly reduced in obese individuals (55). Additionally, studies with human subjects and mice suggest that exercise can suppress insulin secretion, and, more importantly, can improve responses to the excess levels of insulin associated with overeating in healthy subjects (56–59). Thus, if the decrease in GH1 expression reflects the ability of somatotrophs to act as a metabolic sensor (7), specifically to the hyperinsulinemic state, prescribed physical activity is predicted to mitigate against this decrease. Consistent with this interpretation, incorporation of swimming into the diet regimen muted the negative effect of excess caloric intake on chromatin configuration of the GH1 locus, RNA pol II and GH1 promoter association, and, consequently, overall GH1 RNA and hGH levels.
To our knowledge, this is the first report providing in vivo evidence of rapid and dynamic change in specific chromatin-chromatin physical interactions in response to physiological influences, such as excess caloric intake and physical activity. Our data indicate that the GH1 locus is subject to structural changes that can accommodate homeostatic and/or adaptive transcriptional responses to energy homeostasis. The present observations support a fluid structure for cell type– or tissue type–specific chromosomal architecture involved in the activation of a gene locus, which can be accessed and subjected to postnatal transcriptional control. However, our findings do suggest that diet and physical activity can influence events that are crucial for normal embryonic development, specifically those involved in somatotroph development and activation of the GH1 locus. This may have implications for transgenerational epigenetic effects on offspring gene locus activation as well as regulation in utero.
Methods
Animals and diet.
Transgenic CD1 mice containing the intact human GH1 gene and LCR in a 171-kb fragment (171hGH/CS-TG mice) or a 141-kb fragment (141hGH/CS-TG mice) of human chromosome 17 (24), as reported previously (25), were used in this study. WT CD1 mice were also used to assess mGH and as nontransgenic/non-hGH-producing controls. Animals were individually housed with ad libitum access to food and water in an environmentally controlled room maintained on a 12-hour light/12-hour dark cycle. LFD control (10% kcal from fat; 70% kcal from carbohydrate; 20% kcal from protein; Research Diets) or HFD (60% kcal from fat; 20% kcal from carbohydrate; 20% kcal from protein; Research Diets) was supplied as palatable pellets for 3 days or 3 weeks to male mice starting at 4 weeks of age (25, 30). Body weights were recorded prior to and daily during the diet intervention. Daily food and energy intake was estimated by weighing remaining food at the end of each day/week and calculating the average. Mice were maintained on their respective diets until time of euthanasia and assay.
Swimming protocol.
The swimming protocol was as reported previously (60), with minor modifications. 4-week-old male 171hGH/CS-TG mice fed standard diet were acclimatized initially in a water bath (50 × 30 × 20 cm; 6 mice per bath) filled with fresh water (34°C–37°C) for increasing intervals (increments of 10 minutes) over 5 days with continuous monitoring, then allowed to rest for 2 days prior to study. Mice then swam twice daily for 50 total minutes (2 sessions of 25 minutes) for 3 days while on LFD or HFD challenge. Mice were weighed daily, and their daily calorie intake was also measured throughout the study.
Blood chemistry.
Trunk blood was collected and allowed to clot at 4°C for 15 minutes, and serum was separated by centrifugation (9,300 g for 5 minutes). Serum samples were stored at –80°C until assessed by ELISA (hGH, 22-HGHHUU-E01, ALPCO; mGH, EZRMGH-45K, Millipore; mouse insulin, mouse/rat insulin ELISA, EZRMI-13K, Millipore; mouse C-peptide, mouse/rat C-peptide ELISA, EZRMCP2, Millipore; mouse IGF-1, MG200, R&D Systems). Blood glucose was measured by a handheld glucometer (OneTouch Ultramini, Lifescan Inc.). The specificity of the hGH ELISA kit was confirmed using WT CD1 serum as a negative control; data obtained were comparable to the blank control, and thus hGH in WT CD1 mice was considered not detectable. Cross-reactivity of hGH and mGH using the mGH ELISA kit from Millipore (EZRMGH-45K) is reported by the manufacturer as not detected.
Detection of RNA by qPCR.
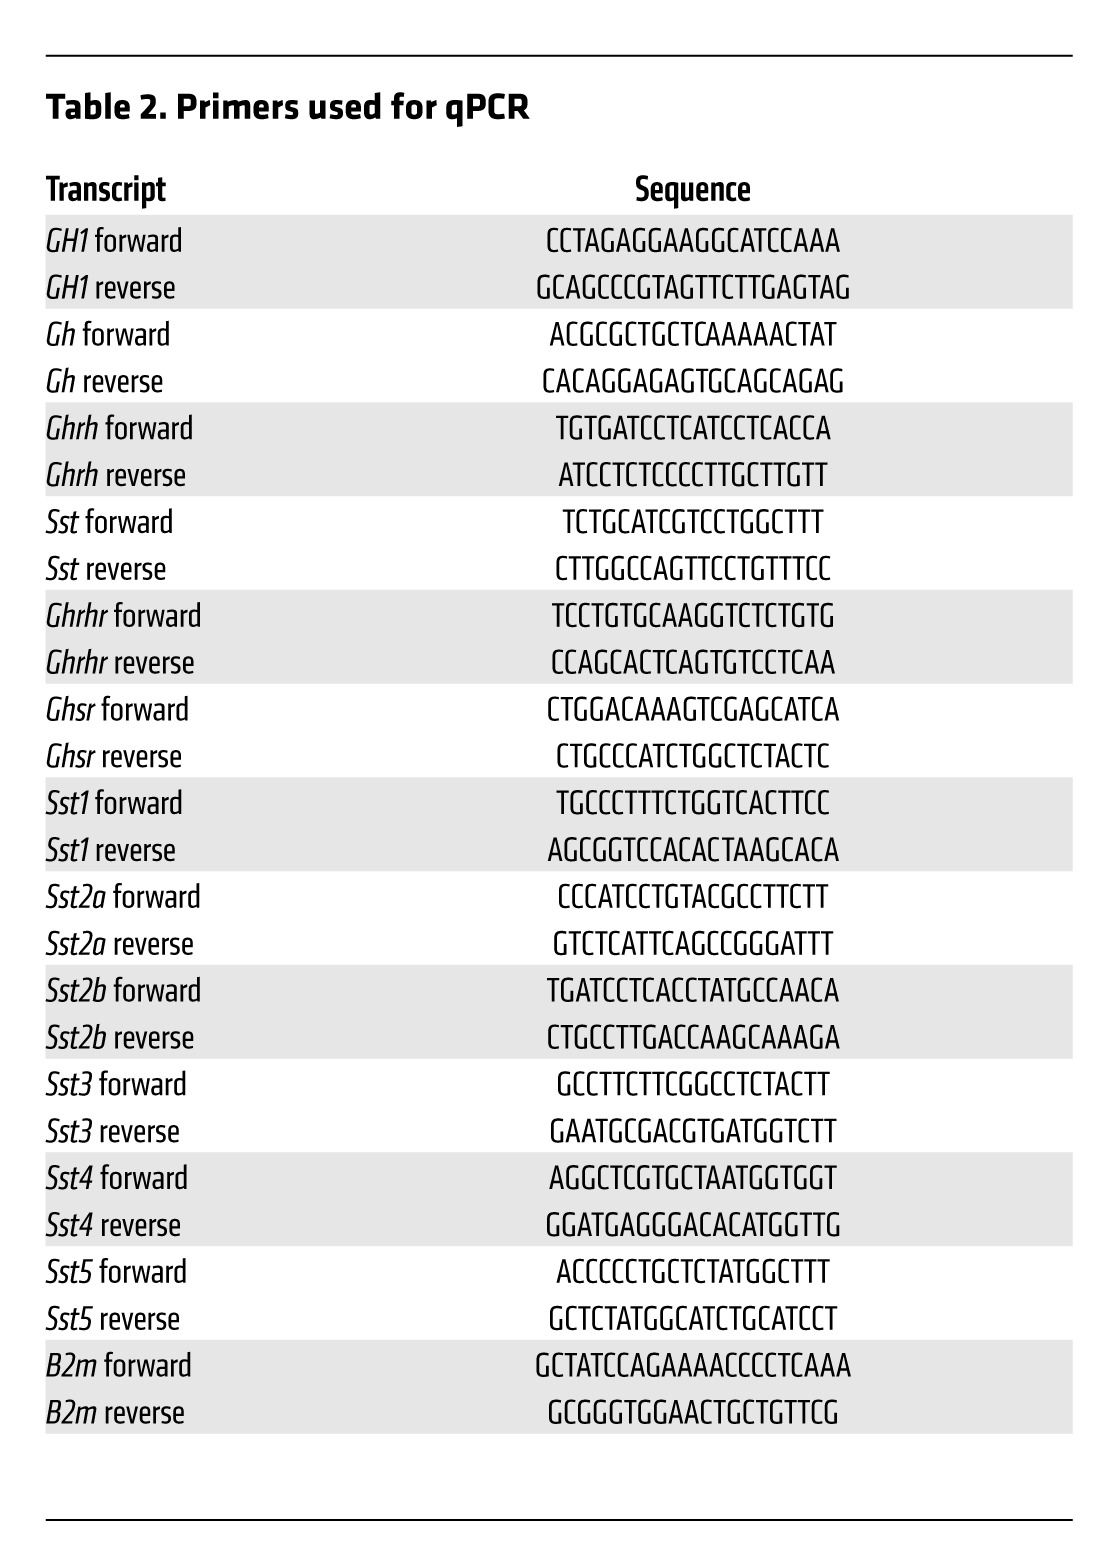
Anterior pituitary and hypothalamus (periventricular and arcuate nuclei) tissues were collected immediately after euthanasia, and total RNA was extracted from flash-frozen tissues using the RNeasy Plus Mini Kit (Qiagen). 1 μg total RNA was reverse transcribed by the QuantiTect Reverse Transcription Kit (Qiagen), according to the manufacturer’s instructions, and qPCR was done as described previously (25) using specific primers (Table 2). Gene expression level in each sample (absolute quantification) was calculated from a standard curve and normalized to mouse β2-microglobulin (B2m) expression as appropriate. Unless otherwise indicated, tests were run in duplicate on at least 6 independent samples.
Table 2.
Primers used for qPCR
ChIP assay.
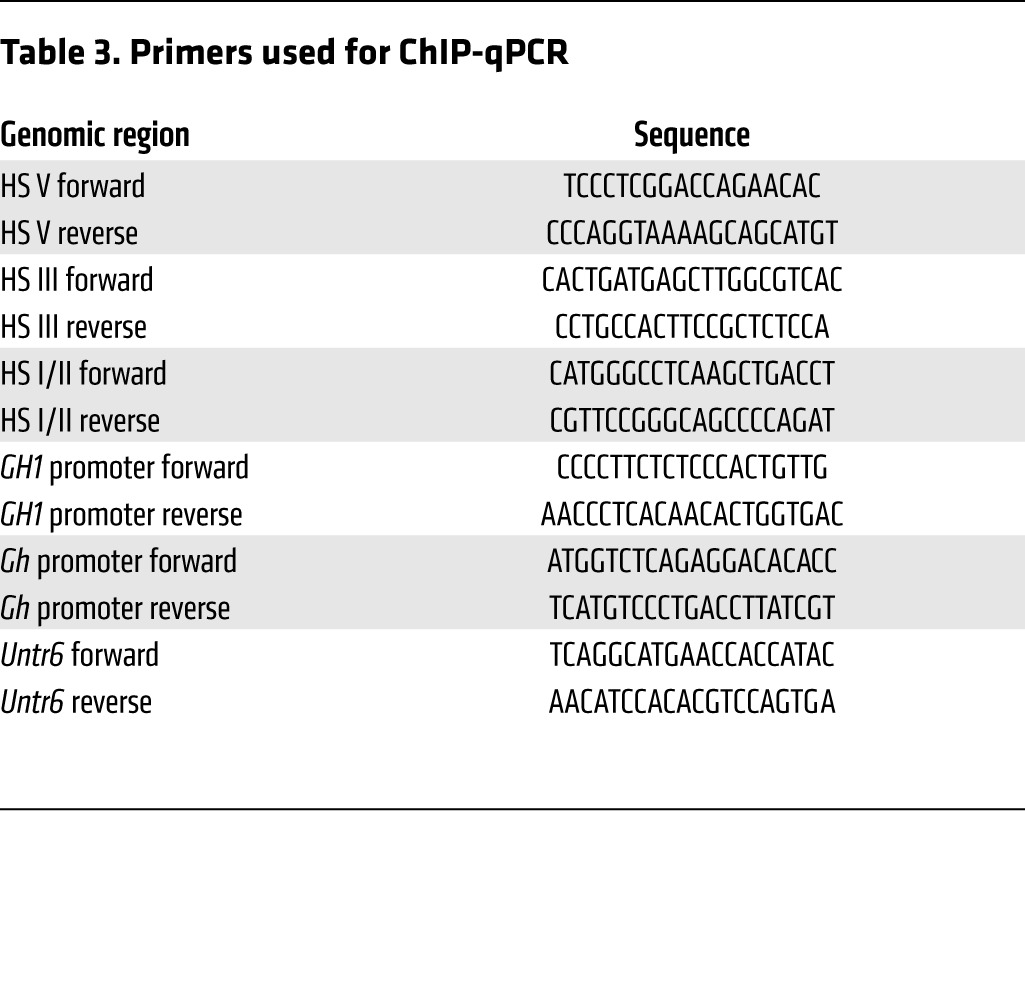
ChIP assay was done with isolated mouse anterior pituitaries using EZ-Magna ChIP kit (catalog no. 17-10086, Millipore) according to the manufacturer’s instructions. In brief, pituitaries were cross-linked with 1% of formaldehyde at room temperature for 30 minutes before lysis. Chromatin was fragmented by sonication 100 seconds in 10-second pulses and 40% amplitude. Soluble chromatin was immunoprecipitated with 5 μg of specific antibodies (hyperacetylated Histone H3, catalog no. 06-599, Upstate Biotechnology; hyperacetylated Histone H4, catalog no. 05-998, Upstate Biotechnology; total RNA pol II, catalog no. sc-899, Santa Cruz; Ser5-pRNA pol II, catalog no. MMS-134R, Covance; NCOR, catalog no. PA1-844A, Thermo Scientific) along with magnetic protein (A/G) beads overnight with rotation at 4°C. The eluted chromatin separated from magnetic beads was reverse cross-linked at 65°C overnight, and DNA was isolated using the QIAquick PCR purification kit (Qiagen). qPCR was performed in a 7500 Fast Real Time PCR system (Applied Biosystems) under conditions standardized for each primer set (Table 3). Each qPCR reaction was done in duplicate in a 20-μl reaction volume with 5 μl 1% input DNA, 5 μl preamplified (15 cycles) eluted immunoprecipitated DNA, and 10 μl Power SYBR green Master mix (Applied Biosystems). Each primer set’s efficiency was corrected using standard curves generated for each genomic area assessed. Dissociation curves were analyzed as a means to ensure the quality of amplicons and to monitor primer dimers. Final PCR products were visualized as a single band in an agarose gel. ChIP enrichment was determined based on a percent input method, as previously reported (30, 61).
Table 3.
Primers used for ChIP-qPCR
3C assay.
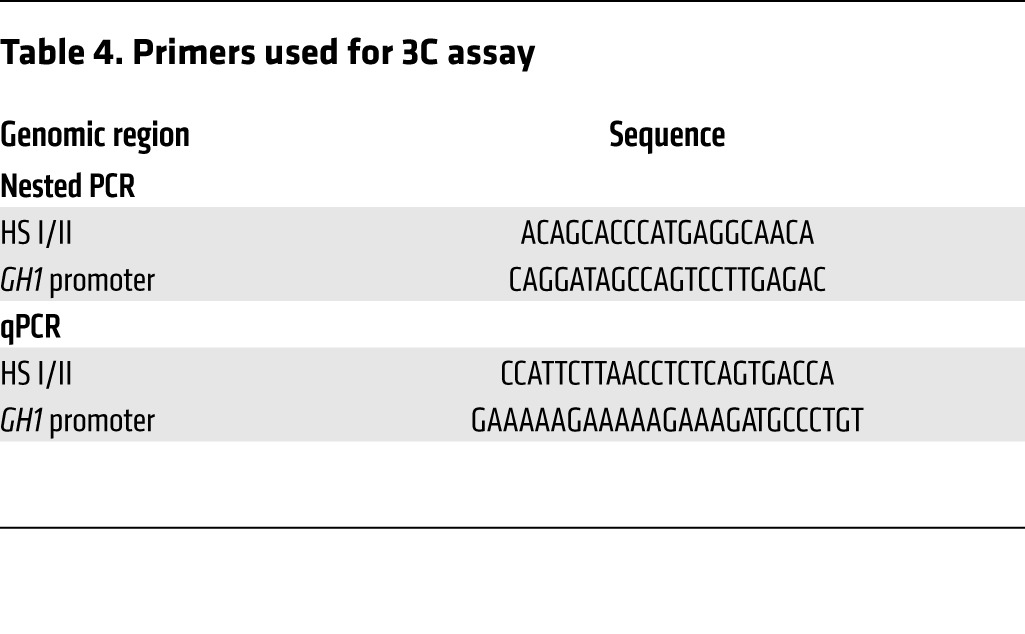
The 3C assay was performed essentially as described previously (62, 63). Briefly, mouse pituitaries were homogenized in a tissue nuclei isolation buffer (10 mM HEPES, 10 mM KCl, 1.5 mM MgCl2, 1 mM PMSF, 0.1% NP-40) supplemented with complete protease inhibitors (Thermo Scientific) to obtain a single-cell suspension. The cells were cross-linked for 10 minutes at room temperature using 1% formaldehyde-HEPES buffer, and the reaction was quenched by addition of glycine (final concentration, 0.125 M). Cells were washed with PBS and lysed in 1 ml ice-cold lysis buffer (10 mM Tris-Cl pH 8.0, 10 mM NaCl, 0.2% NP-40) supplemented with complete protease inhibitors (Thermo Scientific). Isolated nuclei were washed with NEB buffer 3 (50 mM Tris-HCl pH 7.9, 10 mM MgCl2, 100 mM NaCl, 1 mM DTT; New England BioLabs), resuspended in 120 μl NEB buffer 3 containing 0.1% SDS, and incubated for 30 minutes at 37°C with shaking. Triton X-100 was added (1% final), and nuclei were further incubated for 30 minutes at 37°C. Cross-linked DNA was then digested overnight with the restriction enzyme Bgl II (500 U) in a total volume of 200 μl. Selection of Bgl II for the 3C assay was based on appropriately located restriction sites in the vicinity of chosen DNA targets. An aliquot of DNA was collected before and after digestion to determine digestion efficiency. The restriction enzyme was inactivated by addition of SDS (1% final) and incubation at 65°C for 20 minutes. 2 μg digested chromatin was diluted in a final volume of 0.8 ml ligation buffer containing 1% Triton-X. Ligation reaction was carried out at 16°C for 4 hours and followed by incubation at room temperature for a further 30 minutes in the presence of 4,000 U T4 DNA ligase (New England BioLabs). A no-ligation control (without addition of T4 DNA ligase) was set up under identical conditions. Reverse cross-linking of ligated DNA was carried out overnight at 65°C in the presence of proteinase K (final concentration, 10 ng/ml). The following day, samples were incubated for 30 minutes at 37°C with RNase A (10 ng/ml) followed by purification of DNA using phenol/chloroform extraction and ethanol precipitation. DNA concentration was determined using a Nanodrop spectrophotometer (Thermo Scientific). Nested primers were used with 2 rounds of PCR to increase sensitivity, followed by qPCR using a primer set that encompassed the Bgl II restriction cut site (Table 4), using the Power SYBR PCR Kit (Applied Biosystems) and the following conditions: initial denaturation for 5 minutes at 95°C, followed by 30 cycles of 95°C for 15 seconds, 60°C for 15 seconds, and 72°C for 30 seconds. Results were normalized with amplified GAPDH of digested and undigested samples. Digestion efficiency for each sample was >84%. Interaction between HS I/II and the GH1 promoter was assessed by determining the ligation frequency, calculated as (ligation product/loading control) – (nonligation product/loading control).
Table 4.
Primers used for 3C assay
Statistics.
Statistical analysis was performed using GraphPad Prism software. For single comparisons, paired 2-tailed t tests were applied; for multiple comparisons, 1-way ANOVA and Bonferroni post-test was used. A P value less than 0.05 was considered statistically significant.
Study approval.
All procedures involving animals and their tissues and cells conformed to the NIH Guide for the Care and Use of Laboratory Animals (NIH Publication, 8th Edition. Revised 2011) and were approved by the Animal Protocol Management and Review Committee at the University of Manitoba.
Acknowledgments
This work was supported by a grant from the Canadian Institutes of Health Research (CIHR; MT-10853). H. Vakili is the recipient of a CIHR Frederick Banting and Charles Best Canada Graduate Scholarship.
Footnotes
Conflict of interest: The authors have declared that no conflict of interest exists.
Reference information:J Clin Invest. 2014;124(11):5002–5012. doi:10.1172/JCI77126.
References
- 1.Vanderschueren-Lodeweyckx M. The effect of simple obesity on growth and growth hormone. Horm Res. 1993;40(1–3):23–30. doi: 10.1159/000183763. [DOI] [PubMed] [Google Scholar]
- 2.Pataky Z, Bobbioni-Harsch E, Golay A. Obesity: a complex growing challenge. Exp Clin Endocrinol Diabetes. 2010;118(7):427–433. doi: 10.1055/s-0029-1233448. [DOI] [PubMed] [Google Scholar]
- 3.De Marinis L, et al. Growth hormone secretion and leptin in morbid obesity before and after biliopancreatic diversion: relationships with insulin and body composition. J Clin Endocrinol Metab. 2004;89(1):174–180. doi: 10.1210/jc.2002-021308. [DOI] [PubMed] [Google Scholar]
- 4.Yang S, Mulder H, Holm C, Eden S. Effects of growth hormone on the function of beta-adrenoceptor subtypes in rat adipocytes. Obes Res. 2004;12(2):330–339. doi: 10.1038/oby.2004.41. [DOI] [PubMed] [Google Scholar]
- 5.Frayn KN. Obesity and metabolic disease: is adipose tissue the culprit? Proc Nutr Soc. 2005;64(1):7–13. doi: 10.1079/PNS2004403. [DOI] [PubMed] [Google Scholar]
- 6.Cornford AS, Barkan AL, Horowitz JF. Rapid suppression of growth hormone concentration by overeating: potential mediation by hyperinsulinemia. J Clin Endocrinol Metab. 2011;96(3):824–830. doi: 10.1210/jc.2010-1895. [DOI] [PMC free article] [PubMed] [Google Scholar]
- 7.Childs GV, et al. The somatotrope as a metabolic sensor: deletion of leptin receptors causes obesity. Endocrinology. 2011;152(1):69–81. doi: 10.1210/en.2010-0498. [DOI] [PMC free article] [PubMed] [Google Scholar]
- 8.Poehlman ET. A review: exercise and its influence on resting energy metabolism in man. Med Sci Sports Exerc. 1989;21(5):515–525. [PubMed] [Google Scholar]
- 9.Goran MI, Reynolds KD, Lindquist CH. Role of physical activity in the prevention of obesity in children. Int J Obes Relat Metab Disord. 1999;23(suppl 3):S18–S33. doi: 10.1038/sj.ijo.0800880. [DOI] [PubMed] [Google Scholar]
- 10.Pritzlaff CJ, et al. Catecholamine release, growth hormone secretion, and energy expenditure during exercise vs. recovery in men. J Appl Physiol. 2000;89(3):937–946. doi: 10.1152/jappl.2000.89.3.937. [DOI] [PubMed] [Google Scholar]
- 11.Rogol AD, Weltman JY, Evans WS, Veldhuis JD, Weltman AL. Long-term endurance training alters the hypothalamic-pituitary axes for gonadotropins and growth hormone. Endocrinol Metab Clin North Am. 1992;21(4):817–832. [PubMed] [Google Scholar]
- 12.Weltman A, Weltman JY, Schurrer R, Evans WS, Veldhuis JD, Rogol AD. Endurance training amplifies the pulsatile release of growth hormone: effects of training intensity. J Appl Physiol. 1992;72(6):2188–2196. doi: 10.1152/jappl.1992.72.6.2188. [DOI] [PubMed] [Google Scholar]
- 13.Veldhuis JD, et al. Differential impact of age, sex steroid hormones, and obesity on basal versus pulsatile growth hormone secretion in men as assessed in an ultrasensitive chemiluminescence assay. J Clin Endocrinol Metab. 1995;80(11):3209–3222. doi: 10.1210/jcem.80.11.7593428. [DOI] [PubMed] [Google Scholar]
- 14.Saito M, Sone R, Ikeda M, Mano T. Sympathetic outflow to the skeletal muscle in humans increases during prolonged light exercise. J Appl Physiol. 1997;82(4):1237–1243. doi: 10.1152/jappl.1997.82.4.1237. [DOI] [PubMed] [Google Scholar]
- 15.Pritzlaff CJ, et al. Impact of acute exercise intensity on pulsatile growth hormone release in men. J Appl Physiol. 1999;87(2):498–504. doi: 10.1152/jappl.1999.87.2.498. [DOI] [PubMed] [Google Scholar]
- 16.Jones BK, Monks BR, Liebhaber SA, Cooke NE. The human growth hormone gene is regulated by a multicomponent locus control region. Mol Cell Biol. 1995;15(12):7010–7021. doi: 10.1128/mcb.15.12.7010. [DOI] [PMC free article] [PubMed] [Google Scholar]
- 17.Lira SA, Kalla KA, Glass CK, Drolet DW, Rosenfeld MG. Synergistic interactions between Pit-1 and other elements are required for effective somatotroph rat growth hormone gene expression in transgenic mice. Mol Endocrinol. 1993;7(5):694–701. doi: 10.1210/mend.7.5.8316253. [DOI] [PubMed] [Google Scholar]
- 18.Wells JA, et al. The molecular basis for growth hormone-receptor interactions. Recent Prog Horm Res. 1993;48:253–275. [PubMed] [Google Scholar]
- 19.Wells JA, de Vos AM. Structure and function of human growth hormone: implications for the hematopoietins. Annu Rev Biophys Biomol Struct. 1993;22:329–351. doi: 10.1146/annurev.bb.22.060193.001553. [DOI] [PubMed] [Google Scholar]
- 20.Chadwick A, Folley SJ, Gemzell CA. Lactogenic activity of human pituitary growth hormone. Lancet. 1961;2(7196):241–243. doi: 10.1016/s0140-6736(61)90359-2. [DOI] [PubMed] [Google Scholar]
- 21.Strasburger CJ. Antigenic epitope mapping of the human growth hormone molecule: a strategy to standardize growth hormone immunoassays. Acta Paediatr Scand Suppl. 1990;370:82–86. doi: 10.1111/j.1651-2227.1990.tb11679.x. [DOI] [PubMed] [Google Scholar]
- 22.Yi S, Bernat B, Pal G, Kossiakoff A, Li WH. Functional promiscuity of squirrel monkey growth hormone receptor toward both primate and nonprimate growth hormones. Mol Biol Evol. 2002;19(7):1083–1092. doi: 10.1093/oxfordjournals.molbev.a004166. [DOI] [PubMed] [Google Scholar]
- 23.Nickel BE, Kardami E, Cattini PA. The human placental growth hormone variant is mitogenic for rat lymphoma Nb2 cells. Endocrinology. 1990;126(2):971–976. doi: 10.1210/endo-126-2-971. [DOI] [PubMed] [Google Scholar]
- 24.Jin Y, Lu SY, Fresnoza A, Detillieux KA, Duckworth ML, Cattini PA. Differential placental hormone gene expression during pregnancy in a transgenic mouse containing the human growth hormone/chorionic somatomammotropin locus. Placenta. 2009;30(3):226–235. doi: 10.1016/j.placenta.2008.12.011. [DOI] [PMC free article] [PubMed] [Google Scholar]
- 25.Vakili H, Jin Y, Nagy JI, Cattini PA. Transgenic mice expressing the human growth hormone gene provide a model system to study human growth hormone synthesis and secretion in non-tumor-derived pituitary cells: differential effects of dexamethasone and thyroid hormone. Mol Cell Endocrinol. 2011;345(1–2):48–57. doi: 10.1016/j.mce.2011.07.010. [DOI] [PubMed] [Google Scholar]
- 26.Grosveld F, van Assendelft GB, Greaves DR, Kollias G. Position-independent, high-level expression of the human β-globin gene in transgenic mice. Cell. 1987;51(6):975–985. doi: 10.1016/0092-8674(87)90584-8. [DOI] [PubMed] [Google Scholar]
- 27.Elefant F, Cooke NE, Liebhaber SA. Targeted recruitment of histone acetyltransferase activity to a locus control region. J Biol Chem. 2000;275(18):13827–13834. doi: 10.1074/jbc.275.18.13827. [DOI] [PubMed] [Google Scholar]
- 28.Ho Y, Elefant F, Liebhaber SA, Cooke NE. Locus control region transcription plays an active role in long-range gene activation. Mol Cell. 2006;23(3):365–375. doi: 10.1016/j.molcel.2006.05.041. [DOI] [PubMed] [Google Scholar]
- 29.Su Y, Liebhaber SA, Cooke NE. The human growth hormone gene cluster locus control region supports position-independent pituitary- and placenta-specific expression in the transgenic mouse. J Biol Chem. 2000;275(11):7902–7909. doi: 10.1074/jbc.275.11.7902. [DOI] [PubMed] [Google Scholar]
- 30.Vakili H, Jin Y, Cattini PA. Negative regulation of human growth hormone gene expression by insulin is dependent on hypoxia-inducible factor binding in primary non-tumor pituitary cells. J Biol Chem. 2012;287(40):33282–33292. doi: 10.1074/jbc.M112.380949. [DOI] [PMC free article] [PubMed] [Google Scholar]
- 31.Fleetwood MR, Ho Y, Cooke NE, Liebhaber SA. DNase I hypersensitive site II of the human growth hormone locus control region mediates an essential and distinct long-range enhancer function. J Biol Chem. 2012;287(30):25454–25465. doi: 10.1074/jbc.M112.365825. [DOI] [PMC free article] [PubMed] [Google Scholar]
- 32.Iizuka M, Smith MM. Functional consequences of histone modifications. Curr Opin Genet Dev. 2003;13(2):154–160. doi: 10.1016/S0959-437X(03)00020-0. [DOI] [PubMed] [Google Scholar]
- 33.Yang X, Jin Y, Cattini PA. Appearance of the pituitary factor Pit-1 increases chromatin remodeling at hypersensitive site III in the human GH locus. J Mol Endocrinol. 2010;45(1):19–32. doi: 10.1677/JME-10-0017. [DOI] [PMC free article] [PubMed] [Google Scholar]
- 34.Jin Y, Surabhi RM, Fresnoza A, Lytras A, Cattini PA. A role for A/T-rich sequences and Pit-1/GHF-1 in a distal enhancer located in the human growth hormone locus control region with preferential pituitary activity in culture and transgenic mice. Mol Endocrinol. 1999;13(8):1249–1266. doi: 10.1210/mend.13.8.0332. [DOI] [PubMed] [Google Scholar]
- 35.Ho Y, Elefant F, Cooke N, Liebhaber S. A defined locus control region determinant links chromatin domain acetylation with long-range gene activation. Mol Cell. 2002;9(2):291–302. doi: 10.1016/S1097-2765(02)00447-1. [DOI] [PubMed] [Google Scholar]
- 36.Ho Y, Tadevosyan A, Liebhaber SA, Cooke NE. The juxtaposition of a promoter with a locus control region transcriptional domain activates gene expression. EMBO Rep. 2008;9(9):891–898. doi: 10.1038/embor.2008.126. [DOI] [PMC free article] [PubMed] [Google Scholar]
- 37.Ho Y, Shewchuk BM, Liebhaber SA, Cooke NE. Distinct chromatin configurations regulate the initiation and the maintenance of hGH gene expression. Mol Cell Biol. 2013;33(9):1723–1734. doi: 10.1128/MCB.01166-12. [DOI] [PMC free article] [PubMed] [Google Scholar]
- 38.Watson PJ, Fairall L, Schwabe JW. Nuclear hormone receptor co-repressors: structure and function. Mol Cell Endocrinol. 2012;348(2):440–449. doi: 10.1016/j.mce.2011.08.033. [DOI] [PMC free article] [PubMed] [Google Scholar]
- 39.Jepsen K, Rosenfeld MG. Biological roles and mechanistic actions of co-repressor complexes. J Cell Sci. 2002;115(pt 4):689–698. doi: 10.1242/jcs.115.4.689. [DOI] [PubMed] [Google Scholar]
- 40.Scully KM, et al. Allosteric effects of Pit-1 DNA sites on long-term repression in cell type specification. Science. 2000;290(5494):1127–1131. doi: 10.1126/science.290.5494.1127. [DOI] [PubMed] [Google Scholar]
- 41.Voss TC, Demarco IA, Booker CF, Day RN. Functional interactions with Pit-1 reorganize co-repressor complexes in the living cell nucleus. J Cell Sci. 2005;118(pt 15):3277–3288. doi: 10.1242/jcs.02450. [DOI] [PMC free article] [PubMed] [Google Scholar]
- 42.Ronsch K, Jager M, Schopflin A, Danciu M, Lassmann S, Hecht A. Class I and III HDACs and loss of active chromatin features contribute to epigenetic silencing of CDX1 and EPHB tumor suppressor genes in colorectal cancer. Epigenetics. 2011;6(5):610–622. doi: 10.4161/epi.6.5.15300. [DOI] [PubMed] [Google Scholar]
- 43.Hsin JP, Manley JL. The RNA polymerase II CTD coordinates transcription and RNA processing. Genes Dev. 2012;26(19):2119–2137. doi: 10.1101/gad.200303.112. [DOI] [PMC free article] [PubMed] [Google Scholar]
- 44.Phatnani HP, Greenleaf AL. Phosphorylation and functions of the RNA polymerase II CTD. Genes Dev. 2006;20(21):2922–2936. doi: 10.1101/gad.1477006. [DOI] [PubMed] [Google Scholar]
- 45.Scacchi M, et al. The diagnosis of GH deficiency in obese patients: a reappraisal with GHRH plus arginine testing after pharmacological blockade of lipolysis. Eur J Endocrinol. 2010;163(2):201–206. doi: 10.1530/EJE-10-0160. [DOI] [PubMed] [Google Scholar]
- 46.Pijl H, et al. Altered neuroregulation of GH secretion in viscerally obese premenopausal women. J Clin Endocrinol Metab. 2001;86(11):5509–5515. doi: 10.1210/jcem.86.11.8061. [DOI] [PubMed] [Google Scholar]
- 47.Procopio M, et al. Short-term fasting in obesity fails to restore the blunted GH responsiveness to GH-releasing hormone alone or combined with arginine. Clin Endocrinol (Oxf). 1995;43(6):665–669. doi: 10.1111/j.1365-2265.1995.tb00532.x. [DOI] [PubMed] [Google Scholar]
- 48.Maccario M, et al. In obesity the somatotrope response to either growth hormone-releasing hormone or arginine is inhibited by somatostatin or pirenzepine but not by glucose. J Clin Endocrinol Metab. 1995;80(12):3774–3778. doi: 10.1210/jcem.80.12.8530634. [DOI] [PubMed] [Google Scholar]
- 49.Gahete MD, et al. Elevated GH/IGF-I, due to somatotrope-specific loss of both IGF-I and insulin receptors, alters glucose homeostasis and insulin sensitivity in a diet-dependent manner. Endocrinology. 2011;152(12):4825–4837. doi: 10.1210/en.2011-1447. [DOI] [PMC free article] [PubMed] [Google Scholar]
- 50.Calestagne-Morelli A, Ausio J. Long-range histone acetylation: biological significance, structural implications, and mechanisms. Biochem Cell Biol. 2006;84(4):518–527. doi: 10.1139/o06-067. [DOI] [PubMed] [Google Scholar]
- 51.Guenther MG, Lane WS, Fischle W, Verdin E, Lazar MA, Shiekhattar R. A core SMRT corepressor complex containing HDAC3 and TBL1, a WD40-repeat protein linked to deafness. Genes Dev. 2000;14(9):1048–1057. [PMC free article] [PubMed] [Google Scholar]
- 52.Heinzel T, et al. A complex containing N-CoR, mSin3 and histone deacetylase mediates transcriptional repression. Nature. 1997;387(6628):43–48. doi: 10.1038/387043a0. [DOI] [PubMed] [Google Scholar]
- 53.Bennani-Baiti IM, Asa SL, Song D, Iratni R, Liebhaber SA, Cooke NE. DNase I-hypersensitive sites I and II of the human growth hormone locus control region are a major developmental activator of somatotrope gene expression. Proc Natl Acad Sci U S A. 1998;95(18):10655–10660. doi: 10.1073/pnas.95.18.10655. [DOI] [PMC free article] [PubMed] [Google Scholar]
- 54.Bennani-Baiti IM, Cooke NE, Liebhaber SA. Physical linkage of the human growth hormone gene cluster and the CD79b (Ig beta/B29) gene. Genomics. 1998;48(2):258–264. doi: 10.1006/geno.1997.5171. [DOI] [PubMed] [Google Scholar]
- 55.Oliver SR, Hingorani SR, Rosa JS, Zaldivar FP, Galassetti PR. Synergistic effect of obesity and lipid ingestion in suppressing the growth hormone response to exercise in children. J Appl Physiol (1985). 2012;113(2):192–198. doi: 10.1152/japplphysiol.01184.2011. [DOI] [PMC free article] [PubMed] [Google Scholar]
- 56.Karlsson S, Ahren B. Insulin and glucagon secretion in swimming mice: effects of autonomic receptor antagonism. Metabolism. 1990;39(7):724–732. doi: 10.1016/0026-0495(90)90108-O. [DOI] [PubMed] [Google Scholar]
- 57.Dunning BE, Karlsson S, Ahren B. Contribution of galanin to stress-induced impairment of insulin secretion in swimming mice. Acta Physiol Scand. 1991;143(2):145–152. doi: 10.1111/j.1748-1716.1991.tb09215.x. [DOI] [PubMed] [Google Scholar]
- 58.Karlsson S, Ahren B. Insulin and glucagon secretion in swimming mice: effects of adrenalectomy and chemical sympathectomy. J Auton Nerv Syst. 1991;32(3):183–189. doi: 10.1016/0165-1838(91)90112-G. [DOI] [PubMed] [Google Scholar]
- 59.Walhin JP, Richardson JD, Betts JA, Thompson D. Exercise counteracts the effects of short-term overfeeding and reduced physical activity independent of energy imbalance in healthy young men. J Physiol. 2013;591(pt 24):6231–6243. doi: 10.1113/jphysiol.2013.262709. [DOI] [PMC free article] [PubMed] [Google Scholar]
- 60.Jimenez SK, Jassal DS, Kardami E, Cattini PA. A single bout of exercise promotes sustained left ventricular function improvement after isoproterenol-induced injury in mice. J Physiol Sci. 2011;61(4):331–336. doi: 10.1007/s12576-011-0147-x. [DOI] [PMC free article] [PubMed] [Google Scholar]
- 61.Vakili H, Jin Y, Menticoglou S, Cattini PA. CCAAT-enhancer-binding protein beta (C/EBPβ) and downstream human placental growth hormone genes are targets for dysregulation in pregnancies complicated by maternal obesity. J Biol Chem. 2013;288(31):22849–22861. doi: 10.1074/jbc.M113.474999. [DOI] [PMC free article] [PubMed] [Google Scholar]
- 62.Miele A, Dekker J. Mapping cis- and trans- chromatin interaction networks using chromosome conformation capture (3C). Methods Mol Biol. 2009;464:105–121. doi: 10.1007/978-1-60327-461-6_7. [DOI] [PMC free article] [PubMed] [Google Scholar]
- 63.Dekker J, Rippe K, Dekker M, Kleckner N. Capturing chromosome conformation. Science. 2002;295(5558):1306–1311. doi: 10.1126/science.1067799. [DOI] [PubMed] [Google Scholar]