

Abstract
This functional magnetic resonance imaging study examined the neural correlates of punishment and forgiveness of initiators of social exclusion (i.e. ‘excluders’). Participants divided money in a modified Dictator Game between themselves and people who previously either included or excluded them during a virtual ball-tossing game (Cyberball). Participants selectively punished the excluders by decreasing their outcomes; even when this required participants to give up monetary rewards. Punishment of excluders was associated with increased activation in the pre-supplementary motor area (pre-SMA) and bilateral anterior insula. Costly punishment was accompanied by higher activity in the pre-SMA compared with punishment that resulted in gains or was non-costly. Refraining from punishment (i.e. forgiveness) was associated with self-reported perspective-taking and increased activation in the bilateral temporoparietal junction, dorsomedial prefrontal cortex, dorsal anterior cingulate cortex, and ventrolateral and dorsolateral prefrontal cortex. These findings show that social exclusion can result in punishment as well as forgiveness of excluders and that separable neural networks implicated in social cognition and cognitive control are recruited when people choose either to punish or to forgive those who excluded them.
Keywords: Dictator Game, fairness, fMRI, ostracism, perspective-taking
INTRODUCTION
Social exclusion is a highly distressing experience and poses a severe threat to fundamental human needs, such as our need to belong and a need for control (Baumeister and Leary, 1995; Williams, 2007). In response to social exclusion, people often attempt to restore their thwarted needs in subsequent social interactions. For example, after people are excluded they show increased levels of prosocial behavior toward potential new sources of affiliation, which possibly reflects a motivation to seek renewed acceptance and restore a sense of belonging (Maner et al., 2007). Furthermore, victims of exclusion selectively decrease prosocial behavior toward the specific individuals who excluded them (Hillebrandt et al., 2011) and are even willing to aggress against them (Twenge et al., 2007), which has been suggested to be an attempt to regain a sense of control (Williams, 2007). However, not everyone chooses to aggress against those who excluded them (Chester et al., 2013) and some might even decide to forgive the initiators of exclusion (i.e. the excluders). This study set out to investigate punishment as well as forgiveness of excluders and the neural correlates of these behavioral reactions to social exclusion.
A series of neuroimaging studies have identified a network of brain regions involved in emotional reactions to social exclusion using a virtual ball-tossing game called Cyberball (Eisenberger et al., 2003; Bolling et al., 2011; Sebastian et al., 2011). After being excluded in Cyberball, people report heightened levels of sadness and anger and lowered levels of a sense of belonging, self-esteem, control and meaningful existence (Zadro et al., 2004; van Beest and Williams, 2006). Such exclusion-related distress has been positively associated with activation in brain regions involved in processing negative affect, such as the anterior insula (AI) and dorsal, ventral and subgenual regions of the anterior cingulate cortex (ACC) (Eisenberger et al., 2003; Masten et al., 2009; Bolling et al., 2011). Activity in the ventrolateral prefrontal cortex (vlPFC), a region implicated in emotion regulation, has been found to be negatively related to distress after exclusion (Eisenberger et al., 2003; Bolling et al., 2011).
Although these studies have informed us on the neural correlates of processing and regulating exclusion-related distress, the neural correlates of social behavior after an episode of exclusion have received less attention. A recent study showed that although participants showed low levels of trust toward peers who previously excluded them, reinforcement signals in the striatum still guided learning from the trustworthiness of excluders and enabled sustaining trust (Fareri et al., 2012). In a Dictator Game—where profits are not dependent on the second player’s decisions—people kept more money to themselves and shared less with excluders, which was associated with increased activation in dorsal ACC (dACC), AI, the temporoparietal junction (TPJ) and lateral regions of the PFC (Gunther Moor et al., 2012). How activation in these regions relates to punishment of excluders or refraining thereof (i.e. forgiveness) is not yet clear, because these prior studies’ experimental designs did not provide a dissociation between a self-oriented motive aimed at maximizing one’s own profits and other-oriented motives aimed at increasing (Fareri et al., 2012) or decreasing (Gunther Moor et al., 2012) another person’s profits.
The goals of this study were threefold: (i) to examine whether people punish excluders when it does not result in monetary gains or when they have to pay to punish, (ii) to investigate how activation in brain regions involved in punishment of norm-violators is differentially sensitive to gains and losses for the punisher, and (iii) to examine the neural correlates of forgiving excluders (i.e. refraining from punishment by equally sharing with excluders when sharing was not confounded by strategic motivations aimed at maximizing personal profits) (McCullough et al., 1997; Brüne et al., 2013). We modified the Dictator Game in such a way that participants could choose to either forgive excluders by sharing a sum of money equally with them, or to punish them and punishment could coincide with: (i) monetary gains (beneficial inequality), (ii) no monetary consequences (non-costly inequality), or (iii) losses (costly inequality).1 We regarded unequal distributions as punishment and equal distributions as forgiveness only in interactions with peers who violated a social norm during Cyberball, i.e. the excluders. Therefore, to get a clean measure of punishment, we examined unequal distributions allocated to excluders relative to unequal distributions allocated to includers.
We hypothesized that participants would punish excluders by reducing the excluders’ monetary rewards (i.e. choosing more unequal distributions for excluders than for includers). We predicted punishment to be inflicted most often when it led to monetary gains (i.e. beneficial inequality) and least often when it was costly, with non-costly inequality at an intermediate position. Based on previous neuroimaging studies we expected brain regions implicated in reward processing (striatum), negative affect (AI) and the detection of norm-violations [pre-supplementary motor area (pre-SMA)/ACC] to be involved in delivering punishment (Sanfey et al., 2003; De Quervain, 2004; Strobel et al., 2011; Baumgartner et al., 2012).
Participants could forgive the excluders, defined as refraining from retaliation and acting prosocial toward the offenders despite the offenders’ hurtful actions (McCullough et al., 1997), by sharing a sum of money equally with them (Brüne et al., 2013). Prior studies have demonstrated that adopting a transgressor’s perspective facilitates forgiveness (Brown, 2003; Exline et al., 2008). Consequently, we tested whether higher levels of self-reported perspective-taking would be related to lower levels of punishment behavior toward excluders. We hypothesized that forgiveness would coincide with increased activation in brain regions implicated in ‘theory of mind’ and perspective-taking, such as the dorsomedial prefrontal cortex (dmPFC) and the TPJ (Lamm et al., 2007; Young and Saxe, 2009). Furthermore, cognitive control has been shown to play an important role in refraining from aggression against excluders (Chester et al., 2013) and control-related brain regions, such as regions of the lateral PFC are activated when people share equally with peers who previously treated them unfairly (Brüne et al., 2013). Accordingly, we predicted that forgiving excluders would also be associated with activity in regions of the lateral PFC, consistent with their involvement in cognitive control in social decision-making (Knoch et al., 2006; Steinbeis et al., 2012).
METHODS
Participants
Twenty-eight right-handed healthy volunteers were recruited through local advertisements and gave informed consent for the study. Two participants were excluded from the analyses because they expressed doubts about the cover story. The remaining 26 participants had a mean age of 20.7 years (s.d. = 1.97, 16 females). All participants indicated to be healthy and reported no contraindications for magnetic resonance imaging (MRI) (e.g. no head injuries, no history of neurological or psychiatric disorders). All anatomical scans were reviewed and cleared by a radiologist; no anomalies were reported. After scanning, participants filled out several questionnaires and were debriefed. Participants received €25,- for participation and an additional amount of money, which was told to be determined by their decisions in the Dictator Game. In reality, each participant received an extra €5. The study was approved by the university’s medical ethical committee.
Functional MRI tasks
Cyberball
Participants were instructed that they were about to perform a mental visualization task by means of an online ball-tossing game with two other participants in the experiment (Williams et al., 2000). Participants were told that they were about to interact with other participants who were present at the experiment site and with whom they would not meet face-to-face after the experiment. In reality, all ball tosses by the other players were preprogrammed. The participants were represented by a cartoon hand along with their own name and the other players were displayed as two cartoon characters accompanied by one male and one female name (Figure 1A). Participants could throw the ball to a player on their right or their left side by a button press with the index finger of the corresponding hand.
Fig. 1.

(A) Experimental procedure. Participants carried out the following tasks in the scanner: (i) Cyberball inclusion with two anonymous peers, (ii) Cyberball exclusion by two novel anonymous peers, (iii) Dictator Game in which participants divided money between themselves (depicted with red coins) and the players from the Cyberball games (i.e. includers and excluders; depicted with blue coins). (B) Five different forms of inequality; each trial consisted of a dichotomous choice between an equal distribution and one of these five forms of inequality.
Participants first played the ‘inclusion condition’ where each of the three players received the ball an equal number of times (10 out of 30 trials). Next, participants played the ‘exclusion condition’ with two novel players, during which they received the ball once at the start of the game. After throwing it to one of the players they did not receive the ball on any of the following 28 trials. Scans were acquired during two separate runs that lasted approximately 3 min each. Throwing was self-paced. Ball throws lasted 2 s and were preceded by a random jitter interval (100–4000 ms).
Dictator Game
After Cyberball, participants were given the opportunity to divide coins between themselves and one player from either the first or the second ball game, that is, Team 1 and Team 2, respectively. It was emphasized that coins were valuable and that a randomly selected allocation would be converted into real money, which both allocators (the participants) and recipients would receive at the end of the experiment. Furthermore, the Dictator Game was introduced as the final game of the experiment. Therefore, it was unlikely that the participants anticipated further interactions with the includers and excluder.
Participants were given a dichotomous choice between an equal distribution of five coins for themselves and five for the recipient (5/5) and one of five different unequal distributions (Figure 1B). These five unequal distributions were as follows and should all be interpreted relative to the alternative equal (5/5) distribution: beneficial inequality (eight coins for the participant and two coins for the recipient: 8/2), mild non-costly inequality (5/4), severe non-costly inequality (5/2), costly inequality (4/2) and (costly) prosocial inequality (4/6). Although in the non-costly inequality conditions choosing the inequality option instead of the equal distribution had no consequences for the participant’s own earnings, beneficial inequality was ‘advantageous’ and costly inequality was ‘disadvantageous’ for the participant.
We did not include a condition with neutral recipients with whom the participants had not interacted before, because this would increase the length of the task with 150% and this could lead to greater trial-to-trial variability, e.g. bigger differences in emotional valence between the first and final trials of the task possibly due to negative emotions toward excluders diminishing over time. Moreover, previous work has repeatedly shown that: (i) although exclusion elicits negative affect, inclusion does not elicit positive affect (Maner et al., 2007; Wesselmann et al., 2012; Will et al., 2013) and (ii) treatment of includers does not differ from treatment of neutral interaction partners or people with whom participants had not interacted before (Hillebrandt et al., 2011; Fareri et al., 2012; Gunther Moor et al., 2012; Güroğlu et al., 2013). The Dictator Game consisted of 180 trials (18 trials per condition; 5 inequality conditions × 2 recipients) and was administered in three runs of 210 volumes each, lasting about 23 min in total. After a fixation screen with a jittered duration [M = 1540 ms; s.d. = 1221 ms; min = 550 ms; max = 7700 ms; optimized with OptSeq2; (Dale, 1999)] participants were presented with a decision screen that showed (i) which distributions they could choose from and (ii) who the recipient would be (Figure 1A). Responses could be made by a button press with the index finger (left bucket) or middle finger (right bucket) of the right hand. As soon as participants made a decision a red rectangle appeared around the distribution of their choice until 6 s after trial onset. If participants had not responded within 5 s, a screen was presented with ‘Too late!’ for 1 s. Trials without a response consisted of <1% of all trials and were excluded from further analyses.
Questionnaires
Mood reports and need satisfaction
To measure exclusion-related distress, we assessed mood and need satisfaction at three time points: (i) after inclusion, (ii) after exclusion and (iii) after the Dictator Game (outside the scanner). The mood questionnaire consisted of eight mood items (feeling good, bad, happy, sad, relaxed, tense, friendly and unfriendly). The need satisfaction questionnaire consisted of eight items (two items assessing each need) taken from the need threat scale including ratings of belonging, self-esteem, control and meaningful existence (van Beest and Williams, 2006). All items were rated on a scale from 1 (not at all) to 5 (very much) and negative items were recoded. Lower scores on these measures reflect distress, i.e. need threat and lower mood.
Trait perspective-taking
Participants completed the perspective-taking subscale of the Interpersonal Reactivity Index (Davis, 1983) to assess dispositional perspective-taking, i.e. the tendency to adopt another person’s point of view (e.g. ‘When I get mad at someone, I try to imagine what they might be thinking’). All items were rated on a scale from 1 (not at all) to 5 (very much) and averaged to a mean score of trait perspective-taking.
Functional MRI data acquisition
Scans were acquired using a 3 T Philips Achieva MRI system at the University Medical Center. Stimuli were projected onto a screen located at the head of the scanner bore using Authorware (Cyberball) and E-prime (Dictator Game). Participants viewed the screen via a mirror mounted on the head coil. Foam inserts that surrounded the head were used to minimize head movement. The following scans were acquired: (i) a localizer scan, (ii) T2*-weighted echo-planar images (EPI; repetition time = 2.2 s, echo time = 30 ms, slice matrix = 80 × 80 matrix, slice thickness = 2.75 mm, slice gap = 0.28 mm gap, field of view = 220 mm) during five functional runs, and (iii) high-resolution T1-weighted and T2-weighted anatomical scans (with the same slice prescription as the EPIs). The first two volumes of each functional run were discarded to allow for equilibration of T1 saturation effects.
Functional MRI data analysis
MRI data were preprocessed and analyzed using SPM5 statistical parametric mapping image analysis software (Wellcome Department of Cognitive Neurology, London). Images were slice-time corrected, realigned, corrected for motion, spatially smoothed using an 8 mm full-width half-maximum Gaussian filter, and spatially normalized to EPI templates. Translational movement parameters never exceeded 1 voxel (<3 mm) in any direction for any subject or scan. The normalization algorithm resampled the volumes to 3 mm cubic voxels using a 12-parameter affine transformation and a nonlinear transformation involving cosine basic functions. All results are reported in MNI305 stereotactic space.
Data were modeled as zero-duration events at the onset of a ball-toss (Cyberball) or the decision screen (Dictator Game) (Gunther Moor et al., 2012; Lelieveld et al., 2013) and convolved with a canonical hemodynamic response function (HRF). Statistical analysis was carried out using a general linear model (GLM). Regressors were defined for three Cyberball events (a ball-toss between virtual peers, throwing, or receiving the ball) and were analyzed separately for the inclusion game and the exclusion game. Regressors were defined separately for equality and inequality choices made in each of the five inequality conditions in the Dictator Game and analyzed separately for the includers and the excluders. This model consisted of 20 decision-related regressors [i.e. Inequality condition (5) × Recipient (2) × Choice (2)], a regressor indicating missed trials, and a covariate for each run to control for run effects (3), which resulted in a GLM with a total of 24 predictors. To investigate the main effect of interacting with the excluders compared with includers in the Dictator Game (Excluders > Includers), we contrasted all decisions for excluders with all decisions for includers in conditions where participants could punish or forgive (i.e. all conditions except prosocial inequality). To test how activation in regions derived from the ‘Excluders > Includers’ contrast was differentially sensitive to personal gains when punishing excluders, we employed a region of interest (ROI) approach (see below). To investigate the neural correlates of punishment, we contrasted inequality decisions for excluders with equality decisions for excluders (excluders inequality > excluders equality). Finally, to examine forgiveness we contrasted equality decisions for excluders with equality decisions for includers (excluders equality> includers equality). For the latter two contrasts, we only considered the four Dictator Game conditions involving punishment and forgiveness (i.e. all conditions except prosocial inequality). Both GLMs contained a basic set of cosine functions that high-pass-filtered the data. The least-squares parameter estimates of the height of the best-fitting canonical HRF for each condition separately were used in pair-wise contrasts at the subject level. The resulting contrast images were submitted to group analyses where participants were treated as a random effect. One-tailed t-tests were considered significant at an uncorrected threshold of P < 0.001 with a minimum cluster size of 10 contiguous voxels to balance between Type 1 and Type 2 errors (Lieberman and Cunningham, 2009). We also report which results remain significant using a whole-brain voxel-wise false discovery rate (FDR) correction (P < 0.05, >10 voxels).
For ROI analyses, we used the MarsBaR toolbox (http://marsbar.sourceforge.net; Brett et al., 2002) to extract activity in functionally defined ROIs in the ‘Excluders > Includers’ contrast (in the Dictator Game) about which we had a priori hypotheses, i.e. pre-SMA/ACC, left and right AI. For each ROI, the blood oxygenation level dependent (BOLD) signal across functional clusters of voxels was averaged and the center of mass is reported. For all ROI analyses, effects were considered significant at P < 0.017, based on a Bonferonni correction for multiple comparisons (P = 0.05/3 ROIs).
RESULTS
Behavioral data
Need satisfaction and mood
Consistent with previous studies (Williams et al., 2000; van Beest and Williams, 2006) the four need scales were averaged to create an overall index of need satisfaction at each time-point, i.e. after inclusion, after exclusion and after the Dictator Game. Similarly, the four mood constructs were averaged to create an overall index of mood at each time-point.2 A repeated measures analysis of variance (ANOVA) for the composite score of ‘need satisfaction’ yielded a main effect of ‘time point’, F(2, 48) = 219.37, P < 0.001, = 0.90. Overall ‘Need satisfaction’ measured after inclusion (M = 3.7) declined during exclusion (M = 1.7) and returned to pre-exclusion levels after the Dictator Game (M = 4.1). A repeated measures ANOVA for overall mood yielded a main effect of ‘time point’, F(2, 48) = 50.73, P < 0.001, = 0.68. Overall mood measured after inclusion (M = 4.4) dropped during exclusion (M = 3.5) and returned to pre-exclusion levels after the Dictator Game (M = 4.5).
Punishment of the excluders in the Dictator Game
To investigate whether excluders were punished, a repeated measures ANOVA was performed with ‘Inequality condition’ (five levels: beneficial inequality, non-costly mild inequality, non-costly severe inequality, costly inequality and prosocial inequality) and ‘Recipient’ (two levels: includers vs excluders) as within-subjects factors and the percentage of unequal offers as the dependent variable. These analyses resulted in main effects of ‘Recipient’, F(1, 25) = 27.149, P < 0.001, = 0.52 and ‘Inequality condition’, F(4, 100) = 31.93, P < 0.001, = 0.56, and a significant interaction effect of ‘Recipient ×Inequality condition’, F(4, 100) = 13.80, P < 0.001, = 0.36. Unequal distributions were chosen more for excluders than for includers in each condition, (all Ps < 0.01), except for the prosocial inequality condition (P = 0.09) (Figure 2A). Post hoc pair-wise comparisons showed that, in exchange with the excluders, beneficial inequality was chosen more than the two non-costly inequality options (P < 0.05), which were chosen at similar rates (P = 0.09) and more than costly inequality, (all Ps < 0.01). A similar analysis for the includers showed that the beneficial inequality was chosen more often than the other forms of inequality, P < 0.01.
Fig. 2.

(A) Mean percentages of trials on which participants chose an unequal distribution in the Dictator Game for players who previously included and excluded them during Cyberball (error bars represent standard errors of the mean). Each form of ‘Inequality’ is displayed on the x-axis (red coins for participants; blue coins for the recipients). Unequal distributions were pitted against an equal distribution of money (five coins for the participant/five coins for the recipient). BI, beneficial inequality; NCI, non-costly inequality; CI, costly inequality; PI, prosocial inequality. (B) Self-reported trait perspective-taking was negatively associated with punishment of the excluders (difference between unequal distributions chosen for excluders and includers). IRI, interpersonal reactivity index.
Perspective-taking and forgiveness
A negative correlation between self-reported perspective-taking and punishment frequency (percentage of inequality offers to the excluders − percentage inequality offers to the includers in all conditions except prosocial inequality), r = −0.40, P < 0.05, confirmed that perspective-taking is important for forgiving excluders (Figure 2B). Perspective-taking skills were unrelated to exclusion-related distress (mood after exclusion, r = 0.30, P = 0.14, and need satisfaction after exclusion, r = 0.21, P = 0.29).
Neuroimaging results
Functional MRI results Cyberball
To examine the neural correlates of social exclusion, we compared activation on trials where participants did not receive the ball in the exclusion game with trials where participants received the ball in the inclusion game (exclusion no ball > inclusion ball). This whole-brain contrast resulted in activation in several regions, including the medial PFC (mPFC; peak 3, 45, −15) and subgenual ACC (sgACC; peak −9, 24, −6) (Figure 3A). A regression analysis with need satisfaction as a predictor revealed a positive correlation in the ventral ACC and the right vlPFC/insula (Figure 3B). All significant clusters are reported in Supplementary Table S1.
Fig. 3.

Whole-brain results from the Cyberball interaction. (A) Exclusion no ball > inclusion ball: mPFC (peak 3, 45, −15) and sgACC (peak −9, 24, −6). (B) A whole-brain regression analysis showed that activity in the ‘Exclusion no ball > Inclusion ball’ contrast was positively associated with need satisfaction after exclusion in the right vlPFC (peak 45, 21, −3).
Functional MRI results Dictator Game
Decision-making with excluders
To investigate brain regions that were more active when making a decision in the Dictator Game for excluders compared with includers, we conducted a whole-brain analysis collapsed across the four Dictator Game conditions involving punishment (i.e. all conditions except prosocial inequality) and collapsed across choices. The ‘Excluders > Includers’ contrast resulted in increased activation in the pre-SMA (peak 3, 21, 60) and bilateral AI (peaks 30, 21, −9 and −30, 21, −15) (Figure 4). All areas of activation are listed in Table 1.
Fig. 4.
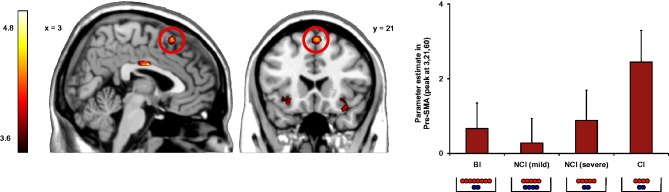
Activation of pre-SMA (peak 3, 21, 60) when choosing unequal offers for excluders in the four different punishment conditions (error bars represent standard error of the mean). BI, beneficial inequality; NCI, non-costly inequality; CI, costly inequality.
Table 1.
Brain regions revealed by whole-brain contrasts when participants made an allocation in the Dictator Game with excluders vs includers as recipients (all thresholded P < 0.001 uncorrected, >10 voxels)
| Brain region | L/R | Voxels | Z | MNI coordinates |
||
|---|---|---|---|---|---|---|
| x | y | z | ||||
| Excluders > Includers | ||||||
| Middle cingulate cortex | R | 31 | 4.13 | 3 | −6 | 30 |
| Precentral gyrus | L | 13 | 3.84 | −42 | 0 | 21 |
| Pre-SMA | R | 20 | 3.83 | 3 | 21 | 60 |
| Inferior parietal lobe | L | 59 | 3.81 | −48 | −45 | 57 |
| 3.80 | −54 | −45 | 42 | |||
| 3.70 | −57 | −36 | 48 | |||
| AI (extending into inferior frontal gyrus) | R | 14 | 3.64 | 36 | 24 | −18 |
| 3.41 | 30 | 21 | −9 | |||
| Inferior frontal gyrus (lateral PFC) | R | 17 | 3.61 | 42 | 42 | −18 |
| AI (extending into inferior frontal gyrus) | L | 15 | 3.55 | −30 | 21 | −15 |
| 3.25 | −36 | 21 | −9 | |||
| Includers > Excluders | ||||||
| Superior occipital gyrus | L | 62 | 4.04 | −12 | −99 | 12 |
| 3.40 | −15 | −96 | 0 | |||
L/R, left/right; k, cluster size in 3 × 3 × 3 mm voxels; Z = z-score; MNI coordinates, xyz voxel coordinates in MNI space of the peak voxel; PFC, prefrontal cortex; Pre-SMA, Pre-Supplementary Motor Area; AI, Anterior insula.
Punishing excluders
To examine the neural correlates of punishment, we conducted a whole-brain analysis and ROI analyses. A whole-brain contrast between inequality choices for excluders and equality choices for includers (excluders inequality > excluders equality) collapsed across the four Dictator Game conditions involving punishment (i.e. all conditions except prosocial inequality) did not result in significant clusters of activation. To investigate how activation in the pre-SMA/ACC, left and right insula were differentially sensitive to self-gain while punishing the excluders, we performed functional ROI analyses based on these regions obtained from the ‘Excluders > Includers’ contrast reported earlier.
First, using activation levels in each ROI during inequality choices for the excluders as the dependent variable, we conducted three separate repeated measures analyses of covariance for each brain region with inequality condition (four levels: beneficial inequality, non-costly mild inequality, non-costly severe inequality, and costly inequality) as a within-subjects factor and punishment frequency as a covariate. We controlled for punishment frequency because of the involvement of the pre-SMA/ACC and AI in deviations from default response patterns (van den Bos et al., 2009; Güroğlu et al., 2010) and to control for the amount of trials contrast values were based on. These analyses yielded a main effect of inequality condition in the pre-SMA, F(3, 33) = 5.17, P < 0.01, = 0.32, qualified by more activity for costly inequality choices compared with the three other inequality choices for excluders (Figure 4). Activity in left (P = 0.27) and right AI (P = 0.12) did not differ between inequality choices after controlling for punishment frequency.
Second, we correlated activation in the ROIs with the frequency of inequality choices made in each condition. These analyses yielded a negative correlation between BOLD response and costly punishment frequency in the pre-SMA (r = −0.64, P < 0.017) and right AI (r = −0.63, P < 0.017). Thus, the participants who less often opted for costly punishment exhibited higher BOLD responses in these regions when they chose costly punishment.
Forgiving excluders
To investigate which brain regions were involved in forgiveness of excluders, we contrasted equality choices for excluders with equality choices for includers in the four Dictator Game conditions involving punishment and forgiveness (i.e. all conditions except prosocial inequality). This comparison (excluders equality > includers equality) revealed activity in the right TPJ (peak 57, −57, 45), dmPFC (peak 3, 42, 36), right vlPFC (peak 42, 42, −15) and the right AI (peak 30, 21, −9). A subsequent whole-brain regression analysis with punishment frequency as a predictor revealed a positive correlation in the left and right TPJ (peaks −51, −48, 36 and 45, −54, 36), dmPFC (peak −15, 60, 24), as well as in the pre-SMA/ACC (peaks −6, 18, 51 and 9, 36, 36), bilateral AI (peaks −30, 21, −6 and 33, 18, −12) and dorsolateral and ventrolateral PFC (peaks −30, 51, 0 and 33, 54, 9) (Figure 5). Thus, participants who punished more often recruited the left and right TPJ, dmPFC, lateral PFC and pre-SMA/ACC and bilateral insula to a greater extent when they forgave the excluders. All significant clusters are reported in Table 2.
Fig. 5.

A regression analysis for the ‘Excluders equality > Includers equality’ contrast with punishment frequency as a regressor resulted in activation in: left and right TPJ (peaks −51, −48, 36 and 45, −54, 36), dorsal and ventrolateral regions of the PFC (peaks −30, 51, 0 and 33, 54, 9), pre-SMA/ACC (peaks −6, 18, 51 and 9, 36, 36) and bilateral insula (peaks −30, 21, −6 and 33, 18, −12).
Table 2.
Brain regions revealed by whole-brain contrasts when participants shared the split equally in the Dictator Game with excluders vs includers (all thresholded P < 0.001 uncorrected, >10 voxels)
| Brain region | L/R | Voxels | Z | MNI coordinates |
||
|---|---|---|---|---|---|---|
| x | y | z | ||||
| Excluders equality > Includers equality | ||||||
| Superior frontal gyrus (dmPFC) (extending into pre-SMA/ACC) | R | 272 | 4.16 | 12 | 30 | 57 |
| 3.93 | 12 | 21 | 66 | |||
| 3.90 | 21 | 36 | 54 | |||
| Inferior frontal gyrus (lateral PFC) | R | 21 | 3.81 | 42 | 42 | −15 |
| TPJ | R | 87 | 3.79 | 57 | −57 | 45 |
| 3.61 | 48 | −63 | 48 | |||
| 3.60 | 57 | −51 | 51 | |||
| Middle frontal gyrus | R | 60 | 3.76 | 42 | 24 | 51 |
| 3.29 | 48 | 24 | 30 | |||
| 3.27 | 45 | 12 | 48 | |||
| AI (extending into inferior frontal gyrus | R | 20 | 3.64 | 30 | 21 | −9 |
| 3.45 | 36 | 21 | −15 | |||
| 3.42 | 30 | 18 | −24 | |||
| Superior frontal gyrus (dmPFC) | R | 15 | 3.57 | 15 | 66 | 21 |
| Angular gyrus | L | 28 | 3.44 | −57 | −60 | 39 |
| 3.42 | −45 | −69 | 48 | |||
| 3.32 | −42 | −63 | 42 | |||
| Middle frontal gyrus | L | 15 | 3.40 | −36 | 18 | 54 |
| 3.26 | −30 | 18 | 54 | |||
| Positive correlation with punishment frequency (percentage inequality for excluders − percentage inequality for includers) | ||||||
| TPJ | L | 550 | 5.23 | −51 | −48 | 36* |
| 4.69 | −51 | −39 | 42* | |||
| 4.40 | −54 | −27 | 39* | |||
| R | 320 | 5.15 | 45 | −54 | 36* | |
| 4.27 | 24 | −60 | 42* | |||
| 4.05 | 57 | −54 | 42 | |||
| Superior frontal gyrus (extending into pre-SMA/ACC) | L | 557 | 5.20 | −33 | 18 | 54* |
| 4.68 | −6 | 18 | 51 | |||
| 4.57 | 9 | 36 | 36* | |||
| AI | L | 17 | 4.56 | −30 | 21 | −6* |
| Lateral PFC (dlPFC/vlPFC) | L | 90 | 4.47 | −30 | 51 | 0* |
| 3.71 | −33 | 54 | −9* | |||
| 3.59 | −42 | 48 | 3* | |||
| Middle frontal gyrus | L | 110 | 4.39 | −42 | 30 | 24* |
| 4.04 | −36 | 9 | 36* | |||
| 3.90 | −39 | 18 | 27* | |||
| Thalamus/pallidum | L | 41 | 4.01 | −9 | −9 | 3* |
| 3.97 | −12 | 0 | −3 | |||
| 3.77 | −3 | −18 | −6* | |||
| Middle frontal gyrus | R | 100 | 3.98 | 42 | 24 | 30* |
| 3.92 | 45 | 30 | 24* | |||
| 3.89 | 51 | 24 | 30* | |||
| Inferior frontal gyrus | R | 15 | 3.94 | 45 | 24 | 9* |
| 3.23 | 51 | 21 | 3* | |||
| Precentral gyrus | L | 17 | 3.76 | −30 | −6 | 48* |
| 3.47 | −21 | −9 | 48* | |||
| Superior frontal gyrus (dmPFC) | R | 15 | 3.73 | 15 | 60 | 24 |
| AI | R | 15 | 3.72 | 33 | 18 | −12* |
| Middle occipital gyrus | R | 11 | 3.62 | 39 | −72 | 24* |
| Lateral PFC (dlFPC) | R | 12 | 3.50 | 33 | 54 | 9* |
| Posterior cingulate cortex | R | 13 | 3.42 | 9 | −27 | 30* |
| 3.30 | 9 | −30 | 24* | |||
| 3.30 | 3 | −33 | 27* | |||
| Includers equality > Excluders equality | ||||||
| No significant activations | ||||||
L/R, left/right; k, cluster size in 3 × 3 × 3 mm voxels; Z, z-score; MNI coordinates, xyz voxel coordinates in MNI space of the peak voxel; dlPFC, dorsolateral prefrontal cortex; TPJ, Temporoparietal junction; AI, Anterior insula. *Also significant using FDR correction, P < 0.05, >10 voxels.
DISCUSSION
The current functional MRI study set out to investigate how experiencing social exclusion relates to subsequent punishment and forgiveness of excluders and the neural correlates of such decisions. We replicated previous findings showing that social exclusion in Cyberball is distressing (Zadro et al., 2004; van Beest and Williams, 2006) and associated with activation in brain regions involved in processing negative affect (sgACC and vACC), emotion regulation (vlPFC) and social evaluation (mPFC) (Eisenberger et al., 2003; Sebastian et al., 2011; Gunther Moor et al., 2012). We extend previous work by showing that participants punished excluders, not only when punishment coincided with monetary gains (Gunther Moor et al., 2012) but also when punishment had no monetary consequences and even when it was costly to punish. This corroborates research showing that people selectively decrease prosocial behavior toward excluders (Maner et al., 2007), possibly to reestablish a sense of control over their social world (Williams, 2007). Through our modification of the Dictator Game, we could distinguish a motivation to reduce the excluders’ outcomes from a selfish motivation to maximize one’s own outcomes. Although excluders were punished in each condition, punishment was inflicted the most when it resulted in monetary gains and participants punished less when they had to give up money to do so. Taken together, our behavioral findings provide strong evidence for the notion that social exclusion leads to punishment of excluders and that personal outcome maximization plays an important role in these decisions.
Consistent with prior work demonstrating that punishment of unfairness coincides with activity in the pre-SMA/ACC and bilateral AI (Sanfey et al., 2003; Güroğlu et al., 2010), we show that this network is also important for punishing a non-economic norm-violation. In the pre-SMA, we found a dissociation between costly punishment and punishment that resulted in gains or was non-costly. Higher activation in the pre-SMA during costly punishment might suggest increased motor conflict when deciding to punish the excluders compared with forms of punishment that incur no costs or yield gains (Garavan et al., 2003). Inequality choices were more infrequent than equality choices in the costly inequality condition, which might be related to a possible motor conflict due to a prepotent response of choosing equality (Ridderinkhof et al., 2004). Nonetheless, after controlling for differences in punishment frequency, the pre-SMA was still more active for costly inequality than the other inequality choices. Future, studies could scrutinize whether choosing costly punishment is indeed associated with increased conflict and what the nature of this possible conflict might be. AI activity did not differ across inequality conditions. Based on the notion that the four forms of inequality reduced the recipients’ outcomes, but differed in consequences for self-gain, our results suggest that the AI might not be sensitive to consequences for self-gain when punishing norm-violators (Sanfey et al., 2003) or dividing resources unequally (Corradi-Dell’Acqua et al., 2013).
The pre-SMA/ACC and the AI are part of a network that is important for encoding representations of the physiological state of the body and the integration of cognitive and emotional processes (Singer et al., 2009; Chang et al., 2013). Activation in this ‘cingulo-insular network’ has been associated with negative affective states, such as anger (Denson et al., 2009) and disgust (Jabbi et al., 2008). The ‘Excluders inequality > Excluders equality’ contrast did not result in clusters of activation, perhaps because the brain regions associated with punishing the excluders (pre-SMA and AI) were similarly activated during forgiveness. Possibly, increased activation in the pre-SMA/ACC and insula reflects higher levels of negative affect associated with a renewed interaction with the excluders in general, or more specifically with violating a norm of equality in order to punish (Zaki and Mitchell, 2011), which may also be experienced when sharing equally with them. The pre-SMA/ACC–insula network’s involvement in deviations from a default response pattern (van den Bos et al., 2009; Güroğlu et al., 2010) was also supported by two findings in this study: (i) participants who punished more often recruited the pre-SMA/ACC and insula when they forgave the excluders and (ii) people who less often opted for costly punishment exhibited greater activation in the pre-SMA and right insula when they chose costly punishment.
No activation in reward-related brain regions (e.g. striatum or orbitofrontal cortex) was found when participants punished the excluders, which may be due to methodological differences between our Dictator Game and other punishment paradigms used in previous studies, e.g. classic costly punishment paradigms (Strobel et al., 2011; Baumgartner et al., 2012) or administration of electric shocks to norm-violators (Singer et al., 2006; Hein et al., 2010).
People high and low in trait perspective-taking were similarly hurt by exclusion, but people who reported higher levels of perspective-taking skills more often decided to forgive the excluders despite their hurt feelings. Forgiveness, which has been defined as an attempt to preserve the relationship with a norm-violator despite prior inflictions of harm (McCullough et al., 2013), has been associated with motivational changes, including (i) becoming less motivated to retaliate against a wrongdoer and (ii) becoming more concerned with the wrongdoer’s well-being (McCullough et al., 1997, 1998, 2003). It is plausible that both of these motivations apply to our behavioral index of ‘forgiveness’. Moreover, sharing equally with excluders is likely to result from a non-strategic prosocial motivation, because decisions in the Dictator Game were not confounded by strategic considerations to ultimately maximize personal gains and the amount of money participants gave to the excluders could not be influenced by the excluders (e.g. through rejection or punishment). This, in combination with the positive relationship with perspective-taking, suggests that sharing equally with the excluders is a prosocial tendency, which is likely to reflect an attempt to affiliate with the excluders (McCullough et al., 1997; Molden and Maner, 2013).
It has been argued that the ‘perceived likelihood of affiliation’ is a critical precondition for initiating efforts at social reconnection based on findings showing that people gave less money to a new interaction partner after being rejected when they expected not to actually meet their new partner face-to-face (Maner et al., 2007; Molden and Maner, 2013). In this study, participants were told that the recipients in the Dictator Game were unfamiliar, anonymous others and that there would be no face-to-face interaction after the experiment. An important consideration for future research is how expectations about future interactions with the excluders might influence forgiveness behavior and its neural correlates.
When participants forgave the excluders, they recruited regions of the ‘mentalizing network’, such as the left and right TPJ and the dmPFC and regions involved in cognitive conflict and control, such as the dACC and the lateral PFC. Although activation in the mentalizing network has previously been linked to forgiveness of moral transgressions in hypothetical scenarios (Young and Saxe, 2009), here we show for the first time that bilateral TPJ and dmPFC are activated during actual forgiveness behavior involving real costs and benefits for self and offenders. A positive relationship between punishment frequency and activation in these regions suggests that people who punished more often might engage in increased mental state reasoning (Koster-Hale and Saxe, 2013) or perspective-taking (Lamm et al., 2007) when forgiving. Forgiving was furthermore associated with activation in brain regions implicated in cognitive conflict and control (dACC and lateral PFC). These regions are activated when people counter their own response tendencies, for instance when they overcome a selfish impulse (Knoch et al., 2006) or when they share equally with unfair people (Brüne et al., 2013). A role for cognitive control in forgiveness of excluders is in line with recent findings showing that people who performed relatively worse on an external measure of cognitive control were more likely to aggress against excluders than high performers (Chester et al., 2013). Taken together, activation in the mentalizing network and control-related brain regions during equal sharing with excluders suggests that higher demands on mental state reasoning have to be met and that possibly a prepotent response to retaliate has to be controlled in order to forgive excluders.
Several limitations to this study should be noted. First, the amount of trials varied across conditions due to the participants’ relatively stable decision-making patterns. Second, although a recent study used a similar operationalization of forgiveness (Brüne et al., 2013), we did not collect self-report measures of trait forgiveness to validate our index of forgiveness. Further research is thus required to validate our measure of ‘forgiveness’ by linking it to cognitive and motivational aspects associated with forgiveness and to determine in what way our measure reflects an attempt at reaffiliation after being excluded.
Despite these limitations, the current results advance our understanding of the neural correlates of social interactions with excluders. Such insights are of crucial importance to understand how social exclusion exerts its detrimental effect on people’s lives. That is, chronic peer rejection has been associated with detrimental consequences for mental health and is further related to lower levels of prosocial behavior (Cillessen and Rose, 2005) and higher levels of aggression (Dodge et al., 2003). Such behavioral problems contribute to a mutually reinforcing pathway between repeated instances of rejection and increasingly more behavioral problems, which might exacerbate the psychosocial problems associated with rejection (Sturaro et al., 2011). Importantly, interventions that train aggressive victims to take their bullies perspective and to forgive them improve behavioral adjustment and psychological well-being (Park et al., 2013). Ultimately, a mechanistic understanding of the reciprocal relationship between aggressive (e.g. punishing) and prosocial (e.g. forgiving) responses to exclusion and neural and cognitive development has the potential to give us more insights on what might be the best way to act on social exclusion.
SUPPLEMENTARY DATA
Supplementary data are available at SCAN online.
Acknowledgments
The authors would like to thank Anneke de Gier, Marthe de Jong, Eduard Klapwijk, Cédric Koolschijn and Sandy Overgaauw for their assistance during data collection and Bregtje Gunther Moor for advice on data analysis.
This work was supported by the Netherlands Organization for Scientific Research (NWO; grant number 056-34-010 to E.A.C. and grant number 451-10-021 to B.G.).
Footnotes
1 We included a prosocial inequality condition (where inequality offers would result in sharing more than half of the stake) in order to avoid automaticity in responding, such that inequality for excluders always indicated punishment. Thus, it served as a ‘filler condition’ to prevent predictability of the task, and keep participants engaged. We excluded the prosocial inequality condition from the analyses investigating punishment and forgiveness because the prosocial inequality condition did not offer participants the opportunity to punish (because excluders’ outcomes could not be reduced) nor to forgive (as there is no possibility to refrain from punishment).
2 Univariate analyses on the separate needs and mood constructs demonstrated that each need and each mood construct yielded the same results as the overall indexes.
REFERENCES
- Baumeister RF, Leary MR. The need to belong—desire for interpersonal attachments as a fundamental human-motivation. Psychological Bulletin. 1995;117:497–529. [PubMed] [Google Scholar]
- Baumgartner T, Gotte L, Gugler R, Fehr E. The mentalizing network orchestrates the impact of parochial altruism on social norm enforcement. Human Brain Mapping. 2012;33:1452–69. doi: 10.1002/hbm.21298. [DOI] [PMC free article] [PubMed] [Google Scholar]
- Bolling DZ, Pitskel NB, Deen B, et al. Dissociable brain mechanisms for processing social exclusion and rule violation. Neuroimage. 2011;54:2462–71. doi: 10.1016/j.neuroimage.2010.10.049. [DOI] [PMC free article] [PubMed] [Google Scholar]
- Brett M, Anton J-L, Valabregue R, Poline J-B. 2002. Region of interest analysis using an SPM toolbox [abstract] Presented at the 8th International Conference on Functional Mapping of the Human Brain, June 2–6, 2002, Sendai, Japan. Available on CD-ROM in NeuroImage, 16, Abstract No. 497. [Google Scholar]
- Brown RP. Measuring individual differences in the tendency to forgive: construct validity and links with depression. Personality & Social Psychology Bulletin. 2003;29:759–71. doi: 10.1177/0146167203029006008. [DOI] [PubMed] [Google Scholar]
- Brüne M, Juckel G, Enzi B. “An eye for an eye”? Neural correlates of retribution and forgiveness. PLoS One. 2013;8:e73519. doi: 10.1371/journal.pone.0073519. [DOI] [PMC free article] [PubMed] [Google Scholar]
- Chang LJ, Yarkoni T, Khaw MW, Sanfey AG. Decoding the role of the insula in human cognition: functional parcellation and large-scale reverse inference. Cerebral Cortex. 2013;23:739–49. doi: 10.1093/cercor/bhs065. [DOI] [PMC free article] [PubMed] [Google Scholar]
- Chester DS, Eisenberger NI, Pond RS, Jr, Richman SB, Bushman BJ, DeWall CN. The interactive effect of social pain and executive functioning on aggression: an fMRI experiment. Social Cognitive and Affective Neuroscience. 2013 doi: 10.1093/scan/nst038. [DOI] [PMC free article] [PubMed] [Google Scholar]
- Cillessen AHN, Rose AJ. Understanding popularity in the peer system. Current Directions in Psychological Science. 2005;14:102–5. [Google Scholar]
- Corradi-Dell’Acqua C, Civai C, Rumiati RI, Fink GR. Disentangling self- and fairness-related neural mechanisms involved in the ultimatum game: an fMRI study. Social Cognitive and Affective Neuroscience. 2013;8:424–31. doi: 10.1093/scan/nss014. [DOI] [PMC free article] [PubMed] [Google Scholar]
- Dale AM. Optimal experimental design for event-related fMRI. Human Brain Mapping. 1999;8:109–14. doi: 10.1002/(SICI)1097-0193(1999)8:2/3<109::AID-HBM7>3.0.CO;2-W. [DOI] [PMC free article] [PubMed] [Google Scholar]
- Davis MH. Measuring individual-differences in empathy—evidence for a multidimensional approach. Journal of Personality and Social Psychology. 1983;44:113–26. [Google Scholar]
- De Quervain D. The neural basis of altruistic punishment. Science. 2004;305:1254–8. doi: 10.1126/science.1100735. [DOI] [PubMed] [Google Scholar]
- Denson TF, Pedersen WC, Ronquillo J, Nandy AS. The angry brain: neural correlates of anger, angry rumination, and aggressive personality. Journal of Cognitive Neuroscience. 2009;21:734–44. doi: 10.1162/jocn.2009.21051. [DOI] [PubMed] [Google Scholar]
- Dodge KA, Lansford JE, Burks VS, et al. Peer rejection and social information-processing factors in the development of aggressive behavior problems in children. Child Development. 2003;74:374–93. doi: 10.1111/1467-8624.7402004. [DOI] [PMC free article] [PubMed] [Google Scholar]
- Eisenberger NI, Lieberman MD, Williams KD. Does rejection hurt? An fMRI study of social exclusion. Science. 2003;302:290–2. doi: 10.1126/science.1089134. [DOI] [PubMed] [Google Scholar]
- Exline JJ, Baumeister RF, Zell AL, Kraft AJ, Witvliet CV. Not so innocent: does seeing one’s own capacity for wrongdoing predict forgiveness? Journal of Personality and Social Psychology. 2008;94:495–515. doi: 10.1037/0022-3514.94.3.495. [DOI] [PubMed] [Google Scholar]
- Fareri DS, Chang LJ, Delgado MR. Effects of direct social experience on trust decisions and neural reward circuitry. Frontiers in Neuroscience. 2012;6:148. doi: 10.3389/fnins.2012.00148. [DOI] [PMC free article] [PubMed] [Google Scholar]
- Garavan H, Ross TJ, Kaufman J, Stein EA. A midline dissociation between error-processing and response-conflict monitoring. Neuroimage. 2003;20:1132–9. doi: 10.1016/S1053-8119(03)00334-3. [DOI] [PubMed] [Google Scholar]
- Gunther Moor B, Güroğlu B, Op de Macks ZA, Rombouts SARB, Van der Molen MW, Crone EA. Social exclusion and punishment of excluders: neural correlates and developmental trajectories. Neuroimage. 2012;59:708–17. doi: 10.1016/j.neuroimage.2011.07.028. [DOI] [PubMed] [Google Scholar]
- Güroğlu B, van den Bos W, Rombouts SA, Crone EA. Unfair? It depends: neural correlates of fairness in social context. Social Cognitive and Affective Neuroscience. 2010;5:414–23. doi: 10.1093/scan/nsq013. [DOI] [PMC free article] [PubMed] [Google Scholar]
- Güroğlu B, Will G-J, Klapwijk ET. Some bullies are more equal than others: peer relationships modulate altruistic punishment of bullies after observing ostracism. International Journal of Developmental Science. 2013;7:13–23. [Google Scholar]
- Hein G, Silani G, Preuschoff K, Batson CD, Singer T. Neural responses to ingroup and outgroup members’ suffering predict individual differences in costly helping. Neuron. 2010;68:149–60. doi: 10.1016/j.neuron.2010.09.003. [DOI] [PubMed] [Google Scholar]
- Hillebrandt H, Sebastian C, Blakemore SJ. Experimentally induced social inclusion influences behavior on trust games. Cognitive Neuroscience. 2011;2:27–33. doi: 10.1080/17588928.2010.515020. [DOI] [PubMed] [Google Scholar]
- Jabbi M, Bastiaansen J, Keysers C. A common anterior insula representation of disgust observation, experience and imagination shows divergent functional connectivity pathways. PLoS One. 2008;3:e2939. doi: 10.1371/journal.pone.0002939. [DOI] [PMC free article] [PubMed] [Google Scholar]
- Knoch D, Pascual-Leone A, Meyer K, Treyer V, Fehr E. Diminishing reciprocal fairness by disrupting the right prefrontal cortex. Science. 2006;314:829–32. doi: 10.1126/science.1129156. [DOI] [PubMed] [Google Scholar]
- Koster-Hale J, Saxe R. Theory of mind: a neural prediction problem. Neuron. 2013;79:836–48. doi: 10.1016/j.neuron.2013.08.020. [DOI] [PMC free article] [PubMed] [Google Scholar]
- Lamm C, Batson CD, Decety J. The neural substrate of human empathy: effects of perspective-taking and cognitive appraisal. Journal of Cognitive Neuroscience. 2007;19:42–58. doi: 10.1162/jocn.2007.19.1.42. [DOI] [PubMed] [Google Scholar]
- Lelieveld G-J, Gunther Moor B, Crone EA, Karremans JC, van Beest I. A penny for your pain? The financial compensation of social pain after exclusion. Social Psychological and Personality Science. 2013;4:206–14. [Google Scholar]
- Lieberman MD, Cunningham WA. Type I and Type II error concerns in fMRI research: re-balancing the scale. Social Cognitive and Affective Neuroscience. 2009;4:423–8. doi: 10.1093/scan/nsp052. [DOI] [PMC free article] [PubMed] [Google Scholar]
- Maner JK, DeWall CN, Baumeister RF, Schaller M. Does social exclusion motivate interpersonal reconnection? Resolving the “porcupine problem.”. Journal of Personality and Social Psychology. 2007;92:42–55. doi: 10.1037/0022-3514.92.1.42. [DOI] [PubMed] [Google Scholar]
- Masten C, Eisenberger N, Borofsky L, et al. Neural correlates of social exclusion during adolescence: understanding the distress of peer rejection. Social Cognitive and Affective Neuroscience. 2009;4:143–57. doi: 10.1093/scan/nsp007. [DOI] [PMC free article] [PubMed] [Google Scholar]
- McCullough ME, Fincham FD, Tsang JA. Forgiveness, forbearance, and time: the temporal unfolding of transgression-related interpersonal motivations. Journal of Personality and Social Psychology. 2003;84:540–57. doi: 10.1037//0022-3514.84.3.540. [DOI] [PubMed] [Google Scholar]
- McCullough ME, Kurzban R, Tabak BA. Cognitive systems for revenge and forgiveness. Behavioral and Brain Sciences. 2013;36:1–15. doi: 10.1017/S0140525X11002160. [DOI] [PubMed] [Google Scholar]
- McCullough ME, Rachal KC, Sandage SJ, Worthington EL, Jr, Brown SW, Hight TL. Interpersonal forgiving in close relationships: II. Theoretical elaboration and measurement. Journal of Personality and Social Psychology. 1998;75:1586–603. doi: 10.1037//0022-3514.75.6.1586. [DOI] [PubMed] [Google Scholar]
- McCullough ME, Worthington EL, Jr, Rachal KC. Interpersonal forgiving in close relationships. Journal of Personality and Social Psychology. 1997;73:321–36. doi: 10.1037//0022-3514.73.2.321. [DOI] [PubMed] [Google Scholar]
- Molden DC, Maner JK. How and when exclusion motivates social reconnection. In: DeWall CN, editor. The Oxford Handbook of Social Exclusion. Oxford: Oxford University Press; 2013. [Google Scholar]
- Park J-H, Enright RD, Essex MJ, Zahn-Waxler C, Klatt JS. Forgiveness intervention for female South Korean adolescent aggressive victims. Journal of Applied Developmental Psychology. 2013;34:268–76. [Google Scholar]
- Ridderinkhof KR, Ullsperger M, Crone EA, Nieuwenhuis S. The role of the medial frontal cortex in cognitive control. Science. 2004;306:443–7. doi: 10.1126/science.1100301. [DOI] [PubMed] [Google Scholar]
- Sanfey AG, Rilling JK, Aronson JA, Nystrom LE, Cohen JD. The neural basis of economic decision-making in the ultimatum game. Science. 2003;300:1755–8. doi: 10.1126/science.1082976. [DOI] [PubMed] [Google Scholar]
- Sebastian CL, Tan GCY, Roiser JP, Viding E, Dumontheil I, Blakemore S-J. Developmental influences on the neural bases of responses to social rejection: implications of social neuroscience for education. Neuroimage. 2011;57:686–94. doi: 10.1016/j.neuroimage.2010.09.063. [DOI] [PubMed] [Google Scholar]
- Singer T, Critchley HD, Preuschoff K. A common role of insula in feelings, empathy and uncertainty. Trends in Cognitive Sciences. 2009;13:334–40. doi: 10.1016/j.tics.2009.05.001. [DOI] [PubMed] [Google Scholar]
- Singer T, Seymour B, O’Doherty JP, Stephan KE, Dolan RJ, Frith CD. Empathic neural responses are modulated by the perceived fairness of others. Nature. 2006;439:466–9. doi: 10.1038/nature04271. [DOI] [PMC free article] [PubMed] [Google Scholar]
- Steinbeis N, Bernhardt BC, Singer T. Impulse control and underlying functions of the left DLPFC mediate age-related and age-independent individual differences in strategic social behavior. Neuron. 2012;73:1040–51. doi: 10.1016/j.neuron.2011.12.027. [DOI] [PubMed] [Google Scholar]
- Strobel A, Zimmermann J, Schmitz A, et al. Beyond revenge: neural and genetic bases of altruistic punishment. Neuroimage. 2011;54:671–80. doi: 10.1016/j.neuroimage.2010.07.051. [DOI] [PubMed] [Google Scholar]
- Sturaro C, van Lier PAC, Cuijpers P, Koot HM. The Role of peer relationships in the development of early school-age externalizing problems. Child Development. 2011;82:758–65. doi: 10.1111/j.1467-8624.2010.01532.x. [DOI] [PubMed] [Google Scholar]
- Twenge JM, Baumeister RF, DeWall CN, Ciarocco NJ, Bartels JM. Social exclusion decreases prosocial behavior. Journal of Personality and Social Psychology. 2007;92:56–66. doi: 10.1037/0022-3514.92.1.56. [DOI] [PubMed] [Google Scholar]
- van Beest I, Williams KD. When inclusion costs and ostracism pays, ostracism still hurts. Journal of Personality and Social Psychology. 2006;91:918–28. doi: 10.1037/0022-3514.91.5.918. [DOI] [PubMed] [Google Scholar]
- van den Bos W, van Dijk E, Westenberg M, Rombouts SARB, Crone EA. What motivates repayment? Neural correlates of reciprocity in the Trust Game. Social Cognitive and Affective Neuroscience. 2009;4:294–304. doi: 10.1093/scan/nsp009. [DOI] [PMC free article] [PubMed] [Google Scholar]
- Wesselmann ED, Wirth JH, Mroczek DK, Williams KD. Dial a feeling: Detecting moderation of affect decline during ostracism. Personality and Individual Differences. 2012;53:580–6. doi: 10.1016/j.paid.2012.04.039. [DOI] [PMC free article] [PubMed] [Google Scholar]
- Will G-J, van den Bos W, Crone EA, Güroğlu B. Acting on observed social exclusion: developmental perspectives on punishment of excluders and compensation of victims. Developmental Psychology. 2013;49:2236–44. doi: 10.1037/a0032299. [DOI] [PubMed] [Google Scholar]
- Williams KD. Ostracism. Annual Review of Psychology. 2007;58:425–52. doi: 10.1146/annurev.psych.58.110405.085641. [DOI] [PubMed] [Google Scholar]
- Williams KD, Cheung CKT, Choi W. Cyberostracism: effects of being ignored over the Internet. Journal of Personality and Social Psychology. 2000;79:748–62. doi: 10.1037//0022-3514.79.5.748. [DOI] [PubMed] [Google Scholar]
- Young L, Saxe R. Innocent intentions: a correlation between forgiveness for accidental harm and neural activity. Neuropsychologia. 2009;47:2065–72. doi: 10.1016/j.neuropsychologia.2009.03.020. [DOI] [PubMed] [Google Scholar]
- Zadro L, Williams K, Richardson R. How low can you go? Ostracism by a computer is sufficient to lower self-reported levels of belonging, control, self-esteem, and meaningful existence. Journal of Experimental Social Psychology. 2004;40:560–7. [Google Scholar]
- Zaki J, Mitchell JP. Equitable decision making is associated with neural markers of intrinsic value. Proceedings of the National Academy of Sciences of the United States of America. 2011;108:19761–6. doi: 10.1073/pnas.1112324108. [DOI] [PMC free article] [PubMed] [Google Scholar]
Associated Data
This section collects any data citations, data availability statements, or supplementary materials included in this article.