

Abstract
Older adults show a ‘positivity bias’ in tasks involving emotion and self-referential processing. A critical network that is involved in self-referencing and shows age-related decline is the default network (DN). The purpose of the current study was to investigate age differences in pre- and post-task DN functional connectivity (FC) and signal variability, and to examine whether they are predictive of the positivity bias in self-referencing. We measured FC and within-subject variability of the DN in resting-state scans preceding and following tasks involving personality judgements on the self and a close other. Older adults endorsed more positive traits than younger adults on both tasks. FC was weaker post-task in older vs younger adults, and younger adults had greater variability than older adults in DN nodes. Younger adults with higher post-task DN variability had more negative self-ratings. For both age groups, greater FC in the DN was associated with more negative self-ratings. Neither FC nor variability was related to other ratings, despite the potential for self-processing when making other judgements. Our findings suggest that ageing leads to reduced FC and variability in the DN, which is most apparent after task, and may be one mechanism underlying the positive bias with age.
Keywords: ageing, default network, resting state, self-referential processing, positivity effect
INTRODUCTION
Unlike many cognitive functions that decline with age, older adults perform comparably to young adults on tasks involving self-judgement and perspective taking (Keightley et al., 2006; Ruby et al., 2009), and show a benefit in their memory for items that are self-relevant, as do younger individuals (Gutchess et al., 2007; Glisky and Marquine, 2009). Despite preserved social and emotional cognition with age, differences emerge in the biases that young and older adults express in response to emotionally valenced information. In general, young adults have better attention to and memory for negative items, whereas older adults are biased towards positive over negative and neutral information (Charles et al., 2003; Mather and Carstensen, 2003; Kennedy et al., 2004; Thomas and Hasher, 2006; Mikels et al., 2008; Spaniol et al., 2008). This effect in older adults is known as the ‘positivity’ effect. According to the socioemotional selectivity theory (SST), the switch from a negative to positive emotional bias over the lifespan results from a shift in motivational goals that occur as older adults realise that the end of life is near (Carstensen et al., 1999, 2003). It is believed that this switch causes older adults to engage in cognitive control processes that reduce negative effect and maintain positive affect (for discussion see Mather and Carstensen, 2005). One specific type of controlled mechanism that may contribute to the positivity effect in older adults is their increased tendency to process positive information in a self-referential manner (see Kensinger and Leclerc, 2009 for review).
Neuroimaging results demonstrate that self-referential processing contributes to the positivity effect in older adults. Research has shown that brain regions that are important for processing information in reference to oneself, including the ventral medial prefrontal cortex (vmPFC), anterior cingulate cortex (ACC) and precuneus (for review see Northoff and Bermpohl, 2004), are more active in response to negative information in the young (Leclerc and Kensinger, 2008) and more responsive to positive information in older adults (Gutchess et al., 2007; Kensinger and Schacter, 2008; Leclerc and Kensinger, 2008). Greater recruitment of midline structures for older adults was also correlated with better memory for positive items (Kensinger and Schacter, 2008). These findings suggest that older adults are more likely to process positive information in relation to themselves than are younger adults, and this type of self-referential processing may be a factor in older adults’ positivity bias.
Although the neuroimaging work regarding self-referential processing and ageing mentioned above, as well as other studies on emotion in older adults, (Mather et al., 2004; Ritchey et al., 2011; Winecoff et al., 2011) have focused mainly on activity within specific brain regions, there has been much attention recently on the identification of large-scale brain networks in resting-state and task-based functional magnetic resonance imaging (fMRI) studies (Biswal et al., 1995; Greicius et al., 2003; Damoiseaux et al., 2006). A network that has been frequently reported in these studies is the default network (DN), which consists of a group of brain regions that are highly interconnected functionally, including the vmPFC, ACC, posterior cingulate cortex (PCC), retrosplenial cortex, angular gyrus and regions of the medial temporal lobe (MTL, Greicius et al., 2003, 2004; Fox et al., 2005; Buckner et al., 2008; Toro et al., 2008; Grady et al., 2010). The DN is often associated with tasks that involve social cognition (Buckner and Carroll, 2007; Schilbach et al., 2008; Grigg and Grady, 2010a; Spreng and Grady, 2010) and many of the areas that make up the DN, as described earlier, are also recruited during tasks that require self-referential processing. For example, the vmPFC is engaged during the execution of theory of mind tasks and when making decisions about one’s self (Craik et al., 1999; Kelley et al., 2002; Fossati et al., 2004; Mitchell et al., 2009; Spreng et al., 2009; Andrews-Hanna et al., 2010; Gutchess et al., 2010), and the MTL and midline parietal cortex are associated with autobiographical memory retrieval (Addis et al., 2004; Levine et al., 2004; Burianova and Grady, 2007). Heightened activity within the DN has also been linked to depression (Greicius et al., 2007; Sheline et al., 2009; Hamilton et al., 2011; Zhu et al., 2012) and specifically relates to negative rumination and maladaptive self-reflection (Hamilton et al., 2011; Zhu et al., 2012). Because the DN supports self-referential processing, including negative self-reflection, it is an important network to consider when investigating the positivity effect in ageing.
Furthermore, the DN is altered with age, and these changes may contribute to the reported shift away from negative information towards positive information. For instance, when carrying out an external task older adults fail to deactivate the DN to the same degree as younger adults (Grady, et al., 2006; Persson et al., 2007; Esposito et al., 2008; Park et al., 2010) and functional connectivity (FC) of the DN at rest is significantly reduced in older compared with younger adults (Andrews-Hanna et al., 2007; Hedden et al., 2009; Grady et al., 2010; Park et al., 2010; Allen et al., 2011). In addition, FC of the DN is weaker for older vs younger adults during tasks that require self-reference (Grady et al., 2012). Findings such as these suggest that the DN is sensitive to ageing, and perhaps, such age-related differences in the DN may underlie changes in self-referencing that are reflected in the positivity effect in older adults.
Although no study to date has investigated whether age-related changes in the DN at rest relate to self-referential processing, research has shown that FC between DN regions at rest is linked to scores on neuropsychological tests administered outside of the scanner (Andrews-Hanna et al., 2007; Damoiseaux et al., 2008; Wang et al., 2010), as well as on memory and attention tasks administered in a later functional run (Hampson et al., 2006; Kelly et al., 2008; Wang et al., 2010; Sala-Llonch et al., 2012). Recent work has demonstrated that resting-state FC of the DN can be modulated by preceding task demands, including language (Waites et al., 2005; Hasson et al., 2009) and self-referencing (Grigg and Grady, 2010b) tasks. Areas that are involved in task-related processing are the areas with post-task modulations of resting-state FC, and this modulation is related to behaviour (Stevens et al., 2010; Tambini et al., 2010). In summary, resting-state FC is dynamic and both pre- and post-task FC may be as relevant to behaviour as activity measured during the task.
Most of the studies cited above have focused solely on age differences of mean activity or FC across regions within a network, yet more recent findings have established the importance of the inherent variability of fMRI signals (i.e., the blood oxygen-level dependent (BOLD) responses). Variability of brain function, including within-subject variability of the BOLD signal, is believed to reflect greater neural efficiency and enhanced information processing (for a review see Garrett et al., 2013). BOLD variability is reduced with age, and this reduction is related to poorer task performance, consistent with the idea of an age-related reduction in the dynamic range of neural processing (Garrett et al., 2010, 2011, 2012). Indeed, variability in BOLD responses was reported to be more predictive of behaviour than mean activity on tasks involving perceptual and working memory function (Garrett et al., 2010). Although BOLD variability has not been examined in the context of social cognition, reduced variability in older adults could limit the efficiency of the DN and in turn impact self-referential processing in older adults. Thus, a full exploration of cognitive ageing is likely to require inclusion of measures of mean activity, FC and variability.
The present study sought to determine whether there are age differences in the influence of prior tasks on the DN and whether these modulations are predictive of self-referential processing in young and older adults. We used a multivariate approach (partial-least squares (PLS), McIntosh et al., 1996; McIntosh and Lobaugh, 2004) to assess the whole-brain FC of the vmPFC and PCC both before and after participants engaged in a series of self-referential and non-self tasks (Grigg and Grady, 2010b). The self-related tasks involved personality judgements of the self and a close other, so that the latter might resemble the former in its relation to FC to the extent that it involved some dependence on self-reference. We previously found that mean activity in the DN did not differ between these two conditions in either young or older adults (Grigg and Grady, 2010b; Grady et al., 2012). Having two seeds, one in the anterior cortex and one in the posterior cortex, allowed us to examine whether age effects in the DN were similar regardless of seed choice. On the basis of previous studies showing that the functional integrity of the DN declines with age, both at rest (Andrews-Hanna et al., 2007, Hedden et al., 2009, Grady et al., 2010; Park et al., 2010; Allen et al., 2011) and during a self-reference task (Grady et al., 2012), we hypothesised that older adults would show a reduction in their FC of the DN when compared with younger adults, and that this reduction would be most pronounced during the post-task resting state, in line with evidence that older adults are less efficient at modulating network activity (Goldberger et al., 2002; Garrett et al., 2012). We also expected to replicate our earlier work (Garrett et al., 2010, 2011), by finding reduced variability in DN nodes in older relative to young adults.
To assess whether FC (pair-wise correlation between the PCC and vmPFC) and variability [standard deviations (s.d.) of BOLD] were predictive of self-referential processing, we computed individual measures of each variable and investigated their relationship to behaviour. We expected that FC and variability of the DN would be related to behavioural measures, based on prior work showing such relations between resting FC and behaviour (Hampson et al., 2006; Kelly et al., 2008; Wang et al., 2010) and earlier studies reporting that variability in brain activity was a significant predictor of performance (Garrett et al., 2012). We predicted that stronger FC and greater variability of the DN would be associated with more negative judgements about the self and perhaps also with negative assessments of a close other, reflecting age reductions in FC and variability as well as an age increase in positive judgements. This hypothesis was based on prior work whereby heightened activity within the DN was associated with higher rates of negative self-referencing and depression (Greicius et al., 2007; Sheline et al., 2009; Hamilton et al., 2011; Zhu et al., 2012). Our aim was thus to demonstrate a relationship between resting FC, and/or variability of the DN, and self-referencing, to test the hypothesis that intrinsic DN function would be associated with valence biases in younger and older adults.
METHODS
Participants
A total of 20 young adults and 20 older adults participated in the study. One young adult and three older adults were removed from the analysis due to technical problems or excessive movement. Of the 17 older adults, only the second resting-state run could be used for two older adults due to technical problems during the first run. Behavioural data on the tasks were unavailable for 1 young and 3 older adults, leaving 18 young and 13 older adults available for the analyses assessing the relation between brain and behaviour.
Older adults were healthy with no reported history of diabetes or untreated hypertension. They scored within the normal range (≥26 out of 30) on the Mini Mental State Exam (Folstein et al., 1975). Older adults had a similar level of education to younger adults and had higher scores on the Mill Hill Vocabulary Test (Raven et al., 1988; see Table 1). All participants were right handed and provided informed consent. The Research Ethics Board of Baycrest Centre approved this study.
Table 1.
Mean (s.d.) for each demographic and task variable
| Variable | Younger adults | Older adults | T value | Significance |
|---|---|---|---|---|
| Demographics | ||||
| Age | 23.7 (3.1) | 71.2 (5.0) | ||
| Education | 14.7 (2.4) | 16.1 (2.3) | −1.8 | 0.070 |
| Vocabulary | 19.4 (4.6) | 24.3 (4.5) | −3.2 | 0.003 |
| Proportion of yes responses | ||||
| Self (positive minus negative) | 0.70 (0.15) | 0.84 (0.11) | −2.6 | 0.014 |
| Other (positive minus negative) | 0.53 (0.34) | 0.82 (0.10) | −3.1 | 0.005 |
Scanning session
The entire scanning session lasted ∼1 h and 10 min and consisted of a high-resolution structural scan followed by 10 functional runs. The first and last run were resting-state runs (5:40 min), where participants were instructed to lie still in the scanner with their eyes closed, relax and to think of anything that came to mind, but not to fall asleep. They were questioned after scanning to ensure that they had stayed awake.
Eight functional task runs were administered between the two resting-state runs. There were four task types: self-reference, other-reference, vowel identification and motor. In each task, a personality trait word was presented on a screen along with a prompt for how to respond. The personality trait words consisted of an equal number of positive, neutral and negative words, based on valence ratings previously established by Anderson (1968). The self-condition required participants to judge whether a word represented them or not, the other condition asked subjects to decide whether the word represented someone they knew well and the vowel identification required identifying whether the third letter from the end of the word was a vowel, and in the motor task, participants pressed the first or second key depending on whether the number 1 or 2 appeared on the screen. For a full description of the tasks and of task-related brain results, please refer to Grady et al. (2012).
Image acquisition
Scans were collected using a Siemens Trio 3T scanner. Anatomical scans were obtained with a 3D MP-Rage Sequence (repetition time (TR) = 2 s, echo time (TE) = 2.63 ms, field of view (FOV) = 25.6 cm2, 256 × 256 matrix, 160 slices of 1-mm thickness) and functional runs with an echo planar imaging (EPI) sequence (170 volumes, TR=2 s, TE = 30 ms, flip angle = 70°, FOV=20 cm2, 64 × 64 matrix, 30 slices of 5-mm thickness). Pulse and respiration were measured during scanning.
Data preprocessing
Pre-processing was performed with Analysis of Functional Neuroimages (AFNI) software (Cox, 1996) and included physiological correction for pulse and respiration (Glover et al., 2000), slice timing and rigid body motion correction, spatial normalisation to the Montreal Neurological Institute (MNI) template (re-sampling to 4-mm isotopic voxels) and smoothing (full width half-maximum, 6 mm). White matter and CSF signals were regressed out of the data (Grady et al., 2010).
Because motion has recently been shown to influence measures of FC (Power et al., 2012; van Dijk et al., 2012), we removed images that appeared to be influenced unduly by motion, even after motion correction (‘spikes’). We took an approach similar to that described by Power et al. (2012), who removed images that were determined to be outliers on the basis of the six motion parameter estimates recorded for each subject and were displaced based on assessing voxel intensity changes in each brain volume, across each time course. We tested for outliers by identifying and removing time points that were outliers in both the six rigid-body motion parameter estimates (MPEs), and in the fMRI signal using a multivariate approach. For an fMRI data matrix Xfmri (with dimensions Nvoxels × Ntime) with a matrix of MPE time courses Xmpe (6 × Ntime), we carried out the following adaptive and robust procedure on the pre-processed time courses for each participant:
(We decomposed Xfmri and Xmpe using principal component analysis (PCA) and represented the data in principal component (PC) space coordinates as Qfmri (with dimensions Ntime × Ntime) and Qmpe (6 × Ntime). This step reduces the dimensionality of the data.
For each PC-space data point qt (1 ≤ t ≤ Ntime), we computed the median PC-space coordinate vector qmed(t) in a 15-TR time window centred at t. We then obtained the squared Euclidean distance
 . This measures the displacement of qt away from surrounding data points; a point qt with larger displacement dt is more likely to be an outlier. This procedure is performed for all data points in Qfmri and Qmpe, producing vectors of displacement values dfmri and dmpe, corresponding to time points in the fMRI data.
For each d, we fit a Gamma probability distribution to the data by computing the maximum likelihood estimates of the distribution parameters. We then identified time points that are outliers at P < 0.05, for both dfmri and dmpe distributions; labelled as motion outliers in the data.
We removed any outlier fMRI volumes and replaced them by interpolating voxel values from adjacent volumes, using cubic splines. This controls for potential spikes while minimizing discontinuities in the fMRI time courses due to removal of outliers.
Resting-state FC analyses
Image analysis was performed using PLS (McIntosh et al., 1996; McIntosh and Lobaugh, 2004) a multivariate analysis approach. A type of PLS analysis, known as seed-PLS, robustly identifies spatiotemporal patterns that are correlated to regional neuronal activity in a seed region as a means to assess FC. This approach is similar to other multivariate techniques, such as PCA, where latent variables (LVs) are extracted to explain the covariance between groups/conditions and brain activity.
Before analysis, we performed a temporal re-sampling of the time series, in which we averaged each consecutive 5 vols., to produce 30 vols. (TR = 10 s each). We then normalised each block to the first volume of that block and averaged all volumes of that block (Grigg and Grady, 2010b). This method of averaging produced an effective low-pass filter of 0.1 Hz and reduced temporal noise.
In seed-PLS, a correlation matrix is derived between seed activity and the activity of all other brain voxels for each block, calculated across subjects. In seed-PLS, the signal in a reference region is correlated with activity in all other brain voxels to assess the seed’s FC (McIntosh, 1999). The correlation matrix is decomposed using singular value decomposition to generate LVs, which consist of orthogonal patterns of FC, for each group across blocks. Because the decomposition of the data matrix is done in a single analytic step, no correction for multiple comparisons is required. Each brain voxel has a weight, known as a salience, which is proportional to the covariance of the voxel’s activity with the FC pattern for each specific LV. A ‘brain score’ was calculated for each participant, which is similar to component scores in PCA, by multiplying each voxel’s salience by the BOLD signal in the voxel and summing over all voxels for each participant for each block on a given LV.
The significance of each LV as a whole was determined using 500 permutation tests on the singular value associated with each LV (McIntosh et al., 1996). To determine the reliability of each voxel’s salience to the LV, saliences were submitted to a bootstrap estimation (100 bootstraps) of the standard errors (SE, Efron, 1981). Voxels were considered reliable if the ratio of salience to the SE for that voxel [bootstrap ratio (BSR)] exceeded |3.0|, which approximates a 99% confidence interval. Clusters of activity were identified if they met the BSR threshold, had a cluster size of at least 20 voxels and a minimum 10 cm distance between peaks. The maxima of these locations are reported as coordinates in MNI space.
PLS analyses were performed using the two seed regions from the DN: the vmPFC (−4 48 −12) and PCC (−4 −48 28). The coordinates for the DN regions were identified from previously reported task analyses (Grady et al., 2012). For each seed analysis, we contrasted young and older adults at pre- and post-task rest. The seed analysis involved extracting the mean signal for the seed voxel and correlating this with the signal in all other brain voxels across participants in each group at pre- and post-task rest. To provide a measure of how strongly seed activity covaried with the pattern of activity seen on each LV, correlations between brain scores and seed activity were computed for each group. Reliability of these correlations (confidence intervals of 95%) was calculated from the bootstrap procedure. To examine whether the distribution of correlations for a resting run significantly differed between groups, we used a non-parametric independent samples Mann Whitney U-test. A Wilcoxon signed ranks test was used to establish whether the distribution of correlations differed within each group between pre- and post-task rest.
Brain behaviour relationships
In order to assess brain/behaviour relations, we needed to obtain individual measures of FC in the DN (the PLS analysis calculates correlations across participants). For these individual measures of FC, we calculated the within-subject correlations of activity between the PCC and vmPFC for the DN over the 30 blocks for each resting-state run (pre- and post-task). To assess variability in each seed, we calculated the within-subject s.d. of activity in each seed across the 30 time points for pre- and post-task resting-state runs. Independent samples t-tests were carried out to establish whether differences existed in the strength of correlations and variance in brain activity between the age groups. To determine whether age and/or s.d.-predicted FC between the DN seeds, backward stepwise multiple regressions were run separately for pre- and post-task measures.
Finally, to assess whether brain measures predict behaviour, we first computed correlations between seed FC/s.d. measures and self/other ratings. To obtain a measure that incorporated ratings for both positive and negative traits, we used a difference score, i.e., the proportion of ‘yes’ responses to positive trait words minus the proportion of yes responses to negative trait words. This was done separately for self and other trials, generating two behavioural measures: one that captures the degree to which a participant endorsed positive self-traits and the second the degree to which a participant endorsed positive other traits. For these behavioural measures, a larger score indicated a stronger tendency to endorse positive personality traits for the self or the close other. Brain measures that were significantly correlated with behaviour were then entered into backward stepwise multiple regressions, along with age and the interaction of age with each measure.
RESULTS
Behaviour
Table 1 provides a summary of the proportion of yes responses (positive minus negative) in the self and other conditions. These ratings were analysed with a 2 (age group) by 2 (task) analysis of variance (ANOVA), which revealed a significant main effect of age group (P = 0.001). Neither the effect of task (P = 0.11) nor the task × age interaction (P = 0.20) was significant. Post hoc analyses found that older adults had a greater proportion of yes responses (a larger proportion of positive to negative endorsements) in both the self (P = 0.014) and other (P = 0.005) conditions, reflecting the expected positivity bias in the older group.
Resting-state FC
Resting-state FC of young and older adults during pre- and post-task rest was examined using separate seed-PLS analyses for the vmPFC and PCC nodes of the DN. In each analysis, the first LV accounted for the greatest amount of covariance; subsequent LVs each accounted for <4% of the covariance. As a result, only the first spatiotemporal FC patterns for each seed-PLS analysis will be reported.
For the vmPFC seed analysis, the first LV (P < 0.001, 35% covariance) revealed a pattern of DN areas that positively covaried with the vmPFC across both resting states, for both young and older adults (Figure 1a). The areas that covaried with the vmPFC included regions currently thought to comprise the DN, such as the PCC, superior frontal gyrus, angular gyrus, middle temporal gyrus and hippocampus (Table 2). Despite the relatively robust FC of this network in both age groups (Figure 1c), there was a trend for weaker FC post-task in older compared with younger adults (P = 0.062), while no significant age-difference was observed at pre-task rest (P = 0.745). FC in young adults increased in strength over time, with stronger FC post-task relative to pre-task rest (P = 0.047). In contrast, no significant difference between rest scans was observed for older adults.
Fig. 1.

The first LV pattern showing positive correlations between DN seed regions and resting-state brain regions, across age groups and time points. (a) Spatial FC pattern using the vmPFC seed (b) spatial FC pattern using the PCC seed. Activity in warm-colored regions (positive BSRs) indicates positive correlations between brain scores and the DN seed region (c) Correlations across time with the vmPFC. FC in younger adults was strengthened post-task relative to pre-task, while older adults maintained similar levels of FC. (d) Correlations across time with the PCC. Young and older adults show stable positive correlations between the PCC and DN regions. Older adults had weaker correlations compared with younger adults at post-task rest, using the vmPFC and PCC seed.
Table 2.
Brain regions with positive correlations to DN seed regions (vmPFC and PCC) for young and older adults at pre- and post-task rest
| Region | Hemisphere | X | Y | Z | BSR |
|---|---|---|---|---|---|
| vmPFC-correlated regions | |||||
| PCCa | Left | 0 | −48 | 24 | 28 |
| Angular gyrusa | Left | −48 | −68 | 24 | 22 |
| Middle temporal gyrus | Right | 56 | −60 | 20 | 21 |
| Middle temporal gyrusa | Left | −56 | −8 | −16 | 15 |
| Superior frontal gyrusa | Right | 20 | 44 | 40 | 14 |
| Inferior frontal gyrus | Right | 40 | 28 | −24 | 14 |
| Fusiform gyrus | Right | 28 | −40 | −16 | 14 |
| Cerebelluma | Left | −4 | −56 | −44 | 14 |
| Middle temporal gyrus | Right | 64 | −32 | −4 | 14 |
| Temporal pole | Left | −44 | 20 | −20 | 13 |
| Hippocampusa | Left | −20 | −24 | −12 | 13 |
| Hippocampusa | Right | 20 | −28 | −12 | 13 |
| Calcarine gyrus | Left | −4 | −96 | 8 | 11 |
| PCC-correlated regions | |||||
| vmPFCa | Left | 0 | 52 | −8 | 35 |
| Lateral parietal cortex (angular gyrus)a | Left | −44 | −64 | 24 | 32 |
| Lateral parietal cortex (angular gyrus)a | Right | 56 | −56 | 24 | 25 |
| Superior frontal gyrusa | Left | −20 | 36 | 40 | 21 |
| Middle temporal gyrusa | Right | 60 | 0 | −24 | 19 |
| Middle temporal gyrus | Left | −60 | −36 | 0 | 19 |
| Inferior frontal gyrus | Left | −48 | 32 | −16 | 16 |
| Middle temporal gyrusa | Right | 56 | −24 | −12 | 15 |
| Cerebellum | Right | 24 | −72 | −28 | 14 |
| Hippocampusa | Left | −16 | −24 | −8 | 14 |
| Cerebellum | Left | −28 | −76 | −28 | 14 |
| Hippocampusa | Right | 20 | −28 | −8 | 12 |
Note: MNI coordinates. BSR= 3.3 is relative to P = 0.001. X = right/left; Y = anterior/posterior; Z = superior/inferior; BSR = bootstrap ratio.
aRegion is located close to a region in the DN, according to Toro et al. (2008) and Grady et al. (2010).
The first LV in the PCC seed analysis was significant (P < 0.001, 40% covariance) and showed a pattern of positive covariance with the PCC (Figure 1b and d). Regions correlated with the PCC incorporated DN areas and showed a pattern of FC similar to that identified with the vmPFC (Table 2). The pattern of FC for the PCC was comparable in strength at pre-task for young and older adults; however, at post-task, older adults had weaker FC of the PCC pattern compared with younger individuals (P = 0.025). Both young and older adults maintained a similar level of FC for the DN across pre- and post-task rest.
Individual DN measures and regression analyses
When examining the FC, correlations between vmPFC and PCC across the resting state did not differ between younger and older individuals at pre-task rest (P =.78), but did differ at post-task rest (t(32) = 2.49, P = 0.018), with correlations being weaker in older compared with younger adults (Figure 2a). Therefore, consistent with the PLS results, young adults had stronger FC post-task between the two DN seeds than did older adults. In terms of the within-subject variability in vmPFC and PCC activity (Figure 2b), s.d. for the DN seeds were greater in younger compared with older adults before (t(32) = 2.98, P = 0.005) and after tasks (t(32) = 3.54, P = 0.001). That is, the younger adults have more variable brain activity (larger s.d.) in these DN nodes than older adults, consistent with prior work (Garrett et al., 2012).
Fig. 2.
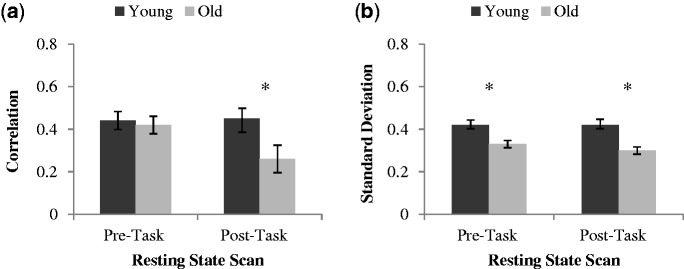
(a) Correlations and (b) s.d. between DN regions at pre- and post-task rest for younger and older adults (error bars represent the within subject standard error of the mean and asterisk represent a significant difference across age groups at P < 0.05).
Backward stepwise multiple regressions were conducted to determine whether age and/or brain variability measures would predict resting-state correlations between vmPFC and PCC. A separate analysis was generated for each resting-state run (pre- and post-task rest) using three predictors: mean variability across the two seeds, age group and the interaction of mean variability and age. The results of these analyses revealed that the final models for pre-task rest (adjusted R2 = .17, F(1, 29)=7.00, P = 0.013) and post-task rest (adjusted R2 = .41, F(1, 29)=22.06, P < 0.001) were significant. Pre-task variability within the DN seeds predicted the resting vmPFC-PCC correlations before the tasks (β = 0.44, P = 0.013) and post-task variability predicted these correlations after the tasks (β = 0.66, P < 0.001). In both cases, greater variability was associated with larger correlations between the DN regions. In these models, neither age nor the interaction of age and s.d. was a significant predictor of correlations between the DN seeds. Therefore, brain variability across resting-state runs was a significant predictor of resting-state connectivity for the DN for both age groups.
To narrow down our focus regarding which brain variables would predict behaviour, we first examined the correlations between self-ratings (positive minus negative yes responses for judgements about the self) and other ratings (positive minus negative yes responses for other-related judgements) and brain measures (pre- and post-task correlations between the vmPFC and PCC and pre- and post-task within-subject s.d. of the vmPFC and PCC). Self-ratings were significantly correlated with post-task FC between the vmPFC and PCC (r(31)= −0.495, P = 0.005) and pre- (r(31)= −0.408, P = 0.023) and post-task (r(31)= −0.554, P = 0.001) variability scores for the DN nodes. None of the brain measures was significantly correlated with other ratings. As a result, the subsequent regression analysis was carried out solely for the DN measures that related to self-ratings.
To examine the relationship between self-ratings and DN measures, a backward stepwise multiple regression analysis was conducted. The dependent variable was the proportion of yes responses for the self condition, and the independent variables were: age group, post-task correlation between PCC and vmPFC, pre-and post-task variability for the DN seeds and the interaction terms between age and these brain measures. The final model was significant (adjusted R2 = .321, F(2, 28)=8.10, P = 0.002). Positivity of responses in the self-condition was predicted by two variables, post-task FC between the two DN seeds (β = −0.32, P = 0.065) and the interaction between age and post-task s.d. of the DN seeds (β = 0.39, P = 0.028). As seen in Figure 3, stronger correlations between the vmPFC and PCC post-task were related to a lower endorsement of positive self-ratings for young and older adults. Greater post-task variability in young adults was also related to more negative self-ratings (Figure 4), whereas variability in the DN seeds in older adults was not associated with these ratings.
Fig. 3.
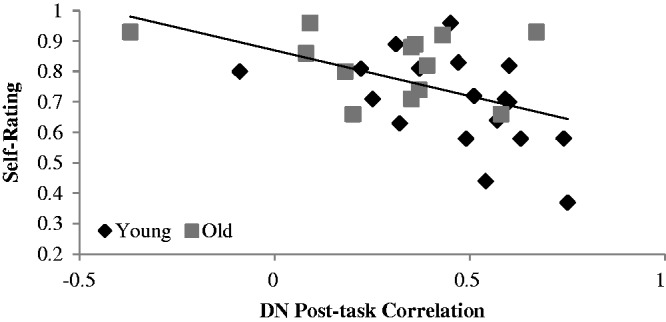
Scatter plot showing the DN post-task resting-state correlations (between the vmPFC and PCC) for each participant and the proportion of yes responses for self-ratings. Although the age groups are indicated with different symbols, the regression line has been plotted for both age groups combined, because the interaction with age was not significant. In the graph, larger values of the rating indicate more endorsements of positive traits.
Fig. 4.
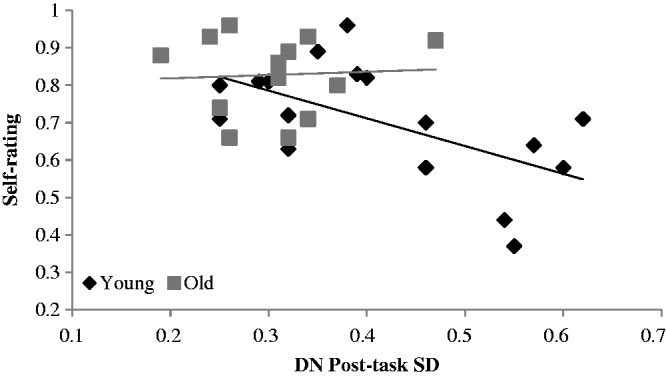
Scatter plot showing the DN post-task resting-state variability (s.d. of the vmPFC and PCC) for each participant and the proportion of yes responses for self-ratings. Because the interaction with age was significant, the regression line has been plotted separately for young and older adults. In the graph, larger values of the rating indicate more endorsements of positive traits.
DISCUSSION
Results of the current study demonstrate that the DN shows reduced FC and variability with age and that these DN measures are related to performance during a self-referencing task. Overall, older adults relative to younger adults had weaker FC and reduced variability within the DN, using both anterior and posterior seed regions, and this reduction was most pronounced after the execution of a series of self-relevant and non-self tasks. These results support prior evidence that the DN is susceptible to age-related decline and extends this work to show an inability of older adults to re-engage the DN after cognitive tasks to the same extent as young adults. In addition, stronger DN correlations post-task predicted a more negative representation of self in both groups, whereas greater variability post-task predicted a more negative representation of self only in young adults. These effects were specific to the self-task, as no significant relations between other ratings and brain measures were found. Given that older adults in the current study endorsed a more positive representation of self than did younger adults, consistent with a number of earlier studies on the positivity effect in older adults (Charles et al., 2003; Mather and Carstensen, 2003; Kennedy et al., 2004; Thomas and Hasher, 2006; Mikels et al., 2008), our findings provide support for a neural basis of this positivity effect, i.e., reduced FC and variability. Furthermore, our results highlight the importance of measuring variability of the BOLD signal, as FC was driven in part by variability.
Previous research has found that young adults modulate resting-state activity following various cognitive tasks (Waites et al., 2005; Albert et al., 2009; Hasson et al., 2009; Lewis et al., 2009; Grigg and Grady, 2010b; Stevens et al., 2010; Tambini et al., 2010). We previously reported a similar finding in young adults (Grigg and Grady, 2010b) and noted that resting DN FC was both spatially and temporally variable after tasks. Here we found that older adults had weaker FC compared with younger adults, which was more prominent after task. Although we found pre-task FC of the DN to be similar across age groups, the decline in connectivity post-task remains consistent with the literature. Earlier studies have documented that DN activity is reduced in older adults during the execution of a task (Park et al., 2010) and during periods of rest embedded within a task (Andrews-Hanna et al., 2007; Grady et al., 2010). Our result would suggest that this age difference observed in the DN might reflect a failure to fully re-establish FC, even following a series of relatively easy decision-making trials. As seen in Figure 2a, the correlations between the vmPFC and PCC become significantly reduced at post-task rest in older adults, whereas younger adults maintain the same amount of post-task FC as pre-task levels. The current results extend previous findings by establishing that age differences in FC of the DN are enhanced after cognitive processing. This demonstrates that the DN is more vulnerable to age-related decline and that this vulnerability becomes much more apparent after a cognitive challenge.
The age differences that were observed at post-task rest are likely to reflect changes that are the product of both self and non-self referential tasks, as both were administered prior to the resting-state scan. Self-referential processing in the current study, as published previously (Grady et al., 2012), activated regions associated with the DN, such as the vmPFC, PCC, ACC, parahippocampal gyrus and angular gyrus, although this activation was reduced in older adults. The coordinates chosen as representative seeds of the DN were selected from the results of those prior task analyses (Grady et al., 2012) to ensure that the regions of interest were actively being recruited during the intervening task. Consequently, the age differences observed in post-task rest relative to pre-task rest may be the result of different modulation of this network during self-referential vs non-self task conditions across age groups. Resting-state networks are dynamic, and cognitive activity appears to produce modulations of FC in these networks as well as enhance age differences in connectivity.
Compared to younger adults, elderly participants had less variable activity in DN nodes for both pre- and post-task rest. It has been suggested that a greater degree of modulation in brain activity, reflected in the variability of the brain signal, is related to a greater dynamic range in FC and to optimal cognitive function (Faisal et al., 2008; Garrett et al., 2010; McIntosh et al., 2010). These results fit with the hypothesis that ageing leads to less neural complexity and a lack of ability in older adults to respond dynamically to changing cognitive demands (Goldberger et al., 2002; Kyriazis, 2003; Takahashi et al., 2009). A novel finding was that greater variability was related to stronger FC, suggesting that reduced variability in older adults could be one reason why FC is often reduced with age. Furthermore, this reduction in brain variability cannot be accounted for by a simple effect of time or fatigue because there were age differences in DN variability during pre-task rest. It is therefore possible that variability measures reflect an intrinsic level of neural efficiency that may be more sensitive to age effects than measures of FC.
Within-subject correlations and variability of the BOLD signal involving two main nodes of the DN (i.e., vmPFC and PCC) at post-task rest were predictive of self-ratings but not other ratings, although a relation with both might have been expected given that the other task likely involved some self-reference. This finding might have been due to our focus on the vmPFC and PCC nodes for the FC and variability measures. These midline structures of the DN have been identified as crucial regions for self-relevant processing (Fossati et al., 2003; Uddin et al., 2007), and some have reported that they show greater activity in response to self vs other conditions (Ochsner et al., 2005; Johnson et al., 2006; van der Meer et al., 2010). Our result is also in line with clinical work showing an association between negative self thought and greater activity of the DN (Hamilton et al., 2011; Zhu et al., 2012), which suggests that the DN may be more engaged for thinking about the self, particularly negative aspects of the self, than about other people. Taken together with work finding strong correlations between DN activity and cognitive processing on tasks of memory and attention (Hampson et al., 2006; Andrews-Hanna et al., 2007; Damoiseaux et al., 2008; Kelly et al., 2008; Wang et al., 2010; Sala-Llonch et al., 2012), our results provide evidence that intrinsic FC of the DN at rest is a significant predictor of task performance in both young and older adults, including tasks that assess self-reference.
However, variability only accounted for the negative emotional bias in young adults but did not predict self-ratings for older individuals. Although the older adults clustered towards the lower end of the brain variability spectrum, there was considerable overlap between the age groups on the s.d. measure (see Figure 4), indicating that a type of floor effect in the older adults cannot entirely account for a lack of relation between variability and self-ratings. In addition, the somewhat restricted range of the older adults’ responses on the self-task may contribute to the lack of relationship found between brain variability and self-ratings. However, this is unlikely to be a major confound, as FC between the vmPFC and PCC did in fact negatively correlate with self-ratings in older adults, suggesting sufficient variability of the behaviour data to assess correlations per se. Therefore, our data indicate that the combined effects of reduced variability and FC of the DN in older adults could account for the positivity bias reported in ageing research, since those older individuals in the current study who showed less variable brain signals and had weaker FC showed a greater endorsement of positive trait words. Indeed, this trend was apparent for younger adults as well, suggesting a general effect that may be present throughout the adult lifespan. Contrary to the currently held view that the positivity bias is the result of a shift in motivational goals and greater emotion regulation in older adults (Mather and Carstensen, 2005; Mather and Knight, 2005), our findings suggest that the positivity bias may in fact be due to underlying neural changes and lack of flexibility within the DN of older adults.
Finally, it is worth noting that self-ratings were only associated with FC and variability measures obtained after the tasks and not with those obtained prior to task performance. This suggests that the cognitive processes that were engaged during task performance, or the modulations of DN activity induced as a result of alternating tasks and rest periods, have an influence on subsequent resting FC that more closely reflects those processes than does a prior assessment of FC. Considering that various cognitive tasks were administered prior to the resting-state scan, we cannot attribute the effect on self-relevant behavioural measures specifically to self processing during the tasks, but our ability to find such a relation between post-task FC and behaviour demonstrates a robustness of this association despite the limitation in design. Nevertheless, it is likely the case that the influence goes in both directions; i.e., resting FC prior to a task could influence performance on that task, and this performance itself could influence brain activity or FC measured shortly afterwards. Future work will need to determine which influence is typically stronger and/or if such influences are task dependent.
CONCLUSION
We investigated age differences in the DN across resting states before and after tasks and found that those individuals with stronger FC and more signal variability in DN regions after the tasks were more likely to endorse negative personality traits, although these associations were weaker in older adults. Our results add to previous research by establishing that FC within the DN, as a whole, is more susceptible to the effects of ageing after a cognitive challenge. Furthermore, variability in activity was found to be greater in younger adults than in older adults across both resting-state runs. Both of these results are consistent with the hypothesis that ageing leads to less neural efficiency and reduced dynamic range of activity within the DN. Considering older adults show reduced FC and variability of the DN, the positivity bias seen in their socioemotional function may be a reflection of poor neural efficiency of the DN. Future work that seeks to investigate the relationship between DN activity or FC, and task performance should consider variability measures as a significant factor of interest, as stronger FC was significantly associated with greater variability. It would also be of interest to examine whether the positivity effect in memory and attention could be accounted for by age differences in FC or variability in the DN.
Acknowledgments
The authors thank the following people for their generosity in support of the imaging centre at Baycrest: Jack & Anne Weinbaum, Sam & Ida Ross, Joseph & Sandra Rotman. C.G. was supported by a grant from the Canadian Institutes of Health Research (MOP14036) and C.S. was supported by a grant from the Natural Sciences and Engineering Research Council of Canada (CGS). This work was also supported by the Canada Research Chairs program, the Ontario Research Fund, the Canadian Foundation for Innovation, and the Heart and Stroke Foundation Centre for Stroke Recovery.
References
- Addis DR, McIntosh AR, Moscovitch M, Crawley AP, McAndrews MP. Characterizing spatial and temporal features of autobiographical memory retrieval networks: a partial least squares approach. NeuroImage. 2004;23:1460–71. doi: 10.1016/j.neuroimage.2004.08.007. [DOI] [PubMed] [Google Scholar]
- Albert NB, Robertson EM, Miall RC. The resting human brain and motor learning. Current Biology. 2009;19:1023–7. doi: 10.1016/j.cub.2009.04.028. [DOI] [PMC free article] [PubMed] [Google Scholar]
- Allen EA, Erhardt EB, Damaraju E, et al. A baseline for the multivariate comparison of resting-state networks. Frontiers in Systems Neuroscience. 2011;5:1–23. doi: 10.3389/fnsys.2011.00002. [DOI] [PMC free article] [PubMed] [Google Scholar]
- Anderson N. Likeableness ratings of 555 personality trait adjectives. Journal of Personality and Social Psychology. 1968;9:272–9. doi: 10.1037/h0025907. [DOI] [PubMed] [Google Scholar]
- Andrews-Hanna JR, Reidler JS, Sepulcre J, Poulin R, Buckner RL. Functional-anatomic fractionation of the brain's default network. Neuron. 2010;65:550–62. doi: 10.1016/j.neuron.2010.02.005. [DOI] [PMC free article] [PubMed] [Google Scholar]
- Andrews-Hanna JR, Snyder AZ, Vincent JL, et al. Disruption of large-scale brain systems in advanced aging. Neuron. 2007;56:924–35. doi: 10.1016/j.neuron.2007.10.038. [DOI] [PMC free article] [PubMed] [Google Scholar]
- Biswal B, Yetkin FZ, Haughton VM, Hyde JS. Functional connectivity in the motor cortex of resting human brain using echo-planar MRI. Magnetic Resonance in Medicine. 1995;34:537–41. doi: 10.1002/mrm.1910340409. [DOI] [PubMed] [Google Scholar]
- Buckner RL, Andrews-Hanna JR, Schacter DL. The brain’s default network: anatomy, function, and relevance to disease. Annals of the NY Academy of Science. 2008;1124:1–38. doi: 10.1196/annals.1440.011. [DOI] [PubMed] [Google Scholar]
- Buckner RL, Carroll DC. Self-projection and the brain. Trends in Cognitive Sciences. 2007;11:49–57. doi: 10.1016/j.tics.2006.11.004. [DOI] [PubMed] [Google Scholar]
- Burianova H, Grady CL. Common and unique neural activations in auto-biographical, episodic, and semantic retrieval. Journal of Cognitive Neuroscience. 2007;19:1520–34. doi: 10.1162/jocn.2007.19.9.1520. [DOI] [PubMed] [Google Scholar]
- Carstensen LL, Fung HH, Charles ST. Socioemotional selectivity theory and the regulation of emotion in the second half of life. Motivation and Emotion. 2003;27:103–23. [Google Scholar]
- Carstensen LL, Isaacowitz DM, Charles ST. Taking time seriously: a theory of socioemotional selectivity. American Psychologist. 1999;54:165–81. doi: 10.1037//0003-066x.54.3.165. [DOI] [PubMed] [Google Scholar]
- Charles ST, Mather M, Carstensen LL. Aging and emotional memory: the forgettable nature of negative images for older adults. Journal of Experimental Psychology: General. 2003;132:310–24. doi: 10.1037/0096-3445.132.2.310. [DOI] [PubMed] [Google Scholar]
- Cox RW. AFNI: software for analysis and visualization of functional magnetic resonance neuroimages. Computers and Biomed Research. 1996;29:162–73. doi: 10.1006/cbmr.1996.0014. [DOI] [PubMed] [Google Scholar]
- Craik FIM, Moroz TM, Moscovitch M, et al. In search of the self: a positron emission tomography investigation. Psychological Science. 1999;10:26–34. [Google Scholar]
- Damoiseaux JS, Beckmann CF, Sanz Arigita EJ, et al. Reduced resting-state brain activity in the “default network” in normal aging. Cerebral Cortex. 2008;18:1856–64. doi: 10.1093/cercor/bhm207. [DOI] [PubMed] [Google Scholar]
- Damoiseaux JS, Rombouts SA, Barkhof F, et al. Consistent resting-state networks across healthy subjects. Proceedings of the National Academy of Sciences of the U S A. 2006;103:13848–53. doi: 10.1073/pnas.0601417103. [DOI] [PMC free article] [PubMed] [Google Scholar]
- Efron B. Nonparametric estimates of standard error: the jackknife, the bootstrap, and other methods. Biometrika. 1981;68:589–99. [Google Scholar]
- Esposito F, Aragri A, Pesaresi I, et al. Independent component model of the default-mode brain function: combining individual-level and population-level analyses in resting-state fMRI. Magnetic Resonance Imaging. 2008;26:905–13. doi: 10.1016/j.mri.2008.01.045. [DOI] [PubMed] [Google Scholar]
- Faisal AA, Selen LP, Wolpert DM. Noise in the nervous system. Nature Reviews Neuroscience. 2008;9(4):292–303. doi: 10.1038/nrn2258. [DOI] [PMC free article] [PubMed] [Google Scholar]
- Folstein MF, Folstein SE, McHugh PR. “Mini-mental state”. A practical method for grading the cognitive state of patients for the clinician. Journal of Psychiatric Research. 1975;12:189–98. doi: 10.1016/0022-3956(75)90026-6. [DOI] [PubMed] [Google Scholar]
- Fossati P, Hevenor SJ, Graham S, et al. In search of the emotional self. A fMRI study using positive and negative emotional words. American Journal of Psychiatry. 2003;160:1938–45. doi: 10.1176/appi.ajp.160.11.1938. [DOI] [PubMed] [Google Scholar]
- Fossati P, Hevenor SJ, Lepage M, et al. Distributed self in episodic memory: neural correlates of successful retrieval of self-encoded positive and negative personality traits. NeuroImage. 2004;22:1596–604. doi: 10.1016/j.neuroimage.2004.03.034. [DOI] [PubMed] [Google Scholar]
- Fox MD, Snyder AZ, Vincent JL, Corbetta M, Van Essen DC, Raichle ME. The human brain is intrinsically organized into dynamic, anticorrelated functional networks. Proceedings of the National Academy of Sciences of the U S A. 2005;102:9673–8. doi: 10.1073/pnas.0504136102. [DOI] [PMC free article] [PubMed] [Google Scholar]
- Garrett DD, Kovacevic N, McIntosh AR, Grady CL. BOLD variability is more than just noise. Journal of Neuroscience. 2010;30:4914–21. doi: 10.1523/JNEUROSCI.5166-09.2010. [DOI] [PMC free article] [PubMed] [Google Scholar]
- Garrett DD, Kovacevic N, McIntosh AR, Grady CL. The importance of being variable. Journal of Neuroscience. 2011;31:4496–503. doi: 10.1523/JNEUROSCI.5641-10.2011. [DOI] [PMC free article] [PubMed] [Google Scholar]
- Garrett DD, Kovacevic N, McIntosh AR, Grady CL. The modulation of BOLD variability between cognitive states varies by age and processing speed. Cerebral Cortex. 2012;23:684–93. doi: 10.1093/cercor/bhs055. [DOI] [PMC free article] [PubMed] [Google Scholar]
- Garrett DD, Samanez-Larkin GR, MacDonald SW, Lindenberger U, McIntosh AR, Grady CL. Moment-to-moment brain signal variability: a next frontier in human brain mapping? Neuroscience & Biobehavioral Reviews. 2013;37:610–24. doi: 10.1016/j.neubiorev.2013.02.015. [DOI] [PMC free article] [PubMed] [Google Scholar]
- Glisky EL, Marquine MJ. Semantic and self-referential processing of positive and negative trait adjectives in older adults. Memory. 2009;17:144–57. doi: 10.1080/09658210802077405. [DOI] [PMC free article] [PubMed] [Google Scholar]
- Glover GH, Li TQ, Ress D. Image-based method for retrospective correction of physiological motion effects in fMRI: RETROICOR. Magnetic Resonance in Medicine. 2000;44:162–7. doi: 10.1002/1522-2594(200007)44:1<162::aid-mrm23>3.0.co;2-e. [DOI] [PubMed] [Google Scholar]
- Goldberger AL, Peng CK, Lipsitz LA. What is physiologic complexity and how does it change with aging and disease? Neurobiology of Aging. 2002;23:23–6. doi: 10.1016/s0197-4580(01)00266-4. [DOI] [PubMed] [Google Scholar]
- Grady CL, Grigg O, Ng C. Age differences in default and reward networks during processing of personally relevant information. Journal of Neuropsychologia. 2012;50:1682–97. doi: 10.1016/j.neuropsychologia.2012.03.024. [DOI] [PMC free article] [PubMed] [Google Scholar]
- Grady CL, Springer MV, Hongwanishkul D, McIntosh AR, Winocur G. Age-related changes in brain activity across the adult lifespan. Journal of Cognitive Neuroscience. 2006;18:227–41. doi: 10.1162/089892906775783705. [DOI] [PubMed] [Google Scholar]
- Grady CL, Protzner AB, Kovacevia N, et al. A multivariate analysis of age-related differences in default mode and task-positive networks across multiple cognitive domains. Cerebral Cortex. 2010;20:1432–47. doi: 10.1093/cercor/bhp207. [DOI] [PMC free article] [PubMed] [Google Scholar]
- Greicius MD, Flores BH, Menon V, et al. Resting-state functional connectivity in major depression: abnormally increased contributions from subgenual cingulate cortex and thalamus. Biological Psychiatry. 2007;62:429–37. doi: 10.1016/j.biopsych.2006.09.020. [DOI] [PMC free article] [PubMed] [Google Scholar]
- Greicius MD, Krasnow B, Reiss AL, Menon V. Functional connectivity in the resting brain: a network analysis of the default mode hypothesis. Proceedings of the National Academy of Science of the U S A. 2003;100:253–8. doi: 10.1073/pnas.0135058100. [DOI] [PMC free article] [PubMed] [Google Scholar]
- Greicius MD, Srivastava G, Reiss AL, Menon V. Default-mode network activity distinguishes Alzheimer's disease from healthy aging: evidence from functional MRI. Proceedings of the National Academy of Science of the U S A. 2004;101:4637–42. doi: 10.1073/pnas.0308627101. [DOI] [PMC free article] [PubMed] [Google Scholar]
- Grigg O, Grady CL. The default network and processing of personally relevant information: converging evidence from task-related modulations and functional connectivity. Neuropsychologia. 2010a;48:3815–23. doi: 10.1016/j.neuropsychologia.2010.09.007. [DOI] [PMC free article] [PubMed] [Google Scholar]
- Grigg O, Grady CL. Task-related effects on the temporal and spatial dynamics of the resting-state functional connectivity in the default network. PLoS One. 2010b;5:e13311. doi: 10.1371/journal.pone.0013311. [DOI] [PMC free article] [PubMed] [Google Scholar]
- Gutchess AH, Kensinger EA, Schacter DL. Aging, self-referencing, and medial prefrontal cortex. Social Neuroscience. 2007;2:117–33. doi: 10.1080/17470910701399029. [DOI] [PubMed] [Google Scholar]
- Gutchess AH, Kensinger EA, Schacter DL. Functional neuroimaging of self-referential encoding with age. Neuropsychologia. 2010;48(1):211–9. doi: 10.1016/j.neuropsychologia.2009.09.006. [DOI] [PMC free article] [PubMed] [Google Scholar]
- Gutchess AH, Kensinger EA, Yoon C, Schacter DL. Ageing and the self-reference effect in memory. Memory. 2007;15:822–83. doi: 10.1080/09658210701701394. [DOI] [PubMed] [Google Scholar]
- Hamilton JP, Furman DJ, Chang C, Thomason ME, Dennis E, Gotlib IH. Default-mode and task-positive network activity in major depressive disorder: implications for adaptive and maladaptive rumination. Biological Psychiatry. 2011;70:327–33. doi: 10.1016/j.biopsych.2011.02.003. [DOI] [PMC free article] [PubMed] [Google Scholar]
- Hampson M, Driesen NR, Skudlarski P, Gore JC, Constable RT. Brain connectivity related to working memory performance. The Journal of Neuroscience. 2006;26:13338–43. doi: 10.1523/JNEUROSCI.3408-06.2006. [DOI] [PMC free article] [PubMed] [Google Scholar]
- Hasson U, Nusbaum HC, Small SL. Task-dependent organization of brain regions active during rest. Proceedings of the National Academy of Science of the U S A. 2009;106:10841–6. doi: 10.1073/pnas.0903253106. [DOI] [PMC free article] [PubMed] [Google Scholar]
- Hedden T, Van Dijk KR, Becker JA, et al. Disruption of functional connectivity in clinically normal older adults harboring amyloid burden. Journal of Neuroscience. 2009;29:12686–94. doi: 10.1523/JNEUROSCI.3189-09.2009. [DOI] [PMC free article] [PubMed] [Google Scholar]
- Johnson MK, Raye CL, Mitchell KJ, Touryan SR, Greene EJ, Nolen Hoeksema S. Dissociating medial frontal and posterior cingulate activity during self-reflection. Social Cognitive and Affective Neuroscience. 2006;1:56–64. doi: 10.1093/scan/nsl004. [DOI] [PMC free article] [PubMed] [Google Scholar]
- Keightley ML, Winocur G, Burianova H, Hongwanishkul D, Grady C. Age effects on social cognition: faces tell a different story. Psychology and Aging. 2006;21:558–72. doi: 10.1037/0882-7974.21.3.558. [DOI] [PubMed] [Google Scholar]
- Kelley WM, Macrae CN, Wyland CL, Caglar S, Inati S, Heatherton TF. Finding the self? An event-related fMRI study. Journal of Cognitive Neuroscience. 2002;14:785–94. doi: 10.1162/08989290260138672. [DOI] [PubMed] [Google Scholar]
- Kelly MC, Uddin LQ, Biswal BB, Castellanos FX, Milham MP. Competition between functional brain networks mediates behavioral variability. NeuroImage. 2008;39:527–37. doi: 10.1016/j.neuroimage.2007.08.008. [DOI] [PubMed] [Google Scholar]
- Kennedy Q, Mather M, Carstensen LL. The role of motivation in the age-related positivity effect in autobiographical memory. Psychological Science. 2004;15:208–14. doi: 10.1111/j.0956-7976.2004.01503011.x. [DOI] [PubMed] [Google Scholar]
- Kensinger EA, Leclerc CM. Age-related changes in the neural mechanisms supporting emotion processing and emotional memory. European Journal of Cognitive Psychology. 2009;21(3/4):192–215. [Google Scholar]
- Kensinger EA, Schacter DL. Neural processes supporting young and older adults' emotional memories. Journal of Cognitive Neuroscience. 2008;20(7):1161–73. doi: 10.1162/jocn.2008.20080. [DOI] [PubMed] [Google Scholar]
- Kyriazis M. Practical applications of chaos theory to the modulation of human ageing: nature prefers chaos to regularity. Biogerontology. 2003;4:75–90. doi: 10.1023/a:1023306419861. [DOI] [PubMed] [Google Scholar]
- Leclerc CM, Kensinger EA. Age-related differences in medial prefrontal activation in response to emotional images. Cognitive, Affective and Behavioral Neuroscience. 2008;8(2):153–64. doi: 10.3758/cabn.8.2.153. [DOI] [PubMed] [Google Scholar]
- Levine B, Turner GR, Tisserand D, Hevenor SJ, Graham SJ, McIntosh AR. The functional neuroanatomy of episodic and semantic autobiographical remembering: a prospective functional MRI study. Journal of Cognitive Neuroscience. 2004;16:1633–46. doi: 10.1162/0898929042568587. [DOI] [PubMed] [Google Scholar]
- Lewis CM, Baldassarre A, Committeri A, Romani GL, Corbetta M. Learning sculpts the spontaneous activity of the resting human brain. Proceedings of the National Academy of Science of the U S A. 2009;106:17558–63. doi: 10.1073/pnas.0902455106. [DOI] [PMC free article] [PubMed] [Google Scholar]
- Mather M, Canli T, English T, et al. Amygdala responses to emotionally valenced stimuli in older and younger adults. Psychological Science. 2004;15(4):259–63. doi: 10.1111/j.0956-7976.2004.00662.x. [DOI] [PubMed] [Google Scholar]
- Mather M, Carstensen LL. Aging and attentional biases for emotional faces. Psychological Science. 2003;14:409. doi: 10.1111/1467-9280.01455. [DOI] [PubMed] [Google Scholar]
- Mather M, Carstensen LL. Aging and motivated cognition: the positivity effect in attention and memory. Trends in Cognitive Sciences. 2005;9:496–502. doi: 10.1016/j.tics.2005.08.005. [DOI] [PubMed] [Google Scholar]
- Mather M, Knight M. Goal-directed memory: the role of cognitive control in older adults’ emotional memory. Psychology and Aging. 2005;20:554–70. doi: 10.1037/0882-7974.20.4.554. [DOI] [PubMed] [Google Scholar]
- McIntosh AR. Mapping cognition to the brain through neural interactions. Memory. 1999;7:523–48. doi: 10.1080/096582199387733. [DOI] [PubMed] [Google Scholar]
- McIntosh AR, Bookstein FL, Haxby JV, Grady CL. Spatial pattern analysis of functional brain images using partial least squares. NeuroImage. 1996;3:143–57. doi: 10.1006/nimg.1996.0016. [DOI] [PubMed] [Google Scholar]
- McIntosh AR, Kovacevic N, Lippe S, Garrett DD, Grady CL, Jirsa V. The development of a noisy brain. Archives Italiennes de Biologie. 2010;148(3):323–37. [PubMed] [Google Scholar]
- McIntosh AR, Lobaugh NL. Partial least squares analysis of neuroimaging data: applications and advances. NeuroImage. 2004;23:S250–S263. doi: 10.1016/j.neuroimage.2004.07.020. [DOI] [PubMed] [Google Scholar]
- Mikels JA, Reuter-Lorenz PA, Beyer JA, Fredrickson BL. Emotion and working memory: evidence for domain-specific processes for affective maintenance. Emotion. 2008;8:256–66. doi: 10.1037/1528-3542.8.2.256. [DOI] [PubMed] [Google Scholar]
- Mitchell KJ, Raye CL, Ebner NC, Tubridy SM, Frankel H, Johnson MK. Age-group differences in medial cortex activity associated with thinking about self-relevant agendas. Psychology and Aging. 2009;24(2):438–49. doi: 10.1037/a0015181. [DOI] [PMC free article] [PubMed] [Google Scholar]
- Northoff G, Bermpohl F. Cortical midline structures and the self. Trends in Cognitive Science. 2004;8:102–107. doi: 10.1016/j.tics.2004.01.004. [DOI] [PubMed] [Google Scholar]
- Ochsner KN, Beer JS, Robertson ER, et al. The neural correlates of direct and reflected self-knowledge. NeuroImage. 2005;28:797–814. doi: 10.1016/j.neuroimage.2005.06.069. [DOI] [PubMed] [Google Scholar]
- Park DC, Polk TA, Hebrank AC, Jenkins LJ. Age differences in default mode activity on easy and difficult spatial judgment tasks. Frontiers in Human Neuroscience. 2010;3:75. doi: 10.3389/neuro.09.075.2009. [DOI] [PMC free article] [PubMed] [Google Scholar]
- Persson J, Lustig C, Nelson JK, Reuter-Lorenz PA. Age differences in deactivation: a link to cognitive control? Journal of Cognitive Neuroscience. 2007;19:1021–32. doi: 10.1162/jocn.2007.19.6.1021. [DOI] [PubMed] [Google Scholar]
- Power JD, Barnes KA, Snyder AZ, Schlaggar BL, Petersen SE. Spurious but systematic correlations in functional connectivity MRI networks arise from subject motion. NeuroImage. 2012;59:2142–54. doi: 10.1016/j.neuroimage.2011.10.018. [DOI] [PMC free article] [PubMed] [Google Scholar]
- Raven JC, Court JH, Raven J. Raven Manual. 1988 edn. Oxford: Oxford Psychologists Press; 1988. [Google Scholar]
- Ritchey M, Bessette-Symons B, Hayes SM, Cabeza R. Emotion processing in the aging brain is modulated by semantic elaboration. Neuropsychologia. 2011;49(4):640–50. doi: 10.1016/j.neuropsychologia.2010.09.009. [DOI] [PMC free article] [PubMed] [Google Scholar]
- Ruby P, Collette F, D’Argembeau A, et al. Perspective taking to assess self-personality: what’s modified in Alzheimer’s disease? Neurobiology of Aging. 2009;30:1637–51. doi: 10.1016/j.neurobiolaging.2007.12.014. [DOI] [PubMed] [Google Scholar]
- Sala-Llonch R, Pena-Gomez C, Arenaza-Urquijo EM, et al. Brain connectivity during resting state and subsequent working memory task predicts behavioural performance. Cortex. 2012;48:1187–96. doi: 10.1016/j.cortex.2011.07.006. [DOI] [PubMed] [Google Scholar]
- Schilbach L, Eickhoff SB, Rotarska-Jagiela A, Fink GR, Vogeley K. Minds at rest? Social cognition as the default mode of cognizing and its putative relationship to the “default system” of the brain. Consciousness and Cognition. 2008;17:457–67. doi: 10.1016/j.concog.2008.03.013. [DOI] [PubMed] [Google Scholar]
- Sheline YI, Barch DM, Price JL, et al. The default mode network and self-referential processes in depression. Proceedings of the National Academy of Sciences of the United States of America. 2009;106:1942–7. doi: 10.1073/pnas.0812686106. [DOI] [PMC free article] [PubMed] [Google Scholar]
- Spaniol J, Voss A, Grady CL. Aging and emotional memory: cognitive mechanisms underlying the positivity effect. Psychology and Aging. 2008;23(4):859–72. doi: 10.1037/a0014218. [DOI] [PubMed] [Google Scholar]
- Spreng RN, Grady CL. Patterns of brain activity supporting autobiographical memory, prospection and theory-of-mind, and their relationship to the default mode network. Journal of Cognitive Neuroscience. 2010;22:1112–23. doi: 10.1162/jocn.2009.21282. [DOI] [PubMed] [Google Scholar]
- Spreng RN, Mar RA, Kim ASN. The common neural basis of autobiographical memory, prospection, navigation, theory of mind, and the default mode: a quantitative meta-analysis. Journal of Cognitive Neuroscience. 2009;21:489–510. doi: 10.1162/jocn.2008.21029. [DOI] [PubMed] [Google Scholar]
- Stevens WD, Buckner RL, Schacter DL. Correlated low-frequency BOLD fluctuations in the resting human brain are modulated by recent experience in category-preferential visual regions. Cerebral Cortex. 2010;20:1997–2006. doi: 10.1093/cercor/bhp270. [DOI] [PMC free article] [PubMed] [Google Scholar]
- Takahashi T, Cho RY, Murata T, et al. Age-related variation in EEG complexity to photic stimulation: a multiscale entropy analysis. Clinical Neurophysiology. 2009;120:476–83. doi: 10.1016/j.clinph.2008.12.043. [DOI] [PMC free article] [PubMed] [Google Scholar]
- Tambini A, Ketz N, Davachi L. Enhanced brain correlations during rest are related to memory for recent experiences. Neuron. 2010;65:280–90. doi: 10.1016/j.neuron.2010.01.001. [DOI] [PMC free article] [PubMed] [Google Scholar]
- Thomas RC, Hasher L. The influence of emotional valence on age differences in early processing and memory. Psychology and Aging. 2006;21:821–5. doi: 10.1037/0882-7974.21.4.821. [DOI] [PMC free article] [PubMed] [Google Scholar]
- Toro R, Fox PT, Paus T. Functional coactivation map of the human brain. Cerebral Cortex. 2008;18:2553–9. doi: 10.1093/cercor/bhn014. [DOI] [PMC free article] [PubMed] [Google Scholar]
- Uddin LQ, Iacoboni M, Lange C, Keenan JP. The self and social cognition: the role of cortical midline structures and mirror neurons. Trends in Cognitive Sciences. 2007;11:153–7. doi: 10.1016/j.tics.2007.01.001. [DOI] [PubMed] [Google Scholar]
- van der Meer L, Costafreda S, Aleman A, David AS. Self-reflection and the brain: a theoretical review and meta-analysis of neuroimaging studies with implications for schizophrenia. Neuroscience and Biobehavioral Reviews. 2010;34:935–46. doi: 10.1016/j.neubiorev.2009.12.004. [DOI] [PubMed] [Google Scholar]
- van Dijk KRA, Sabuncu MR, Buckner RL. The influence of head motion on intrinsic functional connectivity MRI. NeuroImage. 2012;59:431–8. doi: 10.1016/j.neuroimage.2011.07.044. [DOI] [PMC free article] [PubMed] [Google Scholar]
- Waites AB, Stanislavsky A, Abbott DF, Jackson GD. Effect of prior cognitive state on resting state networks measured with functional connectivity. Human Brain Mapping. 2005;24:59–68. doi: 10.1002/hbm.20069. [DOI] [PMC free article] [PubMed] [Google Scholar]
- Wang L, LaViolette P, O'Keefe K, et al. Intrinsic connectivity between the hippocampus and posteromedial cortex predicts memory performance in cognitively intact older individuals. NeuroImage. 2010;51:910–7. doi: 10.1016/j.neuroimage.2010.02.046. [DOI] [PMC free article] [PubMed] [Google Scholar]
- Winecoff A, LaBar KS, Madden DJ, Cabeza R, Huettel SA. Cognitive and neural contributors to emotion regulation in aging. Social Cognitive and Affective Neuroscience. 2011;6(2):165–76. doi: 10.1093/scan/nsq030. [DOI] [PMC free article] [PubMed] [Google Scholar]
- Zhu X, Wang X, Xiao J, et al. Evidence of a dissociation pattern in resting-state default mode network connectivity in first-episode, treatment-naive major depression patients. Biological Psychiatry. 2012;71:611–7. doi: 10.1016/j.biopsych.2011.10.035. [DOI] [PubMed] [Google Scholar]