

Abstract
microRNA (miRNA) mediated regulation of gene expression has emerged as a significant mechanism contributing to variation in gene expression. In this study, we evaluated the potential role of miRNAs in regulating expression of hepatic cytochrome P450s and their transcriptional regulatory genes. We screened the Targetscan database for high scoring miRNA binding site predictions in selected hepatic DMEs and transcription factors. Expression profiling for candidate miRNAs (n= 22) and their target genes (n=21) was performed in 50 human liver samples (25 female, 25 male). Significant negative correlations were observed between expression levels of several CYPs/hepatic transcription factors and the hepatic miRNAs studied. Interestingly, hepatic miR-34a demonstrated significant negative correlation with expression levels of multiple hepatic transcription factors (including NR1I2 and HNF4α) and DMEs (CYP3A4, CYP2C19). miR-34a expression was also significantly higher in males than in females in congruence with previous observations of higher CYP3A4 expression in females versus males. A mediation analysis revealed that miR-34a was involved in significant mediation of the association observed between CYP2C19 and several hepatic transcription factors (HNF4α, NR1I2). miR-34a may thus play a key regulatory role and be a key contributory factor to the inter-individual variability observed in expression of key drug metabolizing genes in humans.
Keywords: microRNA, Hepatic, cytochrome P450, mRNA expression, transcriptional regulation, gender
1. Introduction
Hepatic drug metabolizing enzymes (DMEs) such as cytochrome P4503A4, demonstrate substantial inter-individual variability in expression, including gender differences, thus impacting drug metabolism/clearance in individuals and often leading to either reduced efficacy or drug related toxicity. Although a number of factors can contribute to this variation, recent data suggests an important role for hepatic transcription factors and miRNAs in regulating gene expression levels of genes involved in drug absorption, disposition, metabolism and elimination (ADME). Whereas the role of hepatic transcription factors (TF), such as nuclear hormone receptors, in transcriptional regulation of ADME genes is well established, the role of miRNAs in mediating regulation of ADME genes has not been well studied.
MiRNAs have recently been demonstrated to play an important role in regulation of hepatic gene expression. Bioinformatic analyses suggest potential binding sites for miRNAs in several hepatic DMEs and TFs [1,2]. Some of these in silico predictions have been explored further and validated, such as miR-27b and CYP1B1 [3]; miR-148a and NR1I2/CYP3A4 [4]; miR-378 and CYP2E1 [5]. Indirect regulation of CYP7A1 through miR-24a [6] and miR-34a mediated regulation of HNF4α has also been reported [6]. These examples are also summarized in a few recent reviews [7,8]. Apart from the examples cited above, the current knowledge on miRNA-mediated regulation of DMEs in liver is limited and a systematic screening methodology for miRNAs that regulate the expression of hepatic DMEs and their upstream transcription factors is lacking. The objective of this research was to identify and evaluate the potential role of miRNAs in regulating expression of hepatic DME genes and their upstream transcription factors. To do this we first performed an in silico analysis to identify miRNAs with either strong and/or multiple binding sites in hepatic CYPs and TFs. We then evaluated the involvement of these miRNAs by correlating mRNA expression (of CYPs/TFs) and miRNA expression levels in 50 human liver tissue specimens (25 Male and 25 Female) to identify any miRNAs associating with hepatic CYP/TF expression, as well as to explore any gender-related differences in expression of hepatic CYPs/TFs and miRNAs.
2. Methods
2.1. Study samples
50 normal and de-identified human liver tissue samples (25 female, 25 male) subjects that had been flash frozen and stored in liquid nitrogen were obtained from University of Minnesota’s Biological Materials Procurement Network facility (BIONET). The study was approved by the University of Minnesota IRB and was in accordance with Helsinki declaration.
2.2. Screening of Target CYPs and Transcription Factors for miRNA Binding
Using the Targetscan™ database [9] we analyzed 4 CYPs (CYP2B6, CYP2C9, CYP2C19 and CYP3A4) and 14 hepatic transcription factors (implicated in regulation of these CYPs) for the presence of predicted miRNA binding sites in their 3’UTR regions. We also analyzed 3 additional genes: SLC10A1 (a bile acid transporter), AKR1D1 (an aldo-keto-reductase) and EHHADH (an oxidoreductase), as these have been shown to be potentially associated with CYP expression/activity [10]. miRNA binding site predictions were prioritized using the “total context” and “Aggregate PCT” scores. Additionally, miRNAs with binding sites in multiple target genes were given priority. Supplementary Fig. 1 shows a schematic of the strategy followed for the in silico analysis and mRNA/miRNA target selection. Supplementary Table-1 provides the list of genes and miRNAs that were selected for expression analysis.
2.3. RNA isolation for mRNA and miRNA expression profiling
Total RNA was isolated from fifty normal liver tissues (25 males and 25 females) using AllPrep DNA/RNA mini kit (Qiagen, Valencia, CA, USA) and Mirvana miRNA isolation kit (Life Technologies, Grand Island, NY) for mRNAs and microRNAs respectively, per the manufacturers’ protocols. Additional enrichment for short RNA molecules (of ~200bp or less) was performed for microRNA isolation. The RNA quality and yield of each total RNA sample was obtained from A260 measurements using a NanoDrop 2000 (Thermo Fischer, Waltham, MA, USA). The RNA integrity number (RIN) was tested with an Agilent 2100 Bioanalyzer (Agilent Technologies, Santa Clara, CA, USA).
2.4. Real-time PCR amplification of mRNA and miRNA targets
For mRNA targets, first-strand cDNA was prepared from total RNA using the High Capacity cDNA Reverse Transcription Kit from Applied Biosystems (Vernon, CA, USA). Reverse transcription was carried out according to the manufacturer’s instructions using random primers and up to 2μg of total RNA for each sample.
For miRNA amplification, enriched short RNA was reverse transcribed using the miRNA reverse transcription kit from Applied Biosystems in combination with a multiplexed stem-loop primer pool (for 22 miRNAs and controls). The stem loop design ensured highly sensitive and specific amplification of mature miRNAs [11]. Custom designed 384 well TLDA (Taqman Low Density Array) cards were used for real time PCR amplification of mRNA and miRNA targets and endogenous controls and analyzed according to manufacturer’s instructions. SDS 2.3 and RQ manager (Applied Biosystems) were used for data analysis. The RQ study output was analyzed using Data Assist v3.01 from Applied Biosystems and Qbaseplus from Biogazelle (http://www.biogazelle.com/qbaseplus). Relative quantification was carried out using ddCT method using a common calibrator sample. Replicates/wells with Ct > 37 were excluded.
We used two computational programs Normfinder ([12,13]), and GeNormplus ([14]) to compare and rank the stability (least variability in expression) of candidate mRNAs, miRNAs and endogenous controls. Normfinder algorithm was also used to estimate both intra- and intergroup variance for targets between genders.
2.5. Statistical analysis
Normalized mRNA and miRNA expression values were imported into Partek Genomics Suite 6.5 to perform statistical analysis. ANOVA analysis was performed to determine group differences between genders. Spearman rank correlation was used to determine mRNA and miRNA correlation patterns. Additional statistical calculations were performed by use of the statistical program R [http://www.R-project.org]. Gender differences in expression levels were analyzed parametrically using the t test with unequal variances and non-parametrically using the Wilcoxon rank-sum test. No adjustments have been made for multiple testing.
2.6. Mediation analysis
To determine if miRNAs potentially contributed to CYP expression through modulating the expression levels of any associated transcription factors, the Baron and Kenny (1986) steps were applied to examine any potential mediation effect of selected miRNAs on the relationship between each pair of CYP and TF gene expression [15]. Specifically, each CYP gene expression was first regressed on each TF using linear regression (regression coefficient for TF denoted by b0), and only TFs associated with CYP gene expressions (p < .05) were considered in the mediation analysis. miRNAs were then regressed on these TFs, and were selected when the association was significant (p < .05). In the last step, a multivariable model was carried out such that the CYP gene expression was regressed on each selected pair of miRNA and TF (regression coefficient for TF denoted by b1). Mediation effect was calculated when miRNA was independently associated with CYP gene expression in the multivariable model (p < .05). It was defined as the proportion of total TF effect “explained” (PTE) by miRNA, i.e., 1 − b1/b0. A PTE greater than 15% was considered as evidence of mediation, and a PTE of 30% was considered as strong mediation [15].
3. Results
3.1. Expression profiling of hepatic mRNAs and miRNAs
We quantified mRNA levels of 21 genes (4 CYPs, 14 transcription factors, and 3 other genes) of importance in drug metabolism and 22 miRNAs with predicted binding sites in these CYPs and TFs. While all of target mRNAs were present at quantifiable levels, 5 miRNAs showed little or no amplification. Since Med25 and NcoA1 mRNAs were most stable mRNAs with least variability (Coefficient of variation (CV)<10%, Table 1) among the samples, they were chosen as an endogenous controls and the mRNA data was normalized to their geometric mean. Similarly the miRNA data was normalized to the geometric mean of mir-152/mir-23b, the two most stable miRNAs.
Table 1.
Descriptive statistics of mRNA and miRNA quantification in 50 liver specimens.
| Gene Symbol-ABI Assay ID |
Variance | Std. Dev. |
Range | Median | Mean | Max | Min | CV(%) |
|---|---|---|---|---|---|---|---|---|
| CYP2C19- | ||||||||
| Hs00426380_m1 | 0.16 | 0.40 | 1.71 | 0.36 | 0.46 | 1.73 | 0.02 | 87.7 |
| CEBPA-Hs00269972_s1 | 0.57 | 0.76 | 2.94 | 0.88 | 1.09 | 3.06 | 0.12 | 69.3 |
| PPARGC1A- | ||||||||
| Hs01016719_m1 | 1.24 | 1.11 | 4.35 | 1.61 | 1.84 | 4.61 | 0.26 | 60.5 |
| AKR1D1-Hs00818881_m1 | 0.34 | 0.58 | 2.39 | 0.89 | 1.01 | 2.48 | 0.10 | 57.2 |
| CYP3A4-Hs00604506_m1 | 0.34 | 0.58 | 2.95 | 0.94 | 1.02 | 3.07 | 0.12 | 57.0 |
| CYP2B6-Hs03044634_m1 | 0.11 | 0.34 | 1.41 | 0.58 | 0.64 | 1.60 | 0.19 | 52.9 |
| 18S-Hs99999901_s1 | 0.34 | 0.59 | 3.17 | 1.04 | 1.26 | 3.86 | 0.69 | 46.4 |
| NR1I2-Hs01114267_m1 | 0.13 | 0.37 | 1.47 | 0.91 | 0.86 | 1.64 | 0.17 | 42.7 |
| SLC10A1- | ||||||||
| Hs00161820_m1 | 0.22 | 0.47 | 2.13 | 1.15 | 1.15 | 2.20 | 0.07 | 41.4 |
| NR1I3-Hs00901571_m1 | 0.08 | 0.28 | 1.24 | 0.69 | 0.72 | 1.53 | 0.29 | 38.9 |
| EHHADH- | ||||||||
| Hs00157347_m1 | 0.36 | 0.60 | 2.57 | 1.88 | 1.74 | 3.03 | 0.46 | 34.7 |
| RXRA-Hs01067640_m1 | 0.27 | 0.52 | 2.17 | 1.58 | 1.59 | 2.73 | 0.56 | 32.8 |
| PPIA-Hs04194521_s1 | 0.09 | 0.30 | 1.30 | 0.91 | 0.94 | 1.74 | 0.44 | 31.6 |
| CYP2C9-Hs00426397_m1 | 0.19 | 0.44 | 1.93 | 1.42 | 1.41 | 2.49 | 0.56 | 31.3 |
| HNF4A-Hs00230853_m1 | 0.09 | 0.31 | 1.28 | 1.02 | 0.98 | 1.72 | 0.44 | 31.3 |
| FOXA2-Hs00232764_m1 | 0.09 | 0.30 | 1.33 | 1.10 | 1.11 | 1.83 | 0.50 | 27.0 |
| HNF4G-Hs01071345_m1 | 0.11 | 0.34 | 1.77 | 1.28 | 1.26 | 2.35 | 0.58 | 26.7 |
| NCOR2-Hs00196955_m1 | 0.05 | 0.22 | 1.06 | 0.83 | 0.86 | 1.55 | 0.48 | 25.2 |
| NR3C1-Hs00353740_m1 | 0.05 | 0.22 | 1.00 | 1.02 | 1.04 | 1.66 | 0.67 | 21.1 |
| STAT5A-Hs00234181_m1 | 0.04 | 0.21 | 0.97 | 0.92 | 0.99 | 1.59 | 0.62 | 20.9 |
| NCOA6-Hs01052843_m1 | 0.05 | 0.22 | 1.13 | 1.18 | 1.20 | 1.90 | 0.76 | 18.3 |
| STAT5B-Hs00273500_m1 | 0.02 | 0.15 | 0.63 | 1.06 | 1.05 | 1.39 | 0.76 | 14.2 |
| NCOA1-Hs00186661_m1 | 0.01 | 0.11 | 0.48 | 1.07 | 1.08 | 1.34 | 0.86 | 10.0 |
| MED25-Hs00229634_m1 | 0.01 | 0.09 | 0.42 | 0.94 | 0.93 | 1.17 | 0.75 | 9.9 |
|
miRNA symbol-(last numbers are ABI Assay IDs) |
Variance |
Std. Dev. |
Range | Median | Mean | Max | Min | CV(%) |
| hsa-miR-135a-460 | 10.66 | 3.27 | 21.69 | 0.55 | 1.29 | 21.85 | 0.15 | 253.8 |
| hsa-miR-141-463 | 53.56 | 7.32 | 46.04 | 1.49 | 2.91 | 46.31 | 0.28 | 251.3 |
| U6-U6 | 20.24 | 4.50 | 27.51 | 2.33 | 3.47 | 27.52 | 0.01 | 129.5 |
| hsa-miR-150-473 | 8.81 | 2.97 | 17.01 | 2.09 | 2.90 | 17.65 | 0.64 | 102.2 |
| hsa-miR-138-2284 | 4.91 | 2.22 | 9.84 | 1.84 | 2.55 | 10.43 | 0.59 | 86.9 |
| RNU6B-1093 | 0.58 | 0.76 | 3.94 | 0.79 | 0.97 | 4.11 | 0.17 | 78.2 |
| hsa-miR-200a-502 | 0.72 | 0.85 | 5.01 | 0.95 | 1.16 | 5.28 | 0.28 | 73.4 |
| hsa-miR-34a-426 | 0.84 | 0.92 | 4.67 | 1.06 | 1.27 | 4.93 | 0.26 | 72.6 |
| hsa-miR-9-583 | 2.21 | 1.49 | 8.72 | 1.72 | 2.07 | 9.02 | 0.29 | 72.0 |
| hsa-miR-1-2222 | 0.18 | 0.42 | 1.75 | 0.42 | 0.59 | 1.87 | 0.12 | 71.1 |
| hsa-miR-128a-2216 | 0.29 | 0.54 | 2.98 | 1.13 | 1.22 | 3.42 | 0.43 | 44.0 |
| hsa-miR-23a-399 | 0.10 | 0.31 | 1.45 | 0.71 | 0.73 | 1.61 | 0.16 | 43.2 |
| hsa-miR-27a-408 | 0.23 | 0.47 | 1.98 | 1.26 | 1.31 | 2.47 | 0.49 | 36.1 |
| hsa-miR-27b-409 | 0.08 | 0.29 | 1.36 | 0.90 | 0.87 | 1.67 | 0.31 | 33.2 |
| hsa-miR-10b-2218 | 0.19 | 0.43 | 2.22 | 1.28 | 1.39 | 2.95 | 0.73 | 31.1 |
| hsa-miR-148a-470 | 0.09 | 0.31 | 1.49 | 0.95 | 1.01 | 1.95 | 0.46 | 30.3 |
| hsa-miR-23b-400 | 0.04 | 0.21 | 0.84 | 0.76 | 0.78 | 1.22 | 0.38 | 26.6 |
| hsa-miR-10a-387 | 0.03 | 0.17 | 0.67 | 0.87 | 0.90 | 1.35 | 0.68 | 18.8 |
| hsa-miR-152-475 | 0.04 | 0.19 | 0.73 | 1.15 | 1.14 | 1.48 | 0.74 | 17.0 |
Descriptive statistics of the mRNA/miRNA quantification data after normalization is shown in Table 1. We observed wide inter-individual variation in expression levels of several mRNAs and miRNAs (Table 1, and Fig. 1). As expected, CYP2C19, CYP2B6, and CYP3A4 demonstrated substantial inter-individual variation (CV>50%) in expression. Among the hepatic transcription factors/other genes studied, CEBPα, NR1I2, PPARGC1α, AKR1D1 and SLC10A1 also demonstrated substantial variability in expression (CV>40%, Table 1 and Fig. 1). Among the miRNAs, several, such as miR-1, miR-128a, miR-138, miR-150, miR-200a, miR-23a, miR-34a and miR-9 were highly variable (CV>40%) in expression between individuals (Fig. 1 and Table 1). Although miR-135 and miR-141 also demonstrated very high coefficient of variation, this was due to one or two outliers with very high values.
Fig. 1.
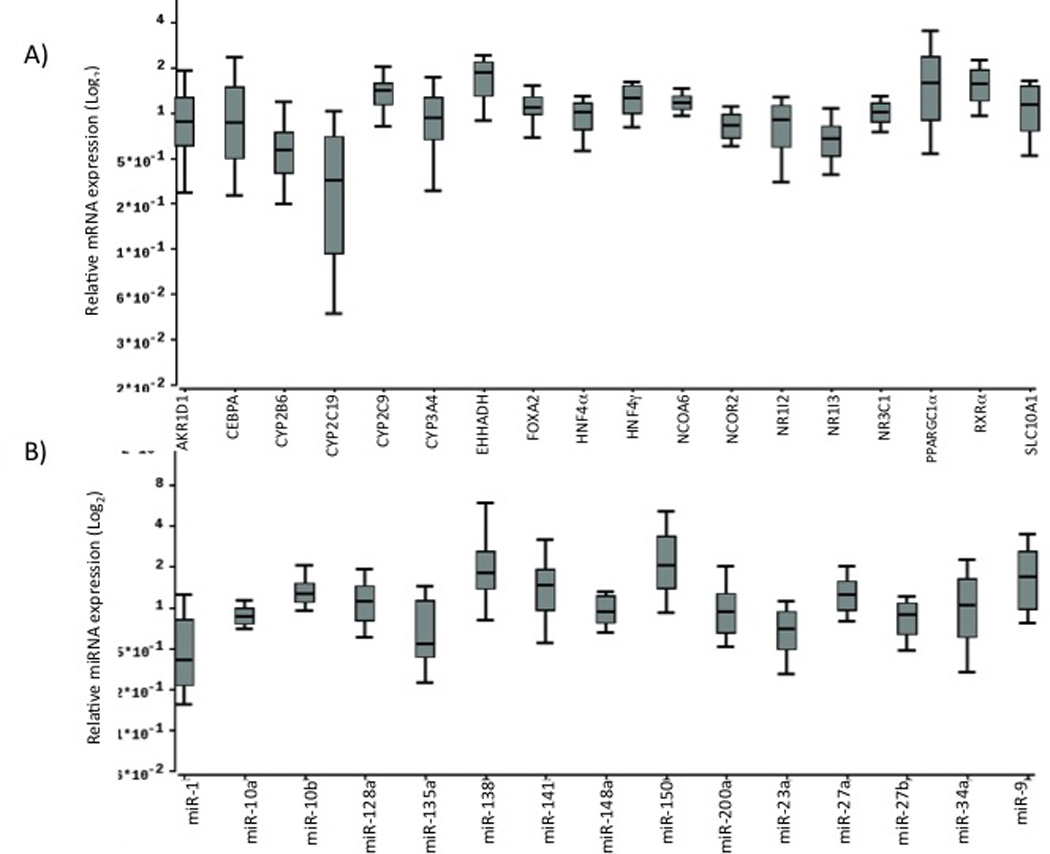
Hepatic expression profiles of mRNAs (1A) and miRNAs (1B) in human liver samples. Box plots indicate first and third quartiles of expression; the bold line in the box represents the median value; the whiskers represent the range after excluding the outliers; circles represent outliers.
3.2. Gender differences in CYPs, hepatic transcription factors and miRNAs
We compared expression differences between males (n=25) and females (n=25). We observed that females exhibited significantly higher mRNA expression levels for CYP3A4, CYP2C19, SLC10A1, and HNF4γ and lower levels of NCOA6 (all p<0.05, Fig. 2). In contrast, females expressed lower levels of miRNAs such as miR-150, and miR-34a as compared to males (p<0.05; Table 2 and Fig. 2). As potential direct/indirect targets of miRNA mediated repression, the lower levels of CYP3A4 and CYP2C19 in males agreed with males exhibiting higher levels of miRNAs such as miR-34a and miR-150.
Fig. 2.
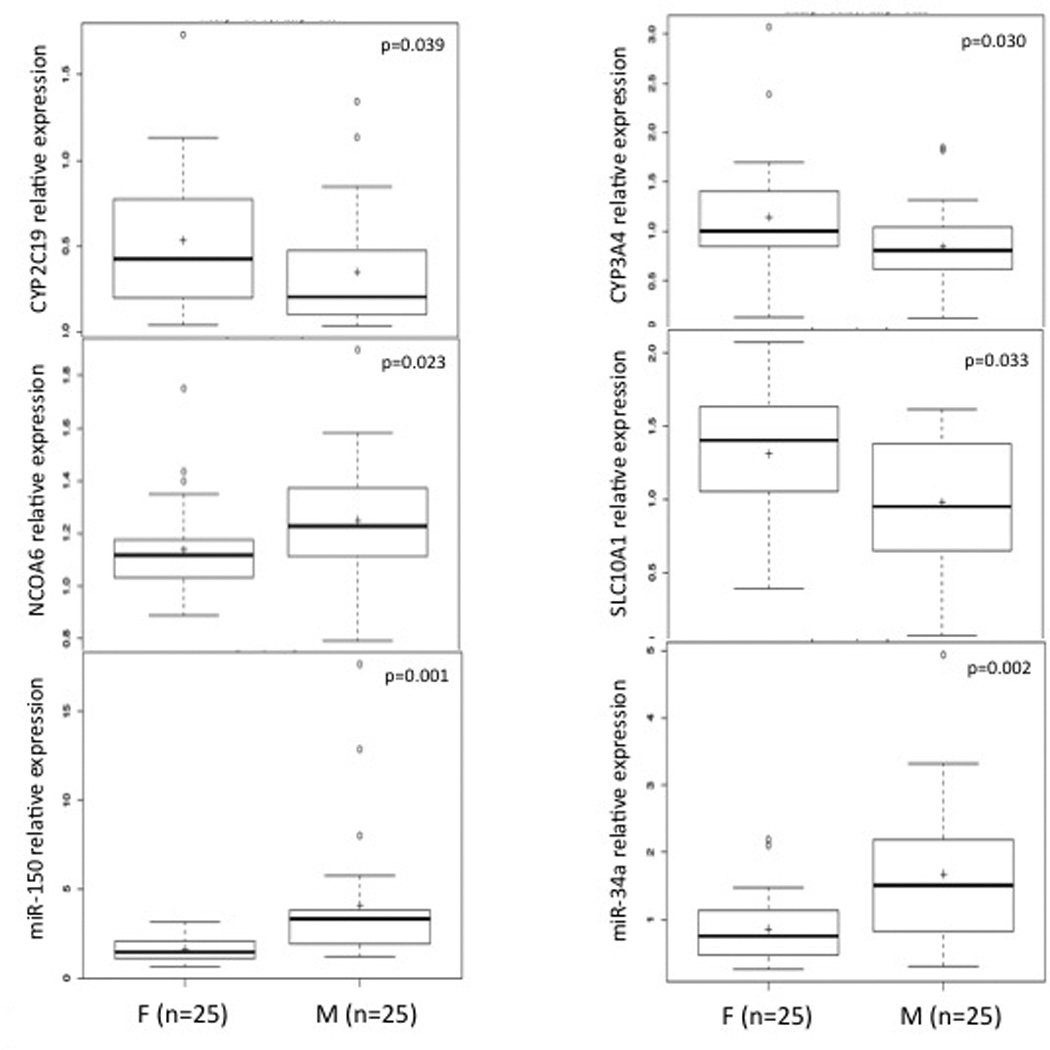
Gender differences in hepatic mRNA and miRNA expression levels. Box plot description is same as Fig.1. F:Females; M:Males.
Table 2.
Gender differences in expression levels of miRNAs and other small RNAs.
| Target | P | Comparison | Ratio | 95% CI low | 95% CI high |
|---|---|---|---|---|---|
| hsa-miR-150 | 0.001 | F / M | 0.481 | 0.328 | 0.705 |
| hsa-miR-34a | 0.002 | F / M | 0.551 | 0.384 | 0.79 |
| hsa-miR-1 | 0.006 | F / M | 1.847 | 1.167 | 2.922 |
| hsa-miR-138 | 0.043 | F / M | 0.564 | 0.367 | 0.867 |
| U6 | 0.027 | F / M | 0.379 | 0.17 | 0.848 |
Ps <0.05 are shown
3.3. Correlations patterns within hepatic mRNA expression profiles
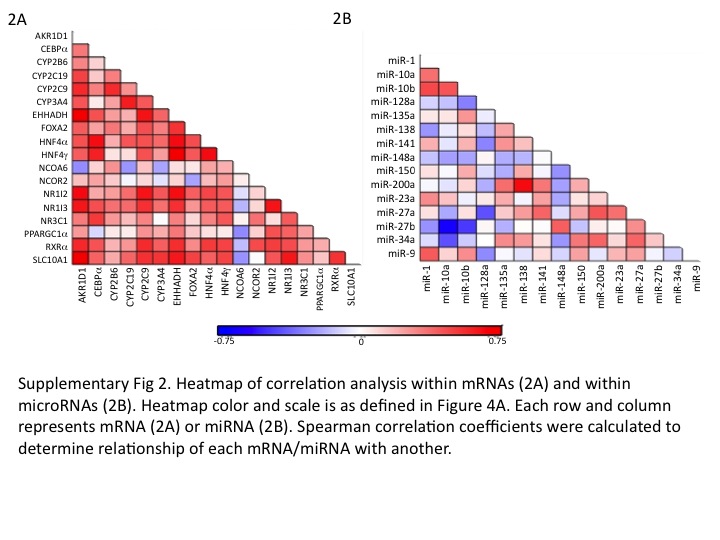
Within the mRNA expression data, we observed significant correlations between CYPs and select TFs/other hepatic genes analyzed. Supplementary Table 1 and heatmap in supplementary Fig. 2A, summarizes all correlation results between mRNAs. Specifically, CYP3A4 relative mRNA levels were significantly associated with expression of CYP2C19 and CYP2C9 in human liver samples (p=0.000002 and p =0.002, respectively; Fig. 3A). CYP2B6 expression was associated with FOXA2 and NR1I3 (p =0.015 and p =0.011, respectively); CYP2C9 CYP2C19 and CYP3A4 expression showed significant correlations with HNF4α (all ps <0.005), NR1I2 (ps <0.01, Fig. 3B), NR1I3 (ps<0.01) and SLC10A1 (ps <0.005, Fig. 3C).
Fig. 3.
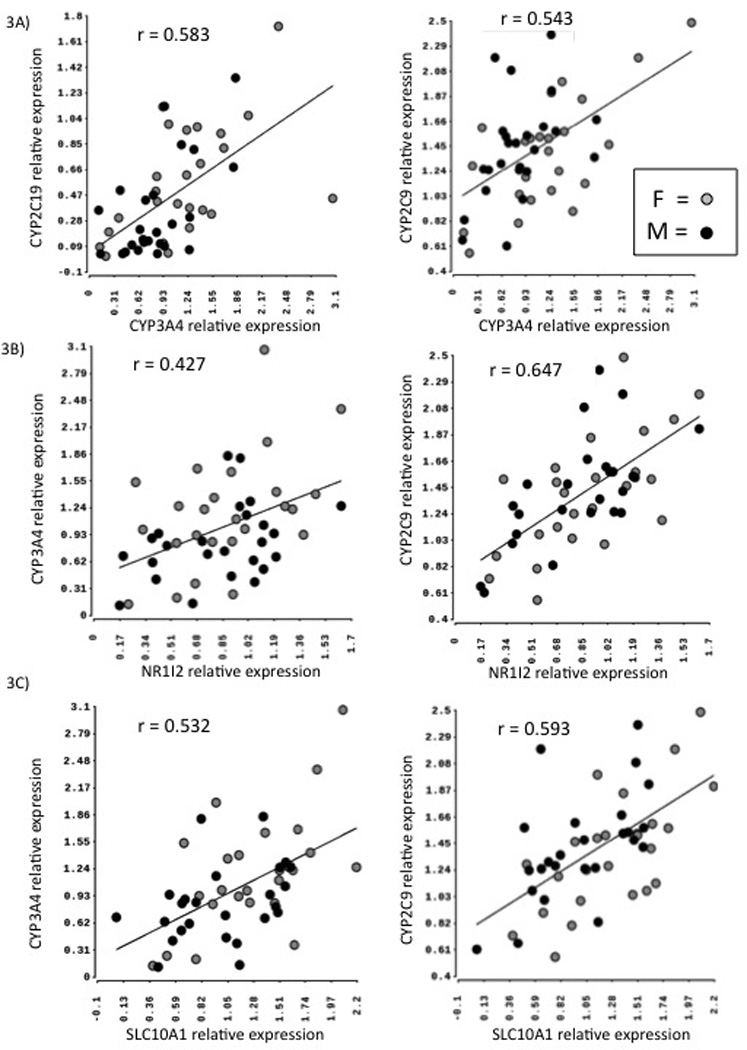
Correlation of mRNA expression levels of CYPs with each other and with hepatic transcription factors. A) Scatter plots of relative mRNA expression of CYP3A4 with that of CYP2C19 and CYP2C9. Scatter plots of relative mRNA expression of Nr1I2 (B) and SLC10A1 (C) with that of CYP2C9 and CYP3A4 respectively in 50 human liver samples. F: Females; M: Males. r = Pearson’s correlation coefficient.
3.4. Correlation patterns within hepatic miRNA expression profiles
Among miRNAs, significant correlations (both positive and negative) were observed between several miRNAs. Supplementary Table 1 and heatmap in supplementary Fig. 2B, summarizes all miRNA-miRNA correlation results. Interestingly, miR-34a expression levels were positively correlated with levels of miR-135a, miR-150, miR-152, miR-200a, miR-23a and miR-27a (all Spearman correlation ps <0.05); and negatively with miR-10a (Spearman correlation p =0.002); while miR-148 was positively correlated with miR-23b and miR-27b (Spearman correlation p <0.003).
3.5. Correlations between hepatic mRNA and miRNA expression levels
We analyzed the miRNA-mRNA correlations in all samples together and separately in males and females. As shown in the heatmap in Fig. 4A, we observed significant positive and negative correlations between miRNAs and mRNAs. The most interesting results included positive correlations of mir-148a with multiple target genes such as AKR1D1 (p =0.001), CYP2B6 (p =0.003), CYP2C9 (p =0.0005), CYP2C19 (p =0.003), CYP3A4 (p =0.00003), EHHADH (p =0.0005), FOXA2 (p =0.004), HNF4α (p =0.01), NR1I2 (p =0.004), NR1I3 (p =0.004), PPARGC1α (p =0.02), RXRA (p =0.004) and SLC10A1 (p =0.001); and negative correlations of mir-34a with CYP3A4 (p =0.0004), CYP2C19 (p = 6.04E-07), AKR1D1 (p =0.0004), HNF4α (p =0.04), NR1I2 (p =0.02), NR1I3 (p =0.004)and SLC10A1 (p =0.003); miR-34a also demonstrated positive correlation with NCOA6 (p =0.0002) (Fig. 4B). Additionally miR-150 was negatively associated with CYP3A4 (p =0.02), NR1I2 (p =0.003) and NR1I3 (p =0.01) and miR-27a was negatively correlated with CYP2C19 (p =0.03), AKR1D1 (p =0.006), EHHADH (p =0.02), FOXA2 (p =0.002), HNF4α (p =0.006), NR1I2 (p =0.005) and SLC10A1 (p =0.005). miR-138, miR-200a and miR-27a were positively correlated with a transcriptional co-repressor NCOR2 (SMRT) (Spearman rank correlation p = 0.002, 0.002 and 0.046, respectively). Most of the miRNA-mRNA correlations observed in the combined cohort were conserved when the analyses were separated by gender. However, we did observe some additional gender specific miRNA-mRNA correlations. In females, miR-10a was correlated with CYP3A4 (p =0.033) and NCOA6 (p =0.02); miR-135a with CEBPα (p =0.02) and SLC10A1 (p =0.04); miR-150 with NR3C1 (p =0.04), and miR-23a with NCOA6 and PPARG1α (p <0.01 for both). In males, miR-10 and miR-152 were associated with MED25 (p =0.034) and NCOA1 (p =0.034), miR-10b with CEBPα, NR1I3 and NR3C1 (all p <0.05); miR-128a with EHHADH (p =0.002); miR-150 with CYP2C9 (p =0.001), EHHADH (p =0.001) and PPIA (p =0.03).
Fig. 4.
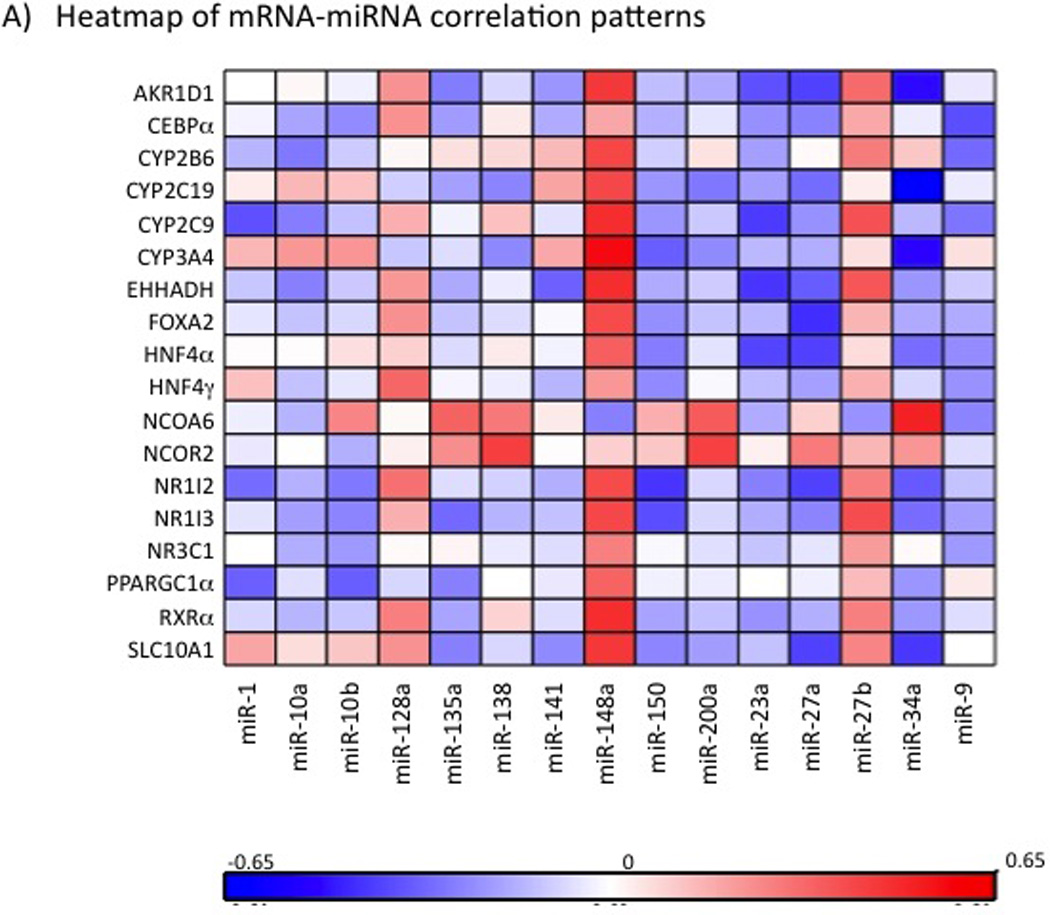
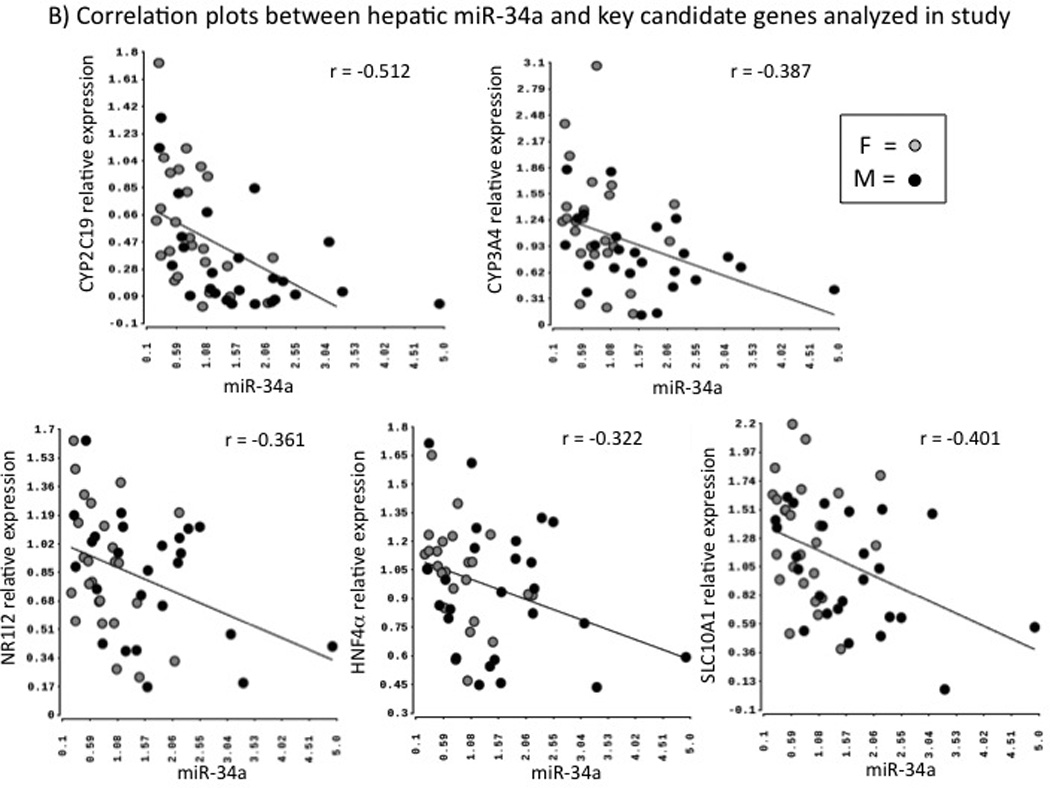
Correlation of miRNAs with mRNAs. 4A) Heatmap of correlation analysis of miRNAs and 21 genes of importance in drug metabolism. Each row represents a mRNA and each column represents a miRNA. Spearman correlation coefficients were calculated to determine relationship of each miRNA with individual mRNAs. Positive correlation coefficients are indicated in red and negative in blue, with higher correlation indicated by higher color intensity as shown by the color scale. Little or no correlations are indicated in white. 4B). Scatter plots of hsa-miR-34a expression with relative mRNA expression of CYP2C19, CYP3A4, SLC10A, NR1I2, and HNF4α respectively. F: Females; M: Males. r = Pearson’s correlation coefficient.
3.6. Mediation analysis to test for miRNA mediation between hepatic CYPs and TFs
A mediation analysis was conducted to evaluate the potential role of miR-34a and miR-150 in mediating the association observed between CYPs and TFs. The analysis could only be carried out in the combined dataset due to the small sample size. The analysis demonstrated that miR-34a was indeed involved in significant mediation of the association observed between CYP2C19 and several hepatic transcription factors (HNF4α, NR1I2). Interestingly, miR-34a was also involved in significant mediation of the association observed between CYP2C19 and AKR1D1 and SLC10A1 (Table 3). In most of these cases, miR-34a was observed to mediate a significant proportion of the association observed between the CYP-TF pair. In contrast, even though miR-150 was negatively correlated with several CYPs, it did not mediate a significant proportion of the interaction between these CYPs and the TFs studied, suggesting that additional TFs/hepatic genes not covered in this study could be involved.
Table 3.
Mediation analysis: Association between CYP2C19 and several hepatic TFs is partially mediated by miR-34a
| CYP | TF | miRNA | b0 | b1 | PTE |
|---|---|---|---|---|---|
| CYP2C19 | HNF4α | mir-34a | 0.483 | 0.354 | 0.266 |
| CYP2C19 | NR1I2 | mir-34a | 0.377 | 0.221 | 0.413 |
| CYP2C19 | AKR1D1 | mir-34a | 0.416 | 0.231 | 0.445 |
| CYP2C19 | SLC10A1 | mir-34a | 0.375 | 0.2 | 0.465 |
b0=coefficient of CYP-TF association; b1=coefficient of CYP-TF association, adjusting for miRNA; PTE= proportion of total TF effect “explained” (PTE) by miRNA
4. Discussion
miRNAs are short (21–23 bp) noncoding RNAs that have been recognized as potential regulators of gene expression in various tissue/cell types. Research in recent years has established their role in various cellular processes such as cell proliferation, differentiation, apoptosis and necrosis. However the potential role of miRNAs in regulating genes of importance in drug metabolism is still largely unknown and an assessment of their impact on DME gene expression is needed. Although the role of nuclear hormone receptors in regulating the expression of CYP3A4, CYP2C19 and CYP2C9 has been considerably defined, the role played by transcriptional and miRNA networks in regulation of CYP gene expression, and their contributions to the variability observed in CYP expression is still largely undefined.
This study was designed to evaluate the role of miRNAs in regulating hepatic gene expression of drug metabolizing genes (CYP2B6, CYP2C19, CYP2C9 and CYP3A4) either directly or indirectly by influencing the expression levels of hepatic transcription factors involved in transcriptional regulation of these CYPs. We quantitated 4 CYPs, 14 transcription factors and 3 additional genes along with 22 miRNAs (with predicted binding sites in the 3’UTR regions of CYPs/TFs/other genes being studied) in 50 human liver specimens (25 females, 25 males).
Our results identified miR-34a as a strong predictor of mRNA levels of CYP3A4, CYP2C19, and several hepatic transcription factors and other significant genes of interest (NR1I2, NR1I3, HNF4α, SLC10A1 and AKR1D1). These findings suggest that miR-34a may be a potential direct or indirect master negative regulator of CYP expression. Additionally, in silico miRNA binding site predictions from the Targetscan database also indicate strong miR-34a binding sites in NR1I2 and HNF4α. miR-34a has been previously shown to influence the mRNA expression levels of HNF4α, and it has been documented that miR-34a mediates repression of protein levels of HNF4α and is a significant contributor to down-regulation of HNF4α binding activity and its transactivation [6,9]. miR-34a has also been implicated in regulation of Nrf2 [16]. Our results further demonstrate a network of interactions indicating miR-34a as potential repressor of multiple genes (in addition to HNF4α) such as NR1I2 and NR1I3 that have key roles in regulation of CYP gene expression.
Our results also implicate miR-34a in mediating down regulation of both AKR1D1 and SLC10A1, which can cause downstream effects on ligand-mediated transcriptional regulation of P450s. AKR1D1 plays a significant role in bile acid synthesis and SLC10A1 is a bile acid transporter. Bile acids are ligand activators of multiple nuclear hormone receptors such as farnesoid X receptor (FXR), pregnane X receptor (PXR; NR1I2), and constitutive androstane receptor (CAR; NR1I3), which in turn are involved in transcriptional regulation of multiple CYPs. Overexpression of AKR1D1 in primary human hepatocytes has been demonstrated to enhance expression of various cytochrome P450s [17].
To investigate if the identified miRNAs mediated some of the CYP-TF associations seen in our study, a mediation analysis was conducted to assess whether miR-34a and miR-150 potentially mediated any of the associations observed between the CYPs and TFs. The analysis demonstrated that miR-34a was indeed involved in significant mediation of the association observed between CYP2C19 and several transcription factors/hepatic genes (HNF4α, NR1I2, AKR1D1, SLC10A1). In contrast, even though miR-150 was negatively correlated with several CYPs, it did not mediate a significant proportion of the interaction between these CYPs and the TFs, suggesting that additional TFs/hepatic genes not covered in this study could be involved.
Although additional in vitro functional studies are needed to establish the precise molecular mechanism/s underlying miR-34a mediated repression, our results are strongly supportive of a key role for miR-34a in directly/indirectly regulating DME expression. Our data are also in concordance with a very recent report where miR-34a was negatively associated with CYP expression and/ activity in liver samples [1]. Furthermore, our findings may have important clinical implications as miR-34a is a known tumor suppressor and is upregulated in several cancers including hepatocellular carcinomas [18]. Given the observed association of miR-34a with expression levels of multiple CYPs and their regulatory TFs, its upregulation could potentially lead to repression of DME levels in such cancer patients, potentially altering drug efficacy or toxicity.
Another interesting observation was the positive association of mir-148a with expression levels of multiple genes within the CYP regulatory reactome. miR-148 is down-regulated in several types of cancers such as pancreatic cancer [19], gastric cancer [20], colon, breast, lung, head and neck cancer, as well as melanoma [21] and hepatoblastoma [22]. Due to this reduced expression in tumors it has been speculated that miR-148a might serve as a tumor suppressor and be potentially critical for tumorigenesis. Some of the known target genes of miR-148a include genes involved in DNA methylation pathways such as TGIF2 [21], DNMT1 [23], DNMT3b [24] and MSK1 [25]. It is possible that as mir-148a is involved in repressing DNA methyl transferases (DNMT1 and DNMT3b), the over-expression of miR-148 could result in DNA hypomethylation thereby resulting in higher expression levels of CYPs or upstream regulators of CYPs. Although our in silico analysis identified miRNA148 binding sites in several candidate genes including PPARGC1α, Ncoa1, NR1I2, CYP2B6, HNF4α and RXRα, its association with these genes was mixed (e.g., with Med25 and NcoA1 there was little or no association), while positive associations were noted with several others (e.g., CYP3A4, NR1I2 and HNF4α). It is quite likely that the association of miR-148a with several of the DME/TF genes observed in our study is indirect and being mediated through transcription factors not analyzed. Work is underway to functionally characterize the molecular mechanisms underlying these observed positive and negative associations.
In conclusion, the current work evaluated the hepatic expression profiles of 21 genes of importance in drug metabolism including 4 CYPs and 14 hepatic transcription factors as well as 22 miRNAs that were predicted to have binding sites in these genes. Significant correlations were observed between miRNA expression levels and levels of several DMEs and other genes of regulatory significance indicating direct or indirect involvement of miRNAs in regulating hepatic DME gene expression networks. Of particular interest, a potential role for miR-34a in repressing and of mir-148a in enhancing the expression levels of DMEs such as CYP3A4 and CYP2C19 was identified. This effect could be direct or indirect through regulation of expression levels of hepatic transcription factors such as NR1I2, NR1I3 and HNF4α (known transcriptional regulators of CYPs) or through regulating bile acid mediated ligand activation of NR1I2 or NR1I3 (by influencing SLC10A1 and AKR1D1). We also observed miR-34a expression to be significantly higher in males than females; this was in alignment with lower CYP3A4 expression in males as compared to females; thus indicating a possible role of miRNAs in mediating gender differences in expression of DMEs. With respect to mir-148a, our results demonstrate for the first time its positive association with NR1I2, NR1I3, HNF4α, RXRα, PPARGC1α and the four CYPs, indicating its potential (indirect) importance to drug metabolism. As miR-34a and miR-148a both are tumor suppressors and as their expression is altered in hepatic malignancies, our results have potential implications for anticancer drug therapy. These results suggest an important role for miRNAs in regulating hepatic gene expression networks associated with drug metabolism and warrant further studies to evaluate the role of miRNAs as predictive markers of drug disposition.
Supplementary Material
Highlights.
Expression profiled key CYPs, transcription factors (TFs) and miRNAs in human livers.
Several targets were highly variable in expression and different between genders.
miR-34a was negatively correlated with CYP3A4, CYP2C19, NR1I2 and HNF4α.
miR-34a, miR-150 expression was significantly higher in males than in females.
miR-34a significantly mediates CYP2C19 association with HNF4α and NR1I2.
Acknowledgments
We are deeply thankful to Dr Jatinder K. Lamba for her insightful comments and suggestions on the manuscript. Research was supported by the Building Interdisciplinary Research Careers in Women’s Health Grant (# K12HD055887) from the Eunice Kennedy Shriver National Institutes of Child Health and Human Development (NICHD), the Office of Research on Women’s Health, and the National Institute on Aging, NIH, administered by the University of Minnesota Deborah E. Powell Center for Women’s Health. The content is solely the responsibility of the authors and does not necessarily represent the office views of the NICHD or NIH.
Abbreviations
- miRNA
microRNA
- DME
Drug Metabolizing Enzyme
- CYP
Cytochrome P450
- ADME
Absorption, Disposition, Metabolism and Elimination
- TF
Transcription Factor
- PCT
Probability of Conserved Targeting for highly conserved miRNA families
Footnotes
Publisher's Disclaimer: This is a PDF file of an unedited manuscript that has been accepted for publication. As a service to our customers we are providing this early version of the manuscript. The manuscript will undergo copyediting, typesetting, and review of the resulting proof before it is published in its final citable form. Please note that during the production process errors may be discovered which could affect the content, and all legal disclaimers that apply to the journal pertain.
References
- 1.Rieger JK, Klein K, Winter S, et al. Expression Variability of ADME-Related Micrornas in Human Liver: Influence of Non-Genetic Factors and Association with Gene Expression. Drug Metab. Dispos. 2013;41:1752–1762. doi: 10.1124/dmd.113.052126. [DOI] [PubMed] [Google Scholar]
- 2.Ramamoorthy A, Skaar TC. In silico identification of microRNAs predicted to regulate the drug metabolizing cytochrome P450 genes. Drug Metab. Lett. 2011;5:126–131. doi: 10.2174/187231211795305258. [DOI] [PMC free article] [PubMed] [Google Scholar]
- 3.Tsuchiya Y, Nakajima M, Takagi S, et al. MicroRNA regulates the expression of human cytochrome P450 1B1. Cancer Res. 2006;6:9090–9098. doi: 10.1158/0008-5472.CAN-06-1403. [DOI] [PubMed] [Google Scholar]
- 4.Takagi S, Nakajima M, Mohri T, et al. Post-transcriptional regulation of human pregnane X receptor by micro-RNA affects the expression of cytochrome P450 3A4. J. Biol. Chem. 2008;283:9674–9680. doi: 10.1074/jbc.M709382200. [DOI] [PubMed] [Google Scholar]
- 5.Mohri T, Nakajima M, Fukami T, et al. Human CYP2E1 is regulated by miR-378. Biochem. Pharmacol. 2010;79:1045–1052. doi: 10.1016/j.bcp.2009.11.015. [DOI] [PubMed] [Google Scholar]
- 6.Ramamoorthy A, Li L, Gaedigk A, et al. In silico and in vitro identification of microRNAs that regulate hepatic nuclear factor 4alpha expression. Drug Metab. Dispos. 2012;40:726–733. doi: 10.1124/dmd.111.040329. [DOI] [PMC free article] [PubMed] [Google Scholar]
- 7.Yu AM. Role of microRNAs in the regulation of drug metabolism and disposition. Expert Opin. Drug Metab. Toxicol. 2009;5:1513–1528. doi: 10.1517/17425250903307448. [DOI] [PubMed] [Google Scholar]
- 8.Yokoi T, Nakajima M. microRNAs as mediators of drug toxicity. Annu. Rev. Pharmacol. Toxicol. 2013;53:377–400. doi: 10.1146/annurev-pharmtox-011112-140250. [DOI] [PubMed] [Google Scholar]
- 9.Grimson A, Farh KK, Johnston WK, et al. MicroRNA targeting specificity in mammals: determinants beyond seed pairing. Mol. Cell. 2007;27:91–105. doi: 10.1016/j.molcel.2007.06.017. [DOI] [PMC free article] [PubMed] [Google Scholar]
- 10.Yang X, Zhang B, Molony C, et al. Systematic genetic and genomic analysis of cytochrome P450 enzyme activities in human liver. Genome Res. 2010;20:1020–1036. doi: 10.1101/gr.103341.109. [DOI] [PMC free article] [PubMed] [Google Scholar]
- 11.Hurley J, Roberts D, Bond A, et al. Stem-loop RT-qPCR for microRNA expression profiling. Methods Mol. Biol. 2012;822:33–52. doi: 10.1007/978-1-61779-427-8_3. [DOI] [PubMed] [Google Scholar]
- 12.Andersen CL, Jensen JL, Orntoft TF. Normalization of real-time quantitative reverse transcription-PCR data: a model-based variance estimation approach to identify genes suited for normalization, applied to bladder and colon cancer data sets. Cancer Res. 2004;64:5245–5250. doi: 10.1158/0008-5472.CAN-04-0496. [DOI] [PubMed] [Google Scholar]
- 13.Latham GJ. Normalization of microRNA quantitative RT-PCR data in reduced scale experimental designs. Methods Mol. Biol. 2010;667:19–31. doi: 10.1007/978-1-60761-811-9_2. [DOI] [PubMed] [Google Scholar]
- 14.Vandesompele J, De Preter K, Pattyn F, et al. Accurate normalization of real-time quantitative RT-PCR data by geometric averaging of multiple internal control genes. Genome Biol. 2002;3:RESEARCH0034. doi: 10.1186/gb-2002-3-7-research0034. [DOI] [PMC free article] [PubMed] [Google Scholar]
- 15.Baron RM, Kenny DA. The moderator-mediator variable distinction in social psychological research: conceptual, strategic, and statistical considerations. J. Pers. Soc. Psychol. 1986;51:1173–1182. doi: 10.1037//0022-3514.51.6.1173. [DOI] [PubMed] [Google Scholar]
- 16.Li N, Muthusamy S, Liang R, et al. Increased expression of miR-34a and miR-93 in rat liver during aging, and their impact on the expression of Mgst1 and Sirt1. Mech. Ageing Dev. 2011;132:75–85. doi: 10.1016/j.mad.2010.12.004. [DOI] [PubMed] [Google Scholar]
- 17.Chaudhry AS, Thirumaran RK, Yasuda K, et al. Genetic Variation in Aldo-Keto Reductase 1D1 (AKR1D1) Affects the Expression and Activity of Multiple Cytochrome P450s. Drug Metab. Dispos. 2013;41:1538–1547. doi: 10.1124/dmd.113.051672. [DOI] [PMC free article] [PubMed] [Google Scholar]
- 18.Dang Y, Luo D, Rong M, et al. Underexpression of miR-34a in hepatocellular carcinoma and its contribution towards enhancement of proliferating inhibitory effects of agents targeting c-MET. PLoS One. 2013;8:e61054. doi: 10.1371/journal.pone.0061054. [DOI] [PMC free article] [PubMed] [Google Scholar]
- 19.Liffers ST, Munding JB, Vogt M, et al. MicroRNA-148a is down-regulated in human pancreatic ductal adenocarcinomas and regulates cell survival by targeting CDC25B. Lab Invest. 2011;91:1472–1479. doi: 10.1038/labinvest.2011.99. [DOI] [PubMed] [Google Scholar]
- 20.Zheng B, Liang L, Wang C, et al. MicroRNA-148a suppresses tumor cell invasion and metastasis by downregulating ROCK1 in gastric cancer. Clin. Cancer Res. 2011;17:7574–7583. doi: 10.1158/1078-0432.CCR-11-1714. [DOI] [PubMed] [Google Scholar]
- 21.Lujambio A, Calin GA, Villanueva A, et al. A microRNA DNA methylation signature for human cancer metastasis. Proc. Natl. Acad. Sci. 2008;105:13556–13561. doi: 10.1073/pnas.0803055105. [DOI] [PMC free article] [PubMed] [Google Scholar]
- 22.Magrelli A, Azzalin G, Salvatore M, et al. Altered microRNA Expression Patterns in Hepatoblastoma Patients. Transl. Oncol. 2009;2:157–163. doi: 10.1593/tlo.09124. [DOI] [PMC free article] [PubMed] [Google Scholar]
- 23.Braconi C, Huang N, Patel T. MicroRNA-dependent regulation of DNA methyltransferase-1 and tumor suppressor gene expression by interleukin-6 in human malignant cholangiocytes. Hepatology. 2010;51:881–890. doi: 10.1002/hep.23381. [DOI] [PMC free article] [PubMed] [Google Scholar]
- 24.Duursma AM, Kedde M, et al. miR-148 targets human DNMT3b protein coding region. RNA. 2008;14:872–877. doi: 10.1261/rna.972008. [DOI] [PMC free article] [PubMed] [Google Scholar]
- 25.Fujita Y, Kojima K, Ohhashi R, et al. MiR-148a attenuates paclitaxel resistance of hormone-refractory, drug-resistant prostate cancer PC3 cells by regulating MSK1 expression. J. Biol. Chem. 2010;285:19076–19084. doi: 10.1074/jbc.M109.079525. [DOI] [PMC free article] [PubMed] [Google Scholar]
Associated Data
This section collects any data citations, data availability statements, or supplementary materials included in this article.