Abstract
This paper presents the design and characterization of a three-axis thermomechanical actuator-based endoscopic scanner for obtaining ex vivo two-photon images. The scanner consisted of two sub-systems: 1) an optical system (prism, gradient index lens, and optical fiber) that was used to deliver and collect light during imaging and 2) a small-scale silicon electromechanical scanner that could raster scan the focal point of the optics through a specimen. The scanner can be housed within a 7 mm Ø endoscope port and can scan at the speed of 3 kHz × 100 Hz × 30 Hz along three axes throughout a 125 × 125 × 100 μm3 volume. The high-speed thermomechanical actuation was achieved through the use of geometric contouring, pulsing technique, and mechanical frequency multiplication (MFM), where MFM is a new method for increasing the device cycling speed by pairing actuators of unequal forward and returning stroke speeds. Sample cross-sectional images of 15-μm fluorescent beads are presented to demonstrate the resolution and optical cross-sectioning capability of the two-photon imaging system.
Index Terms: Thermomechanical actuators, mechanical frequency multiplier, two-photon excitation, endomicroscope, optical scanner
I. Introduction
The development of a two-photon excitation (TPE) endomicroscope enables real-time sub-cellular resolution volumetric imaging with an imaging depth of 200–500 microns. This instrument has the potential to serve as a powerful tool for clinicians and pathologists to improve their diagnostic accuracy and efficiency and ultimately realize the concept of “optical biopsy”.
Typical TPE microscope raster scans a point focus in 3D to produce a volumetric image. The design of a TPE endomicroscope requires miniaturization fitting a three-axis scanner within the envelope of an endoscope. The scanners must operate at relatively high speed, e.g. 1–3 kHz to achieve a clinically acceptable frame rate. The scanning range of each individual micro-scanner defines the field of view of the endomicroscope that is typically on the order of tens to hundreds of microns on a side. As such, selections of micro-actuators/scanners that are compatible with silicon fabrication process and simultaneously fulfill the range and speed requirement are critical. Existing confocal or TPE endomicroscope systems utilize piezoelectric actuators [1]–[4] or electrostatic actuators, e.g. MEMS mirrors [5]–[8] for actuation and scanning. These actuators operate at high voltage, and thus present a safety concern for in vivo operations. A few thermomechanical actuator-based MEMS scanners were used in endoscopic optical coherence tomography imaging system with limited scanning speed, i.e. less than 5 frames per second [9], [10]. A low voltage and low power high-speed scanning system has yet to be developed.
In this work, we present the modeling, design, fabrication, and characterization of a high-speed three-axis optical scanning system for TPE endoscopy application—all with thermomechanical actuators (TMA). TMAs are known for their high force/power density but with limited bandwidth; we show by applying the “geometric contouring” and the “mechanical frequency multiplication (MFM)” design concept, a TMA-based high-speed endoscopic scanning system may be developed to generate real-time two-photon volumetric images with low operation voltage, i.e. less than 5V and low power level, i.e. 150mW. Although a TMA runs at high temperature, e.g. 1000 K, it causes no danger with proper insulation since the heated volume is on the micron scale and this energy dissipates quickly as long as the power level is low.
1) Functional Requirements
A TPE endomicroscope generates tissue images by scanning the focused point of light throughout a volume. For in vivo imaging, the scanning process should be fast such that the physiological motions, such as heart beat, of the subject do not compromise the fidelity of the image. Depending upon the number and the size of optical sections, this constraint will set the scanning speed and range. To satisfy the aforementioned requirements and constraints, the endoscopic scanner should operate at 3 kHz, 30 Hz, and 2 Hz for the X, Y, and Z (optical) axis respectively. With a 2D frame rate of 30Hz and a 3D image rate of 2Hz, motion artifacts will cause variances in the axial spacing between 2D frames but each 2D frame will remain mostly motion artifact free. This inaccuracy in the axial direction is often tolerable because histopathologists base their analyses primarily on 2D image morphological features. The focused laser should scan 100 microns in all three axes to sample a sufficiently large tissue volume. The envelope of the scanner should reside within a 7mm Ø endoscope port. These clinically driven functional requirements are summarized in Table I. The preliminary ex vivo experiments presented later in this paper were scanned at 1kHz, 2Hz, and 0.1Hz in each axis in order to increase the signal to noise ratio. Note for some in vivo experiments, where weak endogenous fluorescent signals are used to generate images, the frame rate is actually limited by the signal strength rather than the mechanical scan speed.
TABLE I.
Functional Requirements and Constraints of the Endoscopic Scanner
| X-axis | Y-axis (θx) | Z-axis | |
|---|---|---|---|
| Range | 100 μm | 100 μm (2°) | 100 μm |
| Speed (in vivo) | 3 kHz | 30 Hz | 2 Hz |
| Speed (ex vivo) | 1 kHz | 2 Hz | 0.1 Hz |
| Envelope | Within a 7mm diameter tube | ||
II. Design for the Distal Optics of a TPE Endomicroscope
Figure 1 shows the optical design of the TPE endomicroscope system. In this system, ultrafast optical pulses from a Ti:Sappire laser with 100fs pulse width, 80MHz repetition rate at the center wavelength of 780nm (MaiTai, Spectra-Physics, Mountain View, CA) were used as the excitation light source. A double clad photonic crystal fiber (DCPCF) (DC-165-16-Passive, Crystal Fibre A/S) was used to deliver both the excitation and emission light. (DCPCF allows a single mode excitation beam delivery through its core and emission beam delivery through the core and inner clad, thereby simplifying the endomicroscope design and increasing the detection efficiency.) A pre-chirping unit was used to precompensate the linear pulse dispersion induced by DCPCF and maximize the two-photon excitation efficiency, which is inversely proportional to the pulse width of the excitation beam. After propagating through the DCPCF, the pulsed excitation beam was guided to the silicon scanning bench, going through a prism and lastly a gradient index (GRIN) lens as the objective lens (GRINTECH: GT-LFRL-100-017; NA = 0.5). The emission from the focal point in the sample then traveled back through the optical train, and was guided to a photo-multiplier tube (PMT) detector via a dichroic mirror (DM). The relative positions among different optical components were optimized by ray-tracing analysis with Zemax (Radiant Zemax, Redmond, WA) in order to maximize resolution and minimize aberrations.
Fig. 1.

Optical configuration of the TPE endomicroscope system.
To obtain volumetric images, the DCPCF, prism, and GRIN lens need to be scanned in the X, θX, and Z direction respectively. The DCPCF will generate the X-axis scanning motion by a TMA-based fiber resonator; the prism and the objective GRIN lens will generate the Y-axis and Z-axis scanning respectively by TMA-actuated shuttles on the silicon scanning bench. Note that the Y-axis scan is performed via oscillating the prism about the θX axis; the 100 micron requirement is equivalent to a 2° angular scanning motion.
III. TMA-Based Two-Axis Silicon Scanning Bench
This section presents the modeling, design, and experimental characterization of the two-axis endoscopic scanner. Figure 2A shows the optical system on the silicon optical bench. The scanner is comprised of a GRIN lens shuttle and a prism shuttle, each integrated with guiding flexures and TMAs. The GRIN lens and the prism are of millimeter scale; the optical bench provides micrometer-level precision alignment for the lenses. The performance of the chevron TMAs are optimized through the geometric contouring technique [11]. High-speed operation may be achieved through the application of the high-speed pulsing technique [12].
Fig. 2.

Schematics (A) and fabricated (B) 2-axis endoscopic scanner with integrated GRIN lens, prism and TMA actuators.
A. Flexural Bearing for Motion Guidance and Amplification
The scanner consists of two sets of flexural bearings with chevron TMA trains, i.e. the GRIN lens shuttle and the prism shuttle. The chevron TMAs were selected over parallel TMAs because for a given footprint they were able to run in parallel and generate larger force output without sacrificing the stroke. TMAs used in the system were optimized via “geometric contouring” technique with the following objective: (1) minimize power consumption and (2) maximize stroke. This was desired because the TMA trains on the scanner operate at a moderate speed of 30Hz and 2Hz, but require a rather large stroke of 100 microns. The speed is not critical here as with the pulsing technique the TMA train is able to achieve a 10-times faster cycling speed [12]. As the flexure mechanism may easily provide more than 10X motion amplification, the required stroke for individual TMA was set to be 10 micron. The optimal design parameters were selected by using the contoured chevron TMA performance charts provided in [11]. The TMA performance for the GRIN lens shuttle and the prism shuttle was modeled and is summarized in Table II.
TABLE II.
Simulated Performance of Contoured TMA for the Optical Scanner
| TMA for th GRIN lens shuttle | |
| Stroke | 10 μm |
| Operating voltage | 2.8 V |
| Operating temperature | 580 K |
| TMA bandwidth | 8 Hz (before pulsing) |
| Max. force output | 10 mN |
| TMA for the prism shuttle | |
| Stroke | 14 μm |
| Operating voltage | 2.8 V |
| Operating temperature | 580 K |
| TMA bandwidth | 16 Hz (before pulsing) |
| Max. force output | 8 mN |
1) Translation Flexural Bearing Concept
The flexural bearing that was actuated by the TMA trains provides precision guidance and reduced parasitic motion for active optical components. As shown in Figure 2A, the flexural bearing that carries the objective GRIN lens generates linear motion and travels 100 microns. This flexural bearing consists of a two–stage chevron amplification mechanism that was driven by two sets of chevron TMA trains. The symmetric design is used to prevent lateral parasitic motion. Note that only the chevron TMA train was used as an actuator. The interlinking chevron flexure was for transmitting/amplifying mechanical motion, and did not experience internal heat generation.
2) Rotary Flexural Bearing Concept
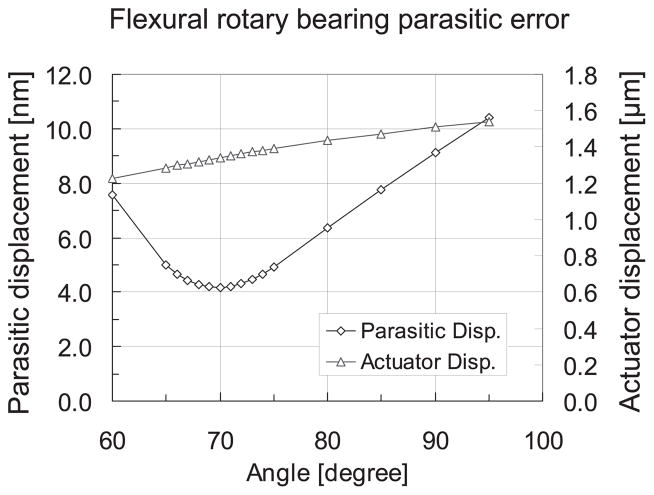
The second flexural bearing carried the prism and generated rotary motion about the instant center over +2.50°. This rotary bearing was driven by the two-stage chevron amplification mechanism and chevron TMA train, shown in Figure 2A. The shuttle that carries the prism was part of a flexural four-bar mechanism. The instant center of this four-bar mechanism was designed to be on the reflecting point of the prism’s inner surface. Parasitic translational motion should therefore be minimized during the rotation. By supplying the TMA train a constant power and varying the angle between the two supporting flexures of the four-bar mechanism, the optimal angle of the four-bar mechanism can be found. As shown in Figure 3, at 70° the flexural rotary bearing yields 6 nm of parasitic motion at full stroke (2.5°). As the GRIN lens and prism weigh 1.5 and 1.2 grams respectively, the gravity effects on both shuttles were modeled and proven to be below a level that would cause practical concern.
Fig. 3.
Flexural rotary bearing optimization. Note that at 70° the ratio of parasitic displacement over actuator displacement is 2.9 × 10⁻³ [mm/mm].
B. Mechanical Impedance Matching
With the optimized flexural four-bar mechanism, we now model the cascaded chevron flexure in order to optimize its transmission ratio, defined as the ratio of the output displacement to the input displacement.
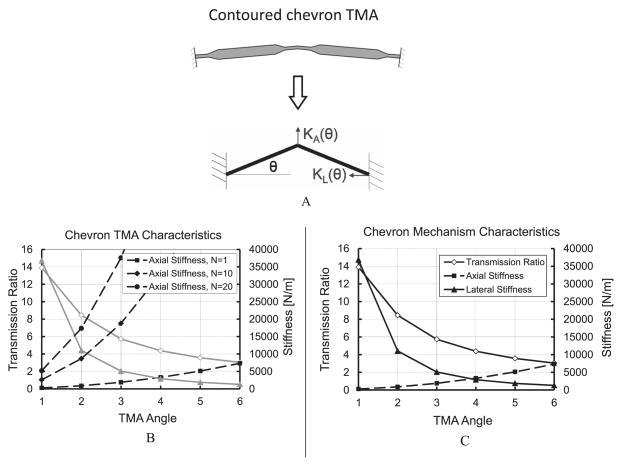
The transmission ratio, axial stiffness, and lateral stiffness of a chevron flexure, are all functions of the angle (θ) between the chevron beam and the horizontal line shown in Figure 4A. In Figure 4B, the transmission ratio and the lateral stiffness of a chevron mechanism drop sharply, while the axial stiffness increases gradually, as the angle (θ) increases. It is not uncommon for designers to attempt to cascade two chevron mechanisms at small angles in order to receive a large transmission ratio. In fact, this design will result in a low transmission ratio because of the mismatch between the axial and lateral stiffness of the first (TMA) and second (amplification flexure) chevron mechanisms that are shown in Figure 5.
Fig. 4.
Transmission ratio, axial, lateral stiffness of a chevron mechanism as a function of angle and the number of chevron TMAs. A: Contoured chevron TMA model, where θ is the TMA angle, KA and KL are the axial and latteral stiffness of the TMA; B: Characteristics of a single chevron mechanism; C: Increased axial stiffness by devising 10 or 20 chevron TMAs in parallel.
Fig. 5.

Two–spring model for the cascaded chevron mechanism.
A basic concept that may be used for optimizing the energy transfer from the first chevron TMA to the second chevron mechanism is to match their mechanical impedance, i.e. design the chevron flexures so that the axial stiffness (KA1) and lateral stiffness (KL2) of the first and second chevrons are equal. There are two ways to adjust the relative values of KA1 and KL2 for mechanism optimization: (1) adjust angles of the first and second TMAs, i.e. θ1 and θ2, as shown in Figure 4B and Figure 5, or (2) use many chevron TMAs in parallel, where the effect of increased axial stiffness helps to increase the transmission ratio as shown in Figure 4C and Figure 5, where N represents the number of parallel TMAs. Although a large transmission ratio may be obtained through the second option, this may result in a large power requirement to run many TMAs simultaneously.
As shown in Figure 5, the cascaded chevron mechanism may be modeled as a two-spring system, where spring constants KA1(θ1) and KL2(θ2) represent the axial stiffness and the lateral stiffness of the first and second chevron mechanism respectively. The variable XIN represents the displacement of a chevron TMA (first chevron mechanism), and X is the output displacement of the cascaded system. The relationship between X and XIN is shown in Equation (1). The overall transmission ratio of the cascaded mechanism is shown in Equation (2). The stroke of cascaded system is the product of the input displacement and the transmission ratio, as shown in Equation (3).
| (1) |
| (2) |
| (3) |
Equation (2) was used to set a transmission ratio as a function of θ1 and θ2. Figure 6A presents the optimal transmission ratios as a function of the number of parallel TMAs. The normalized mechanism stroke, i.e., power efficiency, as a function of number of TMAs, may be obtained by dividing the optimal transmission ratio by the number of TMAs. Figure 6A indicates that more parallel TMAs lead to a larger transmission ratio. Unfortunately, there is a corresponding decrease in power efficiency, as shown in Figure 6B. A minimum number of TMAs should be used if the optimization objective is to minimize the power consumption.
Fig. 6.
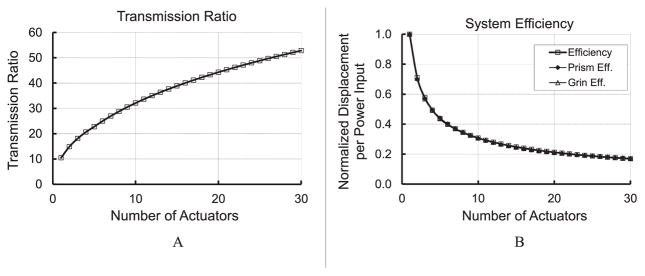
A: Optimal transmission ratio as a function of number of TMAs; B: Power efficiency as a function of number of TMAs.
A general approach that may be used to obtain an efficient design is summarized below:
Step 1: Determine the required stroke (S) from functional requirements.
Step 2: Determine the required displacement (d) of an individual TMA.
Step 3: Determine the required optimal transmission ratio (TR) by dividing the system stroke by the individual TMA’s displacement (TR = S/d).
Step 4: Obtain the corresponding values for θ1 and θ2 for the optimal transmission ratio from the transmission equation.
Note that using Equation (2), we can obtain surface plots of the transmission ratio as a function of θ1 and θ2 with different number of TMAs, shown in Figure 7A. When the required transmission ratio is determined, optimal values of θ1 and θ2 can be found through the surface plot, as shown in Figure 7B.
Fig. 7.
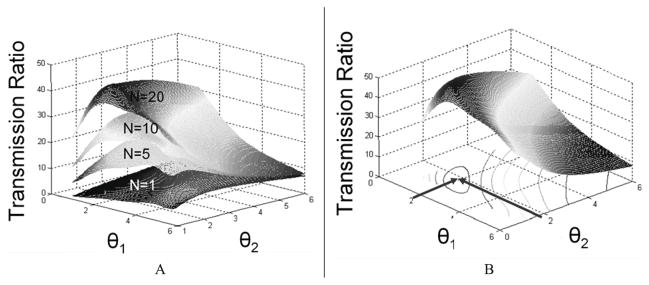
Transmission ratio surface plot as a function of θ1, θ2, and number of TMAs (N).
C. Modeling and Optimization
In this section, we discuss how best design is achieved. We first consider two optimization objectives: (1) temperature minimization design and (2) power minimization design. The GRIN lens shuttle is used as an example to demonstrate the design process.
As the scanner is designed for in vivo operation, one may desire a reduced operating temperature. The design process is: (1) determine the TMA’s maximum operating temperature from functional requirements, e.g., 150°C, (2) optimize the TMA’s performance, e.g. stroke, at the specified temperature by the geometric contouring method, and (3) obtain the required number of TMAs and the relative optimal transmission ratio from Equation (2). This approach leads us to a 20-TMA design for 100 micron output displacement at 150°C, where the transmission ratio is 45.1, θ1 = 2.0°, and θ2 = 2.0°.
For the power minimization, we can set the maximum operating temperature to 1200 K as a TMA operates more efficiently at high temperature. Following the same design process, we find with the power minimization approach, we can achieve 100 micron output displacement with merely 2 parallel TMAs at 125 mW power consumption. The related transmission ratio is 28.1, for θ1 = 2.5°, and θ2 = 3.6°.
Although to minimize operation temperature or power may seem reasonable, each of them has its drawbacks. For the low temperature design, the combined power consumption of the GRIN lens and prism shuttle on a single chip may be too high, i.e. 1.2W, making this device inefficient. For the low power design, the maximum stroke at 100 micron will be reached at 1200°K which leaves the device no room for additional displacement. Based on these analyses, a better approach is to set a fixed number of TMAs and optimize transmission ratio. Additionally, the use of more parallel TMAs increases the shuttle’s structural integrity.
For the best design, we choose the number of TMAs (N) to be 5. Accordingly, this design easily satisfies the stroke requirement, achieving a 100 micron output displacement at 160 mW power consumption, and a maximum stroke of 400 micron at 1200°K. The transmission ratio is 43.8, θ1 = 2.2°, and θ2 = 2.8°. The best design was thus chosen for fabrication and testing.
The design parameters and simulated performance of the GRIN lens shuttle and the prism shuttle for three different design objectives are summarized in Table III.
TABLE III.
Summary of Three Scanner Designs for Different Objectives
| Design I | Design II | Design III | |
|---|---|---|---|
| Low temperature | Low power | Best design | |
| Parameters | |||
| Transmission for GRIN shuttle | 45.1 | 23.8 | 43.8 |
| θ1 | 2.0° | 2.5° | 2.8° |
| θ2 | 2.0° | 3.6° | 2.2° |
| Stroke | 100 μm | 100 μm | 100 μm |
| Power (at full stroke) | 700 mW | 125 mW | 160 mW |
| Transmission for prism shuttle | 42.5 | 11.5 | 18.8 |
| θ1 | 2.0° | 5.0° | 4.5° |
| θ2 | 2.5° | 5.5° | 4.5° |
| Stroke | 2.0° | 4.0° | 8.0° |
| Power (at full stroke) | 500 mW | 50 mW | 125 mW |
IV. Experimental Results and Discussion
Figure 8 shows frequency spectrums of the GRIN lens and prism shuttle (note experimental data in this section were obtained with lenses loaded). The simulated first and second mode of the GRIN lens shuttle generate in-plane and out-of-plane motion at 1,527 Hz and 7,121 Hz respectively. The measured in-plane resonant peak is at 1,508 Hz, which matches the simulated value within 1.3%. For the prism shuttle, the simulated values of first and second mode are 3,205Hz and 7,096Hz respectively; the measured corresponding resonant peaks (3,124 Hz and 7320 Hz) match the simulated values with errors of +2.6% and −3.0% respectively, as shown in Figure 8B. The accuracy of the frequency modeling is attributed to the accurate geometry values that were obtained via measurement within the SEM. The frequency results also indirectly indicate that there were no hidden cracks or broken flexures in the device.
Fig. 8.
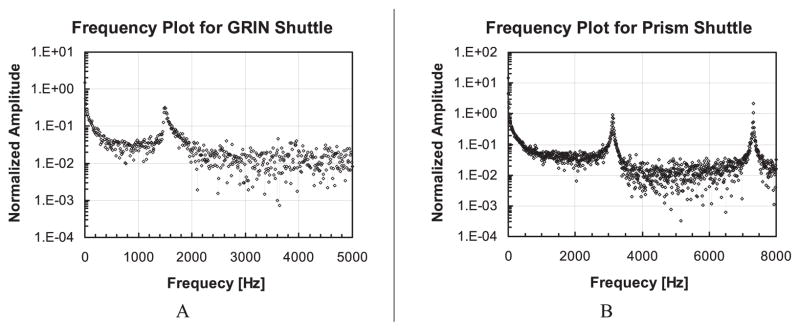
Measured frequency spectrum and for GRIN lens shuttle and prism shuttle.
Figure 9 shows the step response of the GRIN lens and prism shuttle. The measured rise time and fall time for the GRIN lens shuttle were 0.46 and 0.38 second respectively. These values show an error of −6.5%. For the prism shuttle, it was found that the rise time and fall time were 0.13 and 0.09 second respectively. The worst case error between these values and the predicted values was +7.7%. We also found the cycling speed of the GRIN lens shuttle fulfills the requirements, i.e. to scan at 2 Hz, before the pulsing technique was applied. Details of the TMA modeling approach may be found in [11], [12].
Fig. 9.
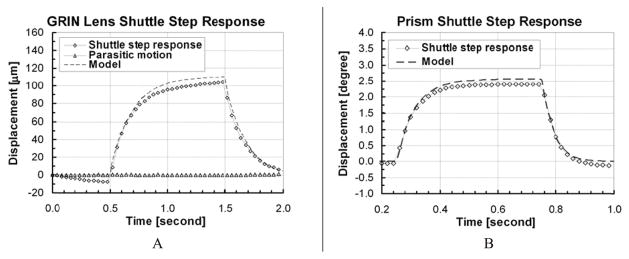
Step response of GRIN lens shuttle and prism shuttle.
Figure 10 shows the results for static displacement of the GRIN lens and prism shuttle, demonstrating they fulfill the stroke requirement. Measured positions were plotted as a function of command position in Figure 10A and Figure 10B. In both experiments, the measured displacements show a gradual divergence from commanded values at elevated temperature, where a +6.7% error was observed at full stroke for the GRIN lens shuttle. This divergence was due in part to the temperature dependence of electrical resistivity and the differences in the manner in which electrical properties of dopants (phosphorous and arsine) change with temperature. Assuming the thermal conductivity and coefficient of thermal expansion (CTE) of our arsine-doped wafer were accurate, the resistivity would have a 7% error at elevated temperatures. Note that the fabrication errors were not included in the error analysis as all critical dimensions of the devices were measured in the SEM after they were fabricated.
Fig. 10.

Displacement vs. input command plot for GRIN lens shuttle and prism shuttle.
The match between the simulated and experimental results in both dynamic and static measurements gives confidence that our parametric models may be used by other designers to predict device performance with less than 7% error.
V. Mechanical Frequency Multiplication for Fiber Resonation
This section presents the modeling, design, and experimental characterization of the TMA-based fiber resonator based on the concept of “mechanical frequency multiplication” [13], as shown in Figure 11. The MFM resonator excites the DCPCF at its resonant frequency, i.e. 1–3kHz, in order to generate a linear scanning pattern for the high-speed X-axis.
Fig. 11.
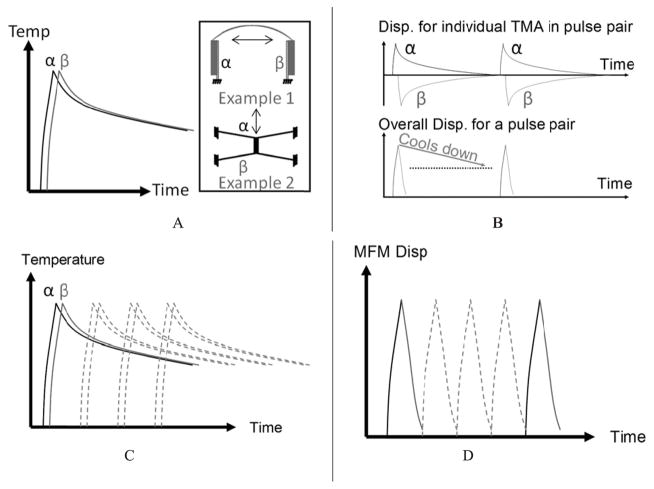
Schematics of the mechanical frequency multiplication concept and its operation principle. A: Examples of pulse generator pairs. B: Short pulses generated by pulse pairs. C: Max. temperature on individual pulse pair. D: Multiple pulse pairs are combined to form an MFM.
An MFM device consists of three components: (1) a pulse-generating TMA pair, (2) a decoupling flexure, and (3) a main stage that is connected and guided by flexures. The pulse-generating pair utilizes the fact that TMAs possess different forward and return stroke speeds. The concept of MFM is to use the high–speed portion of the one actuator to rapidly achieve half–cycle motion and then use the opposing actuator to rapidly return the last half cycle. If N actuator pairs are placed in parallel, time delayed signals may be used to drive each set with a delay, thereby increasing the cycling frequency by N.
Figure 11 presents schematics of the MFM concept and its operation principle. Figure 11A shows examples of a pulse generation TMA pair, where a high frequency mechanical pulse output may be generated by pairing two TMAs, “α” and “β”, in opposing directions and supplying them with time-delayed power input α and β respectively; Figure 11B shows short pulses generated by a TMA pair—although TMA α and β cool down slowly, the resultant motion for the TMA pair forms a pulse. Figure 11C and 11D shows the temperature and displacement effects of combining multiple pulse pairs, achieving high cycling frequency. It is worth to note that the mechanical pulse width is not limited by cooling time/process. It is only limited by the dynamic characteristics of the actuator pair that is the pair’s resonant frequency. An actuator system with high bandwidth may be constructed if many of the TMA pairs act in parallel to drive a common stage with time delays in their pulses.
A. MFM Fiber Resonator Design
The design concept of the MFM fiber resonator is shown in Figure 12. Two pulse-generation chevron TMA pairs are located at either side of the main stage, which is the most basic form of an MFM system. In this design, four TMAs also function as (1) the motion guiding flexures and (2) the coupling flexures that transmit their motions to the stage. This flexure concept provides the MFM with a high mechanical resonance frequency (17.7 kHz). The device was designed to fit within a 2 × 2 mm2 envelope. The fourTMA design was able to achieve 4 times the cycling frequency of one of its constituent TMAs.
Fig. 12.
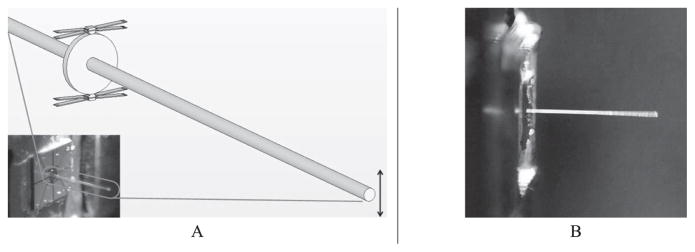
Schematics and image of a MFM fiber resonator with fiber mounted. A: Schematics and image. B: MFM device in operation.
B. TMA Selection and Design
Geometric contouring designs were applied to the TMAs in the MFM fiber resonator to enhance stroke, efficiency and power consumption. It is known that the forward and return speed ratio of a contoured TMA may be controlled by either the input command or the design parameters for a contoured beam [12]. It is therefore important to design each constituent contoured TMA of the four-TMA MFM system so that its fall time (cooling time) is equal to, or larger than, four times its rise time (heating time). The MFM system will perform more efficiently when this requirement is met. Accordingly, the contoured TMAs of the MFM system were then designed and optimized based on this objective and the static/dynamic TMA performance charts provided in [11], [12]. The finalized design parameters of TMAs are listed in Table IV, where LS, LL, w′ and we are defined and discussed in detail in [11], [12].
TABLE IV.
Design Parameters of Contoured TMAs in MFM Resonator
| Contoured TMA design parameters for MFM fiber resonator | |||
|---|---|---|---|
| LS/LL | 1/8 | we | 9.25 μm |
| L/2LL | 5/4 | L | 1000 μm |
| w′ | 1/2 | b | 200 μm |
C. Fiber Resonance Experiment
Figure 13 shows the results of the resonance on the fiber’s tip. The images were acquired via the CCD camera. Figure 13A shows a still image of the fiber’s tip before the MFM was energized, and Figure 13B shows the fiber movement patterns that were generated by actuating the MFM with properly coordinated actuation signals. The amplitude of the scanning range was estimated to be 125±2 micron, which satisfies the functional requirements. The accuracy of the amplitude was ascertained by pixel-counting the image obtained from the CCD camera, where each pixel in the image equals to 0.5 μm.
Fig. 13.
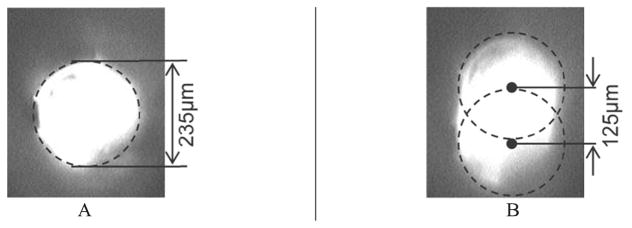
CCD images of MFM resonator in operation at 965 Hz, generating a line scan of 125 micron. A: Still image of the fiber before actuation. B: Fiber resonated by the MFM system.
VI. Microfabrication Processes
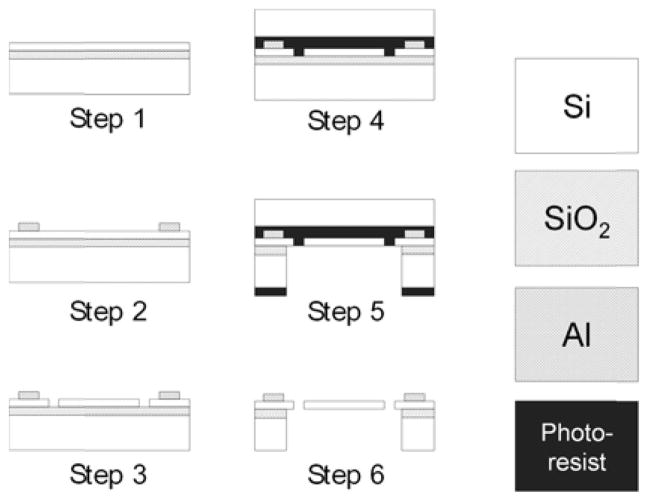
The microfabrication process, shown in Figure 14, for both the silicon optical bench and the MFM fiber resonator are described below:
Fig. 14.
Microfabrication process for silicon optical bench and MFM fiber resonator.
Step 1: The process starts with a SOI wafer (device layer: 200 micron; resistivity = 0.001 ohm-cm).
Step 2: Deposit and pattern 300 nm aluminum contacts for the device through sputtering.
Step 3: Pattern the device structure with deep reactive ion etching (DRIE).
Step 4: Target–mount the device wafer onto another silicon wafer via photoresist.
Step 5: Release the device with a backside through–etch using DRIE.
Step 6: Release the mounted device wafer and clean the photoresist/residues.
VII. Imaging Experiments and Preliminary Results
Custom-developed data acquisition software and control electronics were constructed to synchronize the different scanning axes with the photon counting circuitry monitoring the optical signal from the photomultiplier tube. 3D images were reconstructed computationally by correlating the measured optical signal strength with the known scanner positions. Characterization of individual scanner was first performed to confirm the endomicroscope’s field of view as well as the reliability of the system, as discussed in previous sections. To demonstrate 3D optically sectioned imaging capability of the TPE endomicroscope system and to characterize the resolution of the system, fluorescent beads of different sizes, including 5, 10, 15 microns, were used for preliminary imaging experiments. The results indicate that the endomicroscope has a lateral resolution of approximately 1.0 micron and axial resolution of 8.0 micron with a penetration depth of 100 micron (limited by the range of Z scan). Figure 15 shows an example of fluorescent bead cross section images obtained through the two-photon endomicroscope. The imaging results confirm the effectiveness of TMA-based micro-scanning system.
Fig. 15.

A stack of fluorescent beads images with a field of view of ~ 50 × 60 microns. Each bead is of 15 micron in diameter and each frame is 3 micron apart in Z-axis.
VIII. Conclusion
We have presented the design, modeling, fabrication and experimental characterization of a silicon optical scanner and a MFM fiber resonator—all based on TMAs. The design method of “geometric contouring” was used in optimizing TMAs in all devices. Experimental results show the fabricated optical scanner, containing the GRIN lens scanner and the prism scanner, achieved 100 micron and 2.5° scanning range and the MFM resonator achieved 125 micron scan range, satisfying all functional requirements at a power level of approximately 150mW and a 5V operation voltage; this presents a minimized safety risk for in vivo experiments. Our parametric models also match well with the experimental results both in static and dynamic measurements, providing designers a fast and accurate design approach rather than entirely resorting to time-consuming finite element analysis. (Note FEM was still used for calculating the natural frequencies and system mode shapes as well as for fine-tuning the final design parameters.) These results enable designers to systematically obtain the optimal mechanical design for their applications. In the end, we present the preliminary imaging results showing TPE optical cross-sectional images may be reliably obtained via the TMA-based scanners. The endomicroscope is characterized to have an in-plane resolution of 1.0 micron and axial resolution of 8.0 micron. The results show great potential of using the TPE endomicroscope for real-time disease diagnosis. Future efforts will be focused on applying the TPE endomicroscope for in vivo animal studies.
Acknowledgments
This work was supported in part by the National Institutes of Health under Grant 1-R21-CA118400-01: Design of a Non-Linear Endomicroscope Biopsy Probe, and the Chinese University of Hong Kong Direct Grant 2050495: Design of a Two-Axis High-Speed Scanning Mirror for Advanced Non-Linear Microscopy. The work of H. Choi and P. T. C. So was supported in part by the National Institutes of Health under Grant 9P41EB015871-26A1, Grant 5R01EY017656-02, Grant 5R01 NS051320, and Grant 4R44EB012415-02, in part by the National Science Foundation under Grant CBET-0939511, in part by the Singapore-MIT Alliance 2, in part by the MIT SkolTech initiative, in part by Hamamatsu Corporation, and in part by the Koch Institute for Integrative Cancer Research Bridge Project Initiative.
We would also like to thank Prof. Dennis Freeman (MIT EECS) for granting us free access to his Computer Microvision System.
Biographies

Shih-Chi Chen received his B.S. degree in Mechanical Engineering from the National Tsing Hua University, Taiwan, in 1999. He received his S.M. and Ph.D. degrees in Mechanical Engineering from the Massachusetts Institute of Technology, Cambridge, in 2003 and 2007, respectively. Following his graduate work, he entered a post-doctoral fellowship in the Wellman Center for Photomedicine, Harvard Medical School, where his research focused on biomedical optics and endomicroscopy. He is currently an Assistant Professor in the Department of Mechanical and Automation Engineering at The Chinese University of Hong Kong (CUHK). His research interests include precision engineering, biomedical optics, microsystem design, and nanomanufacturing. Prof. Chen is a Member of the American Society of Mechanical Engineers (ASME) and the American Society for Precision Engineering (ASPE). He is the recipient of a 2003 R&D 100 Award for the design of a microscale six-axis nanopositioner.
Heejin Choi received his B.S. degree in Mechanical Engineering from Pohang University of Science and Technology, South Korea, in 1999. He received his M.S. degree in Mechanical Engineering from Korea Advanced Institute of Science and Technology, South Korea, in 2003. He is currently a Ph.D. degree candidate in Mechanical Engineering at Massachusetts Institute of Technology, Cambridge, MA, USA. He was the recipient of the best poster presentation award at the 2008 Optical Society of America (OSA) biomedical optics topical meeting. His research is focused on the optical imaging and spectroscopy instrumentation for the medical and biological applications.

Peter T. C. So is a professor in the Department of Mechanical and Biological Engineering in the Massachusetts Institute of Technology. Prior to joining MIT, Peter So obtained his B.S. from Harvey Mudd College in 1982 and Ph.D. from Princeton University in 1992. He subsequently worked as a postdoctoral associate in the Laboratory for Fluorescence Dynamics in the University of Illinois in Urban-Champaign. His research focuses on developing high resolution and high information content microscopic imaging instruments. These instruments are applied in biomedical studies such as the noninvasive optical biopsy of cancer, the mechanotransduction processes in cardiovascular diseases, and the effects of neuronal remodeling on memory plasticity. Peter So is currently the Director of the MIT Laser Biomedical Research Center, an NIH NIBIB P41 research resource and the Program Chair of the Computational System Biology Program within the Singapore-MIT Alliance 2.
Martin L. Culpepper received his B.S. (1995) in mechanical engineering from Iowa State University, Ames, IA; and his M.S. (1997) and Ph.D. in mechanical engineering (2000) from the Massachusetts Institute of Technology, Cambridge, MA.
He worked as a consultant at Teradyne from 2000–2001 before joining the faculty of mechanical engineering at the Massachusetts Institute of Technology, Cambridge, MA. He is currently the Director of the Precision Compliant Systems Laboratory and the Associate Director of the MIT Laboratory for Manufacturing and Productivity.
Prof. Culpepper is a Fellow of the American Society of Mechanical Engineers (ASME) and a member of the American Society of Precision Engineers (ASPE). He was the recipient of a 2004 NSF PECASE Award (Nanomanufacturing), two R&D 100 awards, and a TR100 award. His research is focused on the design of meso/micro/nano-scale equipment and instruments for nanomanufacturing.
Contributor Information
Shih-Chi Chen, Email: scchen@mae.cuhk.edu.hk, Department of Mechanical and Automation Engineering, The Chinese University of Hong Kong, Hong Kong.
Heejin Choi, Email: choihj@mit.edu, Department of Mechanical Engineering, Massachusetts Institute of Technology, Cambridge, MA 02139 USA.
Peter T. C. So, Email: ptso@mit.edu, Department of Mechanical Engineering, and the Department of Biological Engineering Massachusetts Institute of Technology, Cambridge, MA 02139 USA
Martin L. Culpepper, Email: culpepper@mit.edu, Department of Mechanical Engineering, Massachusetts Institute of Technology, Cambridge, MA 02139 USA
References
- 1.Helmchen F, Fee MS, Tank DW, Denk W. A miniature head-mounted two-photon microscope: High-resolution brain imaging in freely moving animals. Neuron. 2001 Sep;31(6):903–912. doi: 10.1016/s0896-6273(01)00421-4. [DOI] [PubMed] [Google Scholar]
- 2.Bao H, Ryu SY, Lee BH, Tao W, Gu M. Nonlinear endomicroscopy using a double-clad fiber coupler. Opt Lett. 2010 Apr;35(7):995–997. doi: 10.1364/OL.35.000995. [DOI] [PubMed] [Google Scholar]
- 3.Murari K, Zhang Y, Li S, Chen Y, Li MJ, Li X. Compensation-free, all-fiber-optic, two-photon endomicroscopy at 1.55 μm. Opt Lett. 2011 Apr;36(7):1299–1301. doi: 10.1364/OL.36.001299. [DOI] [PMC free article] [PubMed] [Google Scholar]
- 4.Gu K, Lee C-C, Cui W, Wu M, Wang W-C. Design and fabrication of mechanical resonance based scanning endoscope. Proc. IEEE 16th Int. Solid-State Sensors, Actuat. Microsyst. Conf; Jun. 2011; pp. 1574–1577. [Google Scholar]
- 5.Murugkar S, Smith B, Srivastava P, Moica A, Naji M, Brideau C, et al. Miniaturized multimodal CARS microscope based on MEMS scanning and a single laser source. Opt Exp. 2010 Nov;18(23):23796–23804. doi: 10.1364/OE.18.023796. [DOI] [PubMed] [Google Scholar]
- 6.Shin HJ, Pierce MC, Lee D, Ra H, Solgaard O, Richards-Kortum R. Fiber-optic confocal microscope using a MEMS scanner and miniature objective lens. Opt Exp. 2007 Jul;15(15):9113–9122. doi: 10.1364/oe.15.009113. [DOI] [PubMed] [Google Scholar]
- 7.Flusberg BA, Cocker ED, Piyawattanametha W, Jung JC, Cheung EL, Schnitzer MJ. Fiber-optic fluorescence imaging. Nature Methods. 2005;2(12):941–950. doi: 10.1038/nmeth820. [DOI] [PMC free article] [PubMed] [Google Scholar]
- 8.Ra H, Piyawattanametha W, Taguchi Y, Lee D, Mandella MJ, Solgaard O. Two-dimensional MEMS scanner for dual-axes confocal microscopy. J Microelectromech Syst. 2007 Aug;16(4):969–976. [Google Scholar]
- 9.Pan Y, Xie H, Fedder GK. Endoscopic optical coherence tomography based on a microelectromechanical mirror. Opt Lett. 2001 Dec;26(24):1996–1998. doi: 10.1364/ol.26.001966. [DOI] [PubMed] [Google Scholar]
- 10.Sun J, Guo S, Wu L, Choe SW, Sorg BS, Xie H. 3-D in Vivo optical coherence tomography based on a low-voltage, large-scan-range 2D MEMS mirror. Opt Exp. 2010 Jun;18(12):12065–12075. doi: 10.1364/OE.18.012065. [DOI] [PubMed] [Google Scholar]
- 11.Chen SC, Culpepper ML. Design of contoured microscale thermomechanical actuators. J Microelectromech Syst. 2006 Oct;15(5):1226–1234. [Google Scholar]
- 12.Chen SC, Culpepper ML. Design of contoured thermomechanical actuators and pulsing actuation to enhance dynamic performance. J Microelectromech Syst. 2012 Apr;21(2):340–349. [Google Scholar]
- 13.Chen SC, Culpepper ML. Microfabricated mechanical frequency multiplier. 7 882 701. US Patent. 2011 Feb 8;


