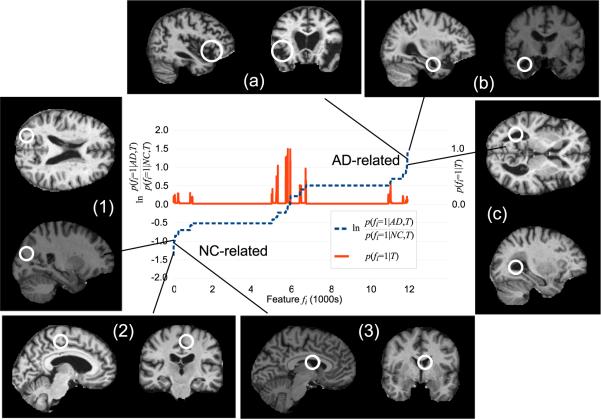
Figure 3.
The dashed curve plots the likelihood ratio of feature occurrence in AD vs. NC subjects sorted in ascending order, low values indicate features associated with NC subjects (lower left) and high values indicate features associated with AD subjects (upper right). The solid curve plots feature occurrence probability p(fi = 1|T), which is proportional to the cardinality of model feature clusters identified during learning. Note a large number of frequently-occurring features bear little information regarding AD or NC (center of graph). Examples of highly NC-related (1-3) and AD-related (a-c) features are shown, along with their associated likelihood ratios.

