

Abstract
High-resolution structural determination and dynamic characterization of membrane proteins by nuclear magnetic resonance (NMR) require their isotopic labeling. Although a number of labeled eukaryotic membrane proteins have been successfully expressed in bacteria, they lack posttranslational modifications and usually need to be refolded from inclusion bodies. This shortcoming of bacterial expression systems is particularly detrimental for the functional expression of G protein-coupled receptors (GPCRs), the largest family of drug targets, due to their inherent instability. In this work we show that proteins expressed by a eukaryotic organism can be isotopically labeled and produced with a quality and quantity suitable for NMR characterization. Using our previously described expression system in Caenorhabditis elegans, we showed the feasibility of labeling proteins produced by these worms with 15N,13C by providing them with isotopically labeled bacteria. 2H labeling also was achieved by growing C. elegans in presence of 70% heavy water. Bovine rhodopsin, simultaneously expressed in muscular and neuronal worm tissues, was employed as the ‘test’ GPCR to demonstrate the viability of this approach. Although the worms’ cell cycle was slightly affected by the presence of heavy isotopes, the final protein yield and quality was appropriate for NMR structural characterization.
Keywords: NMR (nuclear magnetic resonance), isotopic labeling, heterologous expression, GPCRs (G protein-coupled receptors), rhodopsin, Caenorhabditis elegans
Introduction
Drug design, lead generation and optimization are greatly facilitated if the structure of the biological target is known. This is particularly true when complexes between a ligand and target can be obtained. Although X-ray crystallography remains the current gold standard for structural determination, recent advances in solution-state NMR techniques to overcome molecular weight limitations offer an alternative approach for structural determination [1]. An added advantage of NMR structure determination is that it is less sensitive to disordered regions of the protein [2], allowing the analysis of protein targets that could be refractory to crystallization. Moreover, NMR offers the possibility of quantitative dynamics and binding studies for membrane proteins (MPs) complexed with ligands and drugs in a solution closely resembling their native environment. Despite the increasing importance of structure-based methods in modern pharmacological research and the fact that about 60% of drug targets are MPs [3], only a small fraction of protein structures solved to date at atomic resolution correspond to MP structures with a native sequence. The GPCR family of MPs represents the largest class of drug targets because drugs designed to interact with GPCRs are marketed in virtually every therapeutic area [4–8]. Structure-based drug design for GPCRs is advancing at a steady pace due to several crystal structures solved in the past few years. However, bovine rhodopsin remains the only vertebrate GPCR with a native sequence whose crystal structure has been determined at atomic resolution. Thus, novel technologies to elucidate the structures and provide conformational dynamics of GPCRs in native-like environments remains both highly desirable and challenging. The only GPCR structure solved to date by solid-state NMR is that of a ligand-free form of chemokine receptor CXCR1 [9], which was 15N- and 13C-labeled in E. coli, solubilized with SDS from inclusion bodies, purified in hexadecyl- and dodecyl-phosphocholine (DPC) and refolded in phospholipic proteoliposomes by detergent dialysis. Another somewhat successful example of expression of a GPCR in bacteria is the serotonin receptor 5-HT4 [10], which also had to be refolded from 6 M urea. A major disadvantage of expressing mammalian GPCRs in bacteria is the uncertainty about the percentage of protein that is correctly folded in the final reconstituted, purified sample.
Here we describe the feasibility of triple isotopic labeling (2H-, 15N and 13C) of proteins expressed in a eukaryotic system (C. elegans). We chose worms heterologously expressing bovine rhodopsin, a GPCR critical for vision signaling, as our primary target for proof of concept for two reasons: 1) rhodopsin’s signature absorbance allows a convenient quality control for protocol optimization; 2) rhodopsin’s well-characterized biochemical properties allow functional comparisons of isotopically-labeled and non-labeled samples. The advantage of this particular expression system is that mammalian GPCRs expressed in TG worms: 1) are post-translationally modified and properly folded, 2) exhibit the same pharmacological, photochemical and G protein signaling properties as do their counterparts obtained from a native source, 3) scalability, 4) phenotypic diversity, and 5) relatively facile genetic manipulation among others [11, 12]. Proteins expressed in the worms can be easily labeled simply by providing them with 15N-,13C-labeled E. coli or adding 2H2O to the worm culture media.
Here we demonstrate the feasibility of isotopically labeling mammalian GPCRs in the C. elegans expression system to characterize their structure, stability, interactions and dynamics in solution by NMR. This strategy leverages the power of the C. elegans protein expression system for producing experimental quantities of GPCRs (or other MPs) combined with isotopic labeling to produce samples suitable for structure determination with state-of-the-art NMR methods.
MATERIALS AND METHODS
Maintenance of worms and generation of transgenic (TG) worm lines
Worms used for this study were maintained by standard methods [13]) including culture on nematode growth medium plates (NGM)(0.25% peptone, 51 mM NaCl, 25 mM K3PO4, 5 μg/ml cholesterol, 1 mM CaCl2, and 1 mM MgCl2) with OP50 bacteria, cryostorage, and recovery from stocks. Compositions of media and solutions, as well as detailed protocols for their use, were previously published in Ref. [13]. Transgenic worm lines expressing bovine aporhodopsin ((b)opsin) in either muscles or neurons also have been described [11, 12]. Hermaphrodites expressing (b)opsin in muscles were crossed to males expressing (b)opsin in neurons. By screening for the fluorescent marker DsRed in F3 progeny, we obtained a homozygous worm line expressing (b)opsin in both muscles and neurons ([M,N](b)opsin).
Stable isotope labeling of HB101
Unlabeled E. coli HB101 were grown in an incubated shaker (I2500 series; New Brunswick Scientific, Edison, NY, USA) (37°C, 180 rpm) with M9 minimal medium of the following aqueous composition: 42.25 mM Na2HPO4, 279.41 mM KH2PO4, 8.56 mM NaCl,, 18.70 mM NH4Cl,, 113.51 μM CaCl2, 8.92 μM EDTA-Na2, 15.41 μM FeCl3, 1.50 μM CuSO4, 1.19 μM MnSO4, 0.1673 μM ZnSO4, 0.2080 μM CoCl2, 40.93 nM biotin, 33.24 nM thiamine, 2 mM MgSO4, and 22.20 mM glucose. The medium was adjusted to pH 7.4 with 10 M NaOH.
The same culture conditions were used to culture isotopically labeled HB101 except that ~99% 2H2O (for 2H labeling), 18.35 mM 15NH4Cl (for 15N labeling), and 10.74 mM labeled glucose (13C6H12O6) (for 13C labeling) were substituted for either H2O, NH4Cl or glucose, respectively, in M9 minimal medium. All media were sterilized by filtration.
Stable isotope labeling of nematodes
For solid phase culturing, worms were grown on peptone-free NGM plates with 51 mM NaCl, 25 mM K3PO4, 5 μg/ml cholesterol, 1 mM CaCl2, and 1 mM MgCl2 in either H2O or 700 g/L 2H2O. For liquid phase culture, worms were grown in S-medium (100 mM NaCl, 39.79 mM KH2PO4, 10.22 mM K2HPO4, 12.93 μM cholesterol, 10 mM citric acid monohydrate, 20.66 mM KOH, 3 mM CaCl2, 3 mM MgSO4, 24.89 μM FeSO4, 55.32 μM Na2EDTA, 15.58 μM ZnSO4, and 11.69 μM CuSO4) in either H2O or 800 g/L 2H2O. Isotope-labeled worms were provided with HB101 containing the same isotope, e.g., 13C-,15N-labeled HB101 for 13C-,15N- labeled worms, using previously described worm culture protocols [14].
Analysis of worm brood sizes
Worms were synchronized to L1 (first larval stage) by standard methods [14]. Six L1 animals were transferred onto peptone-free NGM plates specially made with isotopic media and then provided with HB101 labeled with the same isotope. Total F1 larvae were counted.
Analysis of growth rates
About 200 synchronized L1 worms were transferred into H2O or 2H2O S-medium and provided with unlabeled or isotopically-labeled HB101. Lifetime cycles (from L1 to L1 progeny) were quantified. The ratio of the lifetime cycle of control worms (46 ± 2 h) raised under non-labeling conditions, over the experimental worm lifetime cycle was defined as the relative growth rate.
Analysis of egg hatching rate
Synchronized young adult worms were raised in 70% 2H2O containing S-medium and provided 2H-labeled (98%) HB101. One hundred of their eggs were transferred to S-medium containing unlabeled, 13C-, or 15N-labeled HB101. Hatched F1 L1 worms were then observed for 4 days.
Immunohistochemistry (IHC)
IHC was performed as previously published [11, 12]). Briefly, age-synchronized day 1 animals were sandwiched between 2 cover glasses, buried in dry ice for 30 min, and then fixed with 100% methanol (10 min) followed by 100% acetone (10 min). Then worms were washed with PBS (137 mM NaCl, 2.7 mM KCl, 8.1 mM Na2HPO4·2H2O, and 1.76 mM KH2PO4, pH 7.4) for 0.5 h and incubated with PBS containing Alexa-488-conjugated 1D4 antibody and 0.1% Triton X-100 overnight at 4°C. Stained worms were subsequently washed 3 times with PBS and examined by confocal microscopy. All experiments were done with a Leica TCS SP2 confocal microscope (Leica Microsystems, Bannockburn, IL, USA). Either live worms immobilized with 10 mM NaN3 on 2% agarose pads or methanol/acetone-fixed worms were used. Fluorescent probes employed were DsRed (λex=543 nm; λem=580–630 nm) and Alexa-488 (λex=488 nm; λem=510–530 nm).
Immunoblotting
Immunoblotting was carried out by a published protocol [11]. Briefly, worms were sonicated and centrifuged to remove debris. The resulting supernatant was mixed in electrophoresis loading buffer, vortexed, centrifuged briefly, and samples were analyzed by immunoblotting after SDS-PAGE on 4–12% Bis-Tris polyacrylamide gels (Invitrogen, Carlsbad, CA, USA). Quantification of signals in immunoblotted gels was done by obtaining their digital pictures with ImageJ software [15]. Area values of bands were measured and compared with areas of purified (b)opsin or control samples loaded on the same gel.
In vivo light-response assays
In vivo light-response assays were performed as previously described [12] with some modifications. Briefly, one day before such experiments, unlabeled L4 animals raised at 20°C were transferred onto NGM plates seeded with 100 μl HB101 bacteria culture containing either DMSO vehicle control (no retinal), 10 μM 9-cis-retinal or 10 μM all-trans-retinal (Toronto Research Chemicals, Toronto, ON, Canada). Triple isotopically labeled (2H, ~70%; 13C,15N,~100%) animals were transferred onto peptone-free NGM plates containing 80% 2H2O seeded with 100 μl of triple isotopically labeled (2H, ~70%; 13C,15N,~100%) HB101 culture medium containing either DMSO vehicle control (no retinal), 10 μM 9-cis-retinal or 10 μM all-trans-retinal. The resulting plates were wrapped with aluminum foil and stored in a cardboard box overnight at 20°C. Light response experiments were carried out at 22°C in a dark room with a Zeiss Stemi SV11-Apo microscope (Carl Zeiss, Oberkochen, Germany) and 7 lux of transmitted white light was used to visualize (b)opsin-expressing animals. For each light-response assay, a day-1 worm was transferred onto an unseeded NGM plate. About 5 seconds later,1000 lux of blue light (488±20 nm) was delivered over 1 s to animals from a metal halide short arc bulb housed in an EXFO X-Cite 120PC-Q unit (Lumen Dynamics, Mississauga, ON, Canada) through a Kramer USFAC and animals then were continuously imaged for another 1 min.
Worm locomotion before and after illumination was recorded by AVI movies. Light intensity output of the EXFO unit was calibrated to reach a targeted intensity (±5%) at the microscopic field, measured with a Macam L203 Photometer (MacamPhotometrics, Livingston, UK). The light-response index was defined as described in [12]: 5 = complete lack of motion >10 s; 4 = complete lack of motion > 10 s except for head shaking; 3 = lack of motion 2–10 s; 2 = lack of motion ≤ 2 s; 1= changed locomotion speed or direction; and 0 = no change noted in motor activity.
Labeling bacteria and nematodes with 13C6,15N2-lysine and proteomic sample preparation for LC-MS/MS analyses
These procedures have been described in detail [14]. Briefly, arginine and lysine auxotrophic Escherichia coli AT713 bacteria were cultured in M9 basal medium supplemented with arginine (100 μg/ml), cysteine (100 μg/ml) and lysine (100 μg/ml either 12C6,14N2-lysine) or 13C6,15N2-lysine) (Cambridge Isotope Laboratories, Andover, MA)) (M9 with amino acid supplementation) in an incubator shaker (3°C, 200 rpm until OD600 reached 1.5), pelleted by centrifugation, and killed with 100% ethanol.
Age-synchronized animals were cultured to day 3 on peptone-free NGM plates seeded with regular or heavy lysine-labeled AT713 bacteria along with 25 mg/l 5′-FUDR (5-fluoro-2′deoxyuridine, Geel, Belgium) starting from day 0. Then bacteria were separated from nematodes by an H2O wash and nematodes were pelleted by centrifugation. Equal weights of heavy lysine-labeled and unlabeled WT worms were suspended in 100 mM ammonium bicarbonate containing 4% perfluorooctanoic acid (w/v), and proteins were extracted by ultrasonication (4.5 kHz three times for 9 s with a 3-min pause on ice between pulses) using a Virsonic 100 ultrasonic cell disrupter (SP Scientific, Warminster, PA). Extracted proteins were reduced with dithiothreitol and S-alkylated with iodoacetamide, and then digested by Lys-C as described previously [14].
LC-MS/MS analyses
LC-MS/MS analyses were conducted using an UltiMate 3000 LC systems (Dionex Inc.) interfaced to Velos Pro Ion Trap and Orbitrap Elite Hybrid Mass Spectrometer (Thermo Scientific, Bremen, Germany). The platform was operated in the nano-LC mode, with the standard nano-ESI (Proxeon Biosystems) source. The spray voltage was set at 1.2 kV and the temperature of the heated capillary was set to 200°C. The solvent flow rate through the column was maintained at 300 nL/min. Lys-C digests were injected onto a reversed-phase 0.3 × 5 mm C18 PepMap trapping column with a 5-μm particle size (Dionex Inc.) equilibrated with 0.1% formic acid/1% acetonitrile (v/v). The column was washed for 5 min with the equilibration solution at a flow rate of 25 μL/min using an isocratic loading pump operated through an autosampler. The trapping column was then switched in-line with a reversed-phase 0.075 × 150-mm C18 Acclaim PepMap 100 column (Dionex Inc.), and peptides were eluted using a linear gradient of 2 to 37% acetonitrile in aqueous 0.1% formic acid over 180 at a flow rate of 300 nL/min. The eluent was directly introduced into the mass spectrometer. The mass spectrometer was operated in a data-dependent MS to MS/MS switching mode, with the 10 most intense ions in each MS scan subjected to MS/MS analysis. Full MS scanning was performed at a resolution of 120,000 (“full width at half maximum”) in the Orbitrap detector, and MS/MS was performed in the ion trap detector in a collision-induced dissociation mode. The threshold intensity for the MS/MS trigger was set at 3000. Fragmentation was carried out in the collision-induced dissociation mode with a normalized collision energy of 35. The data were completely collected in the profile mode for the full MS scan and in the centroid mode for the MS/MS scans. The dynamic exclusion function for previously selected precursor ions applied the following parameters: repeat count of 1, repeat duration of 40 s, exclusion duration of 90 s, and exclusion size list of 500 (ions). Xcalibur software (Version 2.2 SP1 build 48, Thermo-Finnigan Inc., San Jose, CA) was used for instrument control, data acquisition, and data processing.
Identification and quantification of heavy-lysine labeled and unlabeled peptides and proteins
Proteins were identified by comparing all experimental peptide MS/MS spectra against the Wormbase database using Mascot database search software (version 2.1.04, Matrix Science, London, UK). Carbamidomethylation of cysteine was set as a fixed modification, whereas oxidation of methionine to methionine sulfoxide, acetylation of the N-terminal amino group, and the replacement of C-terminal lysine with heavy-Lys were considered to be variable modifications. The mass tolerance was set to 10 ppm for the precursor ion and to 0.8 Da for the product ion. Strict Lys-C specificity was applied, and missed cleavages were not allowed. Criteria for significant peptide identifications included the following: peptides must be composed of at least six amino acid residues and have a minimum mascot score of 20. The false discovery rate was calculated from the following equation: N(decoy)•2/N(decoy) + N(target), and the threshold rate was set to ≤0.01 for peptide identification. Protein isoforms and proteins that could not be distinguished based on the peptides identified were reported as a single protein group. ProteomicsTools version 2.4.1 was used to obtain the intensities of heavy-lysine labeled and unlabeled proteins [16].
Statistical analyses
Statistical significance was analyzed with Statistica software (StatSoft, Tulsa, OK, USA). T-tests, ANOVA with Dunnet’s post-hoc analyses were used for their appropriate applications. Error bars indicate means ±SE. P values <0.05 were accepted as defining statistically significant differences.
Results
Simultaneous expression of (b)opsin in worm muscles and neurons
We demonstrated previously that (b)opsin can be expressed in worm muscular [M] or neuronal [N] tissue in a homogeneously glycosylated and functional form [11]. Indeed over 1 milligram of functional bovine isorhodopsin ((b)opsin reconstituted with 9-cis-retinal) and other vertebrate GPCRs could be obtained in a pure form from a 10-L worm culture. To maximize the expression of (b)opsin we hypothesized that expressing it in both, muscles and neurons would show an additive effect in the total amount of protein without negatively affecting the TG worm life cycle. Quantification of the expression level showed that the expression level of (b)opsin in [M,N](b)opsin worms was in fact about twice the amount expressed in [M](b)opsin and [N](b)opsin worms, reaching a final yield of ~3 mg per 10-L of cell culture (Fig. 1A,B). Because the glycosylation pattern is similar in both tissues, most of the (b)opsin migrated as a single band upon electrophoresis. After reconstituting the (b)opsin with 9-cis-retinal, purification of ground-state (b)isorhodopsin to >99% homogeneity and functionality was relatively simple in two chromatographic steps (Fig. 1C). The absorption spectra before (Fig. 1C) and after illumination were identical to spectra of bovine rhodopsin [17]. Consequently, this [M,N](b)opsin TG worm line was adopted for our remaining experiments involving (b)opsin expressed in worms.
Figure 1.
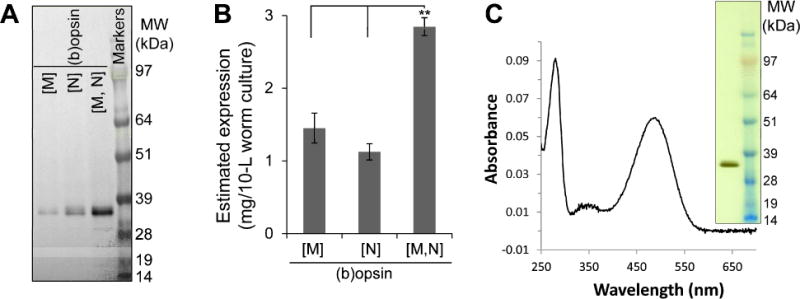
TG nematode lines expressing (b)opsin in both muscles and neurons [M,N] achieve greater receptor expression than TG nematode lines expressing (b)opsin in either muscles [M] or neurons [N]. A) A representative immunoblotted gel. Worms were sonicated and centrifuged to remove debris. Then supernatants of 0.33 μl [M] or 0.67 μl [N], [M,N] (b)opsin worms were loaded on the gels as shown. B) Quantification of immunoblotting results from three independent experiments. Error bars indicate means ±SE. **P<0.01; Student’s t test; n=3. C): UV spectrum of (b)isorhodopsin purified from [M,N](b)opsin worms by chromatography and gel filtration. The purity and functionality of the protein is evident from the ratio A280nm/A485nm= 1.52 and its electrophoretic profile (inset). The SDS-PAGE gel was silver stained. Right lane shows the molecular weight standards.
An optimized protocol for culturing isotopically labeled transgenic worms
Isotopic labeling of proteins expressed in TG worms was achieved by providing the worms with E. coli grown in isotopic media. We tested whether different isotopes had noxious effects on worm growth which could lower the final protein yield. For example, isotopic labeling might: 1) delay the reproduction of TG worms, 2) suppress the growth of TG worms, or 3) lower heterologous GPCR expression in TG worms.
We cultured (b)opsin expressing TG worms in 1H or 2H-containing liquid medium and provided them with non-labeled, 2H-labeled, 13C-,15N-labeled or 2H-,13C-,15N-labeled bacteria (E. coli HB101, food of nematodes) following a previously published protocol [11]. Similar to E. coli, both the growth rate and breeding of (b)opsin expressing TG worms were significantly affected by 2H-labeling, such that worms grew only half as fast and had half the progeny per hermaphrodite in 70% 2H2O-containing liquid medium (Fig. 2). Also similar to E. coli, 13C,15N-labeling had little effect (<10%) on both the breeding and growth of TG worms. Importantly, eggs produced by 13C-,15N-labeled TG worms hatched and matured into Day 4 larva (L4) at the same rate as eggs produced by unlabeled TG worms in 70% 2H-containing liquid medium (Fig. 2C). Because 2H2O is needed only during the protein production/fermentation steps, this worm culturing problem can be addressed by culturing 13C,15N-labeled TG nematodes in the initial steps to collect eggs. Once in the fermenter, we used 70% 2H-containing liquid medium and maintained transgenic worms with either 13C,15N-labeled or 2H,13C,15N-labeled bacteria. With the latter protocol, the negative effect of 2H labeling on TG worm breeding and growth had only a minor effect on fermenter preparation. This modification extended the culture time in a fermenter, the rate-limiting step of TG worm production, from ~3.5 days for unlabeled TG worms [11, 12] to ~7 days.
Figure 2.
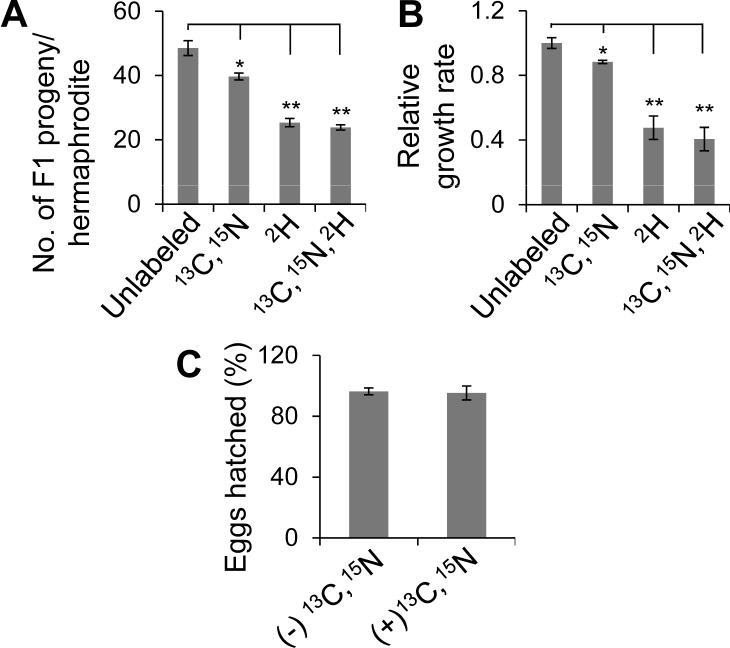
Effects of isotopic labeling on brood size (A), growth rate (B), and hatching (C) of the TG nematode line expressing (b)opsin in both neurons and muscles. A) To estimate brood size, the F1 progeny produced by singly (2H,~70%), doubly (13C,15N,~100%) or triply (2H,~80%; 13C,15N,~100%) isotopically labeled transgenic worms were counted. Data are from three independent experiments, n>20. Error bars indicate means ±SE. *P<0.05, **P<0.01. One-way ANOVA with Dunnett’s correction. B) To estimate growth rate of these worms, we quantified the time for a life cycle (from L1 to L1 of F1 progeny) of transgenic worms. The relative growth rate is the ratio of the life cycle of unlabeled worms over that of each variant. Data are from three independent experiments, n>20. Error bars indicate means ±SE. *P<0.05, **P<0.01. One-way ANOVA with Dunnett’s correction. C) Worms raised in 70% 2H containing S-medium laid eggs at similar hatching rates in 13C,15N (~100%) containing S-medium and control medium((−)13C,15N). Data are from three independent experiments. Error bars indicate means ±SE, n>60. Students t test.
We next used this modified protocol to culture unlabeled and triple-labeled TG worms and compare their (b)opsin expression levels. We found that isotopic labeling reduced (b)opsin expression by ~30% (not shown). Thus, we were able to produce 2 mg of a triple- and double-labeled GPCR from a 10-L worm culture in 10 days. We conclude that an optimized culturing protocol with a 70% 2H-containing liquid medium is suitable for producing 13C, 15N and 2H-labeled transgenic worms.
Triple-labeled (b)isorhodopsin is functional and correctly expressed
The promoters myo-3 (Pmyo-3; [18]) and H20 (PH20; [19]), that drive strong gene expression in muscles and the nervous system, respectively, were chosen to control the co-expression of (b)opsin in these two worm tissues. Muscles comprise the greatest portion of the worm body mass, and the nervous system has the largest numbers of a specific cell type; e.g., 302 of the 959 total somatic cells in an adult worm are neurons. In examining whether isotopic labeling affects the folding of heterologous receptors and their association with membranes, we found that isotopic labeled transgenic worms cultured under optimized conditions (13C, 15N,~100%; 2H, ~70%) exhibited the same cellular distribution of (b)opsin in the nervous system and muscles as did unlabeled transgenic worms (Fig. 3A). Also (b)opsin expression was modestly (~30%) reduced in isotopically labeled transgenic worms compared with unlabeled transgenic worms (Fig. 3B). The presence of (b)opsin was detected by IHC with Alexa-488-conjugated 1D4 antibody, with a C-terminus epitope identical to that of rhodopsin.
Figure 3.

Effects of isotopic labeling on the expression of (b)opsin in [M,N](b)opsin TG worms and the functionality of (b)isorhodopsin in [N](b)opsin and [M,N](b)opsin TG worms. U, unlabeled; L, triply isotopically labeled (13C, 15N,~100%; 2H, ~70%) worms. A) Representative Alexa-488-conjugated 1D4 mAb fluorescent images of adult [M,N](b)opsin worms without (U, left panel) and with isotope labeling (L, right panel). 1D4 mAb stained many neurons in the head ganglion, tail ganglion (white arrows), and was also detected in body wall muscles (orange arrows), as well as in muscles of the neck and head. B) Representative immunoblotted gel (left panel) of opsin expression in unlabeled and isotopically labeled [M,N](b)opsin worms together with quantification of the immunoblotting results (right panel). Worms collected from three independent experiments (Exp1-3) were sonicated and centrifuged to remove debris. Worm supernatants of 0.33 μl together with 0.75 ng of (b)rhodopsin purified from bovine retina were used. Error bars indicate means ±SE. *P<0.05; Students t test. C) Light-responsive motor behavior of triple-labeled worms. Unlabeled and labeled L4 [N](b)opsin and [M,N](b)opsin TG worms were preincubated with either vehicle, 10 μM all-trans-retinal or 10 μM 9-cis-retinal overnight and then transferred onto unseeded NGM tracking plates. Vigorously crawling TG animals were then exposed to blue light (1000 lux, 488 ±20 nm) for 1 s. Light-responsive motor behaviors of these animals were recorded and scored according to the response index (see Materials and Methods). Data were derived from 3 independent experiments with 5–10 animals each. Error bars indicate means ±SE. *P<0.05; Student’s t test.
Worms do not have vision and thus do not respond to visible light [11, 12]. However, when (b)opsin expressed in TG worms is reconstituted with 11-cis-retinal, the resulting ground-state rhodopsin, (b)Rho, becomes light sensitive, mimicking rhodopsin in the retina (not shown). Bovine opsin reconstituted with 9-cis-retinal, known as isorhodopsin, has similar biophysical properties to rhodopsin except that its maximum absorbance is blue-shifted to ~485 nm. Illumination of (b)isorhodopsin results in the isomerization of 9-cis-retinal into all-trans-retinal, and the consequent activation of rhodopsin [11, 12]. We previously demonstrated that photoactivation of (b)isorhodopsin in neurons of TG worms results in an instantaneous but transient muscular paralysis [12]. Just as unlabeled TG worms expressing (b)isorhodopsin, triple-labeled TG worms exhibited locomotive paralysis in response to a 488 nm light pulse (Fig. 3C) although there was a slight reduction in light sensitivity. This reduction is likely attributable to a reduced expression of the receptor (Fig. 3B) or the isotopic effect on G protein activation. Moreover, absence of 9-cis- or 11-cis-retinal prevented this response to light. The latter observation demonstrates that triple-labeled (b)isorhodopsin is functional in vivo. Indeed, both unlabeled and labeled recombinant (b)opsin displayed immunoreactive bands of (b)opsin monomer (Fig. 3B).
The isotopic labeling yield is suitable for NMR structural studies
To estimate the isotopic labeling yield of (b)opsin in TG worms, we used our “stable isotope labeling by amino acids in worms” strategy (an adaptation of “stable-isotope labeling with amino acids in cell culture” (SILAC)) [20] to quantify the incorporation of 15N2,13C6-lysine, an essential amino acid for worms and the E. coli species used [21], into TG worms. In SILAC, stable isotope-labeled amino acids are incorporated into cellular proteins through endogenous protein synthesis, allowing accurate quantification of all native proteins without subsequent chemical modification. Our technique involves mixing equal amounts of labeled and unlabeled sample prior to mass spectral analysis. The worms were obtained by the optimized culturing protocol described above. With this relatively inexpensive and accurate quantitative proteomic approach [22, 23], we identified a total of 1947 worm proteins (one tenth of the worm genome) and found that the average labeling yield of 15N2,13C6-lysine was over 97.5%. Fig. 4 shows plots of the intensities of unlabeled peptides against their labeled counterparts for ~2000 proteins. The slope of the linear regression fitting line (1.0064) indicates virtually complete labeling yield. Thus, it is reasonable to conclude that heterologous GPCRs also will be labeled with 15N2,13C6-Lys at about the same yield.
Figure 4.

Isotope labeling efficiency of C. elegans proteins. Equal weights of the 13C6,15N2-lysine-labeled and unlabeled WT worms were pooled, and proteins were extracted by ultrasonication. The extracted proteins were then digested by Lys-C and analyzed by LC-MS/MS. The intensities of individual heavy-lysine labeled and unlabeled peptides are plotted against each other and linear regression analysis was performed. The observed intensities of labeled and unlabeled peptides were normalized with respect to TBB-1 (worm homolog of β-tubulin).
DISCUSSION
Structural characterization of membrane proteins usually involves the heterologous expression of milligram amounts and their purification. In addition, NMR studies require the isotopic labeling of the target protein. Bacterial expression systems have been used routinely to label membrane proteins for NMR. However, the functional expression of mammalian GPCRs in bacteria is extremely challenging due to their instability and the number of posttranslational modifications required for maintaining their native functional conformation. Although several groups have reported successful refolding of GPCRs from exclusion bodies, it remains uncertain as to what percentage of the final purified sample was properly folded after the harsh treatment involved in refolding. A similar approach for labeling rhodopsin in a eukaryotic expression system was previously described for HEK293S cells [24]. Expression of GPCRs in mammalian cells has advantages over other expression systems but it also has disadvantages, such as the heterogeneity of post-translational modifications of the heterologously expressed receptor.
The aim of this work was to demonstrate the feasibility of isotopically labeling GPCRs heterologously expressed in a eukaryotic organism (C. elegans). We first started by increasing the heterologous protein yield through co-expressing bovine aporhodopsin ((b)opsin) in both neurons and muscles). (b)Opsin can easily be reconstituted into ground-state rhodopsin (b)rhodopsin by incubating worms or worm membrane extracts with 11-cis retinal. Alternatively, (b)isorhodopsin can be obtained by incubation with 9-cis-retinal, a chemically more stable isomer. The purification yield is at least 3 mg of (b)isorhodopsin for a 10-L fermentation, and we show that the resulting protein can be easily obtained at a purity and functionality of >99%.
Next, we explored the effect of isotopic labeling on worm growth, which will ultimately affect the final protein yield. Not surprisingly, the worms’ cell cycle was affected by the presence of heavy elements, especially 2H, much like what was previously observed in E. coli [25]. Fortunately, by modifying our culture protocol, we obtained a uniform 13C-,15N-labeling, and 70% 2H labeling of C. elegans proteins. This was achieved by providing the worms with 13C-,15N-labeled bacteria and adding 70% 2H2O to the worm culture media.
Additionally, we demonstrated that triply isotopically labeled (13C, 15N,~100%; 2H, ~70%) GPCRs expressed in worms are functional as judged by a phenotypic assay described previously [12]. Instantaneous but transient paralysis of worms upon illumination indicates that the exogenous (b)isorhodopsin can be activated to its meta II state which also couples to the worms’ endogenous G proteins.
The uniformity of 13C-,15N-labeling was assessed by an adaptation of the SILAC strategy for quantification of isotopic labeling by mass-spectrometry. By feeding worms with 13C-,15N-labeled lysine, we demonstrated that the average labeling of ~2,000 expressed proteins was ~97.5%, which is appropriate for NMR studies.
In summary, we developed a set of techniques to obtain single labeled (15N), double labeled (2H,15N)- and triple labeled (2H,13C,15N) vertebrate GPCRs (and potentially other membrane proteins) of a sufficient quality and quantity for NMR structural studies in solution. This strategy combines the advantages of protein expression in eukaryotes (i.e., proper folding and posttranslational modifications), expression in liquid cell culture (scalability, high yield and a rapid cell cycle), and the possibility of uniform isotopic labeling for NMR studies. Thus, this system combines the advantages of in vivo animal expression and unicellular cell expression in suspension. It is particularly reassuring that C. elegans worms express about 1,100 endogenous GPCRs (5% of its genome), many of them with human homologs. In addition, worms feed on E. coli and, therefore, proteins in the worms can be labeled by maintaining them with isotopically labeled bacteria.
Acknowledgments
We thank Dr. L. T. Webster Jr. (Case Western Reserve University) and members of the Palczewski laboratory for helpful comments on this manuscript. This work was supported by transdisciplinary Research on Energetics and Cancer directed by Dr. Nathan A. Berger, Nutrition Obesity Research Center, Case Western Reserve University (ZF), and funding from the National Eye Institute of the National Institutes of Health (National Eye Institute grant R01EY009339 (KP)). KP is John H. Hord Professor of Pharmacology.
Abbreviations
- DPC
dodecyl-phosphocholine
- GPCR
G protein-coupled receptors
- IHC
immunohistochemistry
- LC-MS
Liquid chromatography–mass spectrometry
- MP
membrane protein
- NGM
nematode growth medium
- NMR
nuclear magnetic resonance
- TG
transgenic
- SILAC
stable-isotope labeling with amino acids in cell culture
Footnotes
Publisher's Disclaimer: This is a PDF file of an unedited manuscript that has been accepted for publication. As a service to our customers we are providing this early version of the manuscript. The manuscript will undergo copyediting, typesetting, and review of the resulting proof before it is published in its final citable form. Please note that during the production process errors may be discovered which could affect the content, and all legal disclaimers that apply to the journal pertain.
Financial support: This work was supported by transdisciplinary Research on Energetics and Cancer directed by Dr. Nathan A. Berger, Nutrition Obesity Research Center, Case Western Reserve University (ZF), and funding from the National Eye Institute of the National Institutes of Health (National Eye Institute grant R01EY009339 (KP)). KP is John H. Hord Professor of Pharmacology.
References
- 1.Sprangers R, Kay LE. Quantitative dynamics and binding studies of the 20S proteasome by NMR. Nature. 2007;445:618–622. doi: 10.1038/nature05512. [DOI] [PubMed] [Google Scholar]
- 2.Dyson HJ, Wright PE. Unfolded proteins and protein folding studied by NMR. Chemical reviews. 2004;104:3607–3622. doi: 10.1021/cr030403s. [DOI] [PubMed] [Google Scholar]
- 3.Yildirim MA, Goh KI, Cusick ME, Barabasi AL, Vidal M. Drug-target network. Nature biotechnology. 2007;25:1119–1126. doi: 10.1038/nbt1338. [DOI] [PubMed] [Google Scholar]
- 4.Brough SJ, Shah P. Use of aequorin for G protein-coupled receptor hit identification and compound profiling. Methods Mol Biol. 2009;552:181–198. doi: 10.1007/978-1-60327-317-6_13. [DOI] [PubMed] [Google Scholar]
- 5.Overington JP, Al-Lazikani B, Hopkins AL. How many drug targets are there? Nat Rev Drug Discov. 2006;5:993–996. doi: 10.1038/nrd2199. [DOI] [PubMed] [Google Scholar]
- 6.Klabunde T, Hessler G. Drug design strategies for targeting G-protein-coupled receptors. Chembiochem. 2002;3:928–944. doi: 10.1002/1439-7633(20021004)3:10<928::AID-CBIC928>3.0.CO;2-5. [DOI] [PubMed] [Google Scholar]
- 7.Lundstrom K, Wagner R, Reinhart C, Desmyter A, Cherouati N, Magnin T, Zeder-Lutz G, Courtot M, Prual C, Andre N, Hassaine G, Michel H, Cambillau C, Pattus F. Structural genomics on membrane proteins: comparison of more than 100 GPCRs in 3 expression systems. J Struct Funct Genomics. 2006;7:77–91. doi: 10.1007/s10969-006-9011-2. [DOI] [PubMed] [Google Scholar]
- 8.Lundstrom K. Latest development in drug discovery on G protein-coupled receptors. Curr Protein Pept Sci. 2006;7:465–470. doi: 10.2174/138920306778559403. [DOI] [PubMed] [Google Scholar]
- 9.Park SH, Das BB, Casagrande F, Tian Y, Nothnagel HJ, Chu M, Kiefer H, Maier K, De Angelis AA, Marassi FM, Opella SJ. Structure of the chemokine receptor CXCR1 in phospholipid bilayers. Nature. 2012;491:779–783. doi: 10.1038/nature11580. [DOI] [PMC free article] [PubMed] [Google Scholar]
- 10.Baneres JL, Mesnier D, Martin A, Joubert L, Dumuis A, Bockaert J. Molecular characterization of a purified 5-HT4 receptor: a structural basis for drug efficacy. J Biol Chem. 2005;280:20253–20260. doi: 10.1074/jbc.M412009200. [DOI] [PubMed] [Google Scholar]
- 11.Salom D, Cao P, Sun W, Kramp K, Jastrzebska B, Jin H, Feng Z, Palczewski K. Heterologous expression of functional G-protein-coupled receptors in Caenorhabditis elegans. FASEB J. 2012;26:492–502. doi: 10.1096/fj.11-197780. [DOI] [PMC free article] [PubMed] [Google Scholar]
- 12.Cao P, Sun W, Kramp K, Zheng M, Salom D, Jastrzebska B, Jin H, Palczewski K, Feng Z. Light-sensitive coupling of rhodopsin and melanopsin to G(i/o) and G(q) signal transduction in Caenorhabditis elegans. FASEB J. 2012;26:480–491. doi: 10.1096/fj.11-197798. [DOI] [PMC free article] [PubMed] [Google Scholar]
- 13.Stiernagle T. Maintenance of C. elegans. WormBook. 2006:1–11. doi: 10.1895/wormbook.1.101.1. [DOI] [PMC free article] [PubMed] [Google Scholar]
- 14.Yuan Y, Kadiyala CS, Ching TT, Hakimi P, Saha S, Xu H, Yuan C, Mullangi V, Wang L, Fivenson E, Hanson RW, Ewing R, Hsu AL, Miyagi M, Feng Z. Enhanced energy metabolism contributes to the extended life span of calorie-restricted Caenorhabditis elegans. J Biol Chem. 2012;287:31414–31426. doi: 10.1074/jbc.M112.377275. [DOI] [PMC free article] [PubMed] [Google Scholar]
- 15.Abramoff MD, Magelhaes PJ, Ram SJ. Image Processing with ImageJ. Biophotonics International. 2004;11:36–42. [Google Scholar]
- 16.Guo Y, Miyagi M, Zeng R, Sheng Q. O18Quant: a semiautomatic strategy for quantitative analysis of high-resolution 16O/18O labeled data. Biomed Res Int. 2014;2014:971857. doi: 10.1155/2014/971857. [DOI] [PMC free article] [PubMed] [Google Scholar]
- 17.Palczewski K. G protein-coupled receptor rhodopsin. Annu Rev Biochem. 2006;75:743–767. doi: 10.1146/annurev.biochem.75.103004.142743. [DOI] [PMC free article] [PubMed] [Google Scholar]
- 18.Okkema PG, Harrison SW, Plunger V, Aryana A, Fire A. Sequence requirements for myosin gene expression and regulation in Caenorhabditis elegans. Genetics. 1993;135:385–404. doi: 10.1093/genetics/135.2.385. [DOI] [PMC free article] [PubMed] [Google Scholar]
- 19.Yabe T, Suzuki N, Furukawa T, Ishihara T, Katsura I. Multidrug resistance-associated protein MRP-1 regulates dauer diapause by its export activity in Caenorhabditis elegans. Development. 2005;132:3197–3207. doi: 10.1242/dev.01909. [DOI] [PubMed] [Google Scholar]
- 20.Yuan Y, Kadiyala CS, Ching TT, Hakimi P, Saha S, Xu H, Yuan C, Mullangi V, Wang L, Fivenson E, Hanson RW, Ewing R, Hsu AL, Miyagi M, Feng Z. Enhanced energy metabolism contributes to the extended lifespan of caloric restricted Caenorhabditis elegans. J Biol Chem. 2012 doi: 10.1074/jbc.M112.377275. [DOI] [PMC free article] [PubMed] [Google Scholar]
- 21.Taylor AL, Trotter CD. Revised linkage map of Escherichia coli. Bacteriol Rev. 1967;31:332–353. doi: 10.1128/br.31.4.332-353.1967. [DOI] [PMC free article] [PubMed] [Google Scholar]
- 22.Lanucara F, Eyers CE. Mass spectrometric-based quantitative proteomics using SILAC. Methods Enzymol. 2011;500:133–150. doi: 10.1016/B978-0-12-385118-5.00008-6. [DOI] [PubMed] [Google Scholar]
- 23.Ong SE, Blagoev B, Kratchmarova I, Kristensen DB, Steen H, Pandey A, Mann M. Stable isotope labeling by amino acids in cell culture, SILAC, as a simple and accurate approach to expression proteomics. Mol Cell Proteomics. 2002;1:376–386. doi: 10.1074/mcp.m200025-mcp200. [DOI] [PubMed] [Google Scholar]
- 24.Werner K, Richter C, Klein-Seetharaman J, Schwalbe H. Isotope labeling of mammalian GPCRs in HEK293 cells and characterization of the C-terminus of bovine rhodopsin by high resolution liquid NMR spectroscopy. J Biomol NMR. 2008;40:49–53. doi: 10.1007/s10858-007-9205-3. [DOI] [PubMed] [Google Scholar]
- 25.Venters RA, Huang CC, Farmer BT, 2nd, Trolard R, Spicer LD, Fierke CA. High-level 2H/13C/15N labeling of proteins for NMR studies. J Biomol NMR. 1995;5:339–344. doi: 10.1007/BF00182275. [DOI] [PubMed] [Google Scholar]