

Abstract
11C-LY2795050 is a new antagonist PET radioligand for the kappa opioid receptor (KOR). In this study, we assessed the reproducibility of the binding parameters of 11C-LY2795050 in healthy human subjects.
Methods
Sixteen healthy subjects (11 men, 5 women) underwent two separate 90-min PET scans with arterial input function and plasma free fraction measurements. The two-tissue compartment model and multilinear analysis-1 were applied to calculate five outcome measures in 14 brain regions: distribution volume (VT), distribution volume normalized by plasma free fraction (VT/fP), and three binding potentials (BPND, BPP, BPF). Since KOR is distributed ubiquitously throughout the brain, there are no suitable reference regions. We used a fixed fraction of individual cerebellum VT value as the non-displaceable distribution volume VND (= VT CER/1.17). The relative and absolute test-retest variability and intra-class correlation coefficient were evaluated for the outcome measures of 11C-LY2795050.
Results
The test-retest variability of 11C-LY2795050 for VT was ≤ 10% in all regions, and 12% in the amygdala. For binding potentials (BPND and BPP), the test-retest variability was good in regions of moderate and high KOR density (BPND > 0.4) and poor in regions of low density. Correction by fP (VT/fP or BPF) did not improve the test-retest performance.
Conclusion
Our results suggest that quantification of 11C-LY2795050 imaging is reproducible and reliable in the regions with moderate and high KOR density. Therefore we conclude that this first antagonist radiotracer is highly useful for PET studies of KOR.
Keywords: Kappa opioid receptor, Positron emission tomography, Test-retest reproducibility, Brain imaging
INTRODUCTION
The kappa opioid receptor (KOR) is one of at least three subtypes of the opioid receptors. The KOR is known to be involved in various disorders, including anxiety (1), substance abuse (2), major depression (3, 4), epilepsy (5), and Alzheimer’s disease (6). Several lines of work provide support for KOR antagonists as potential therapeutic agents for depression (7) and alcohol dependence (8).
The PET radioligand 11C-LY2795050 is a recently developed antagonist radiotracer (9) that binds selectively to the KOR. This new tracer has been examined in both nonhuman primates (10, 11) and human subjects (12). Our previous analysis of human imaging data found that 150 mg oral dose of naltrexone blocked ~90% KOR across all brain regions, which suggests the absence of a suitable reference region for 11C-LY2795050 in the human brain, and that the lowest inter-subject variability in three versions of binding potential (BPND, BPP, BPF) was observed when the non-displaceable distribution volume (VND) was estimated as a fixed fraction of cerebellum VT (VT,CER = 1.17 VND). The uptake pattern of 11C-LY2795050 was in good accordance with the known KOR distribution, and 11C-LY2795050 was confirmed to be suitable for imaging the KOR in vivo. The primary aim of the present study was to assess the test-retest variability of 11C-LY2795050 binding parameters derived from kinetic modeling in the human brain.
MATERIALS AND METHODS
Human Subjects
Sixteen healthy subjects (19–42 years of age; 11 men and 5 women, body weight 79 ± 11 kg) were enrolled in a test-retest study. The study was approved by the Yale University Human Investigation Committee and the Yale-New Haven Hospital Radiation Safety Committee, and in accordance with federal guidelines and regulations of the United States for the protection of human research subjects contained in Title 45 Part 46 of the Code of Federal Regulations (45 CFR 46). All subjects signed a written informed consent. As part of the subject evaluation, magnetic resonance (MR) images were acquired on all subjects to eliminate those with anatomical abnormalities and for PET image registration. MR imaging was performed using a 3D MPRAGE pulse sequence with TE = 2.78 ms, TR = 2500 ms, TI = 1100 ms, and flip angle of 7 on a 3T whole-body scanner (Trio, Siemens Medical Systems, Erlangen, Germany) with a circularly polarized head coil. The dimension and pixel size of MR images were 256 × 256 × 176 and 0.98 × 0.98 × 1.0 mm3, respectively.
Radiotracer Synthesis
11C-LY2795050 was synthesized as previously described (9). Radiochemical purity of 11C-LY2795050 in the final product solution was > 98%.
Test-retest Study
Each subject underwent two 90-min PET scans with 11C-LY2795050 on the same day. The time difference between the two scans was 4.6 ± 1.1 hour. PET scans were conducted on the High Resolution Research Tomograph (HRRT) (Siemens Medical Solutions, Knoxville, TN, USA), which acquires 207 slices (1.2 mm slice separation) with a reconstructed image resolution of ~ 3 mm. Prior to tracer administration, a 6-min transmission scan was conducted for attenuation correction. Each scan was acquired in list mode after intravenous administration of 11C-LY2795050 over 1 min by an automatic pump (Harvard PHD 22/2000, Harvard Apparatus Holliston, MA, USA). Dynamic scan data were reconstructed in 27 frames (6 × 0.5 min, 3 × 1 min, 2 × 2 min, 16 × 5 min) with corrections for attenuation, normalization, scatter, randoms, and deadtime using the MOLAR algorithm (13, 14). Motion correction was included in the reconstruction algorithm based on measurements with the Polaris Vicra sensor (NDI Systems, Waterloo, Canada) with reflectors mounted on a swim cap worn by the subject. The metabolite-corrected arterial input function and the plasma free fraction (fP) were measured. The analysis procedures were previously reported (12).
Image Registration and Definition of Regions of Interest
Regions of interest (ROI) were taken from the Automated Anatomical Labeling (AAL) for SPM2 (15) in Montreal Neurological Institute (MNI) space (16). The template ROIs were applied to the PET data. The details of the registration between MR and PET images were reported previously (12). Using the combined transformations from template-to-PET space, regional TACs were generated for 14 ROIs: amygdala, caudate, centrum semiovale, cerebellum, anterior cingulate cortex, posterior cingulate cortex, frontal cortex, globus pallidus (GP), hippocampus, insula, occipital cortex, putamen, temporal cortex, and thalamus.
Quantitative Analysis
In our previous study (12), the two-tissue compartment (2TC) model and multilinear analysis-1 (MA1) method (17) were both deemed as appropriate for analysis and quantification of 11C-LY2795050 binding parameters in the human brain. Hence in this study we applied 2TC and MA1 (t* = 30 min) to the regional TACs using the arterial plasma TAC as input function. Five outcome measures were calculated: distribution volume (VT), distribution volume normalized by the plasma free fraction (VT/fP) and three binding potentials: BPND, BPP, and BPF (18). The non-displaceable distribution volume, VND, is required for the calculation of the binding potentials. In our previous analysis with a naltrexone-blocking study in human, the lowest inter-subject variability was observed when VND was estimated as a fixed fraction of cerebellum VT (VT CER = 1.17 VND). We thus calculated VND from individual VT CER to estimate the binding potentials. All modeling was performed with in-house programs written with IDL 8.0 (ITT Visual Information Solutions, Boulder, CO, USA). For parameter estimation, data points were weighted based on noise equivalent counts in each frame. Percentage standard error (%SE) was estimated from the theoretical parameter covariance matrix.
Statistical Analyses
The reproducibility of the outcome measures was assessed by computation of the following three parameters: relative test-retest variability (TRV), absolute test-retest variability (aTRV), and intra-class correlation coefficient (ICC). The TRV was calculated as follows:
The mean of TRV indicates the presence of a trend in the parameter of interest between the two scans, and the standard deviation of TRV is an index of the variability of the percent difference between the two measurements. The aTRV measure combines these two effects into one value. To evaluate the within-subject variability relative to the between-subject variability, the ICC was computed using the following equation:
where BSMSS indicates the between-subject mean sum of squares and WSMSS indicates the within-subject mean sum of squares.
Results
Injection and Scan Parameters
Injection and scan parameters are listed in Table 1. The injected dose and injected mass did not significantly differ between the test and retest scans (paired t-test, P > 0.05).
Table 1.
Subject information and PET scan parameters
| Parameter | Test (n = 16) | Retest (n = 16) |
|---|---|---|
| Age (y) | 28±7 | |
| Body weight (kg) | 78.6±11.4 | |
| Injected dose (MBq) | 390±135 | 461±178 |
| Specific activity (MBq/nmol) | 18.0±6.4 | 21.8±9.6 |
| Injected mass (μg) | 9.1±1.2 | 9.1±1.3 |
Data are mean ± SD.
Plasma Analysis
Figure 1 displays the total plasma curves, parent fractions, and metabolite-corrected plasma curves for the test and retest scans. There were no significant differences in the parent fractions between the test and retest scans (Figure 1B). The parent fraction was 42% ± 9% and 19% ± 6% at 30 and 90 min post-injection, respectively (n = 32). The plasma free fraction (fP) of 11C-LY2795050 was 0.0094 ± 0.0014 (n = 32). The TRV of fP was 5% ± 12%, with no significant change between the test and retest scans (P = 0.11, paired t-test).
Figure 1.
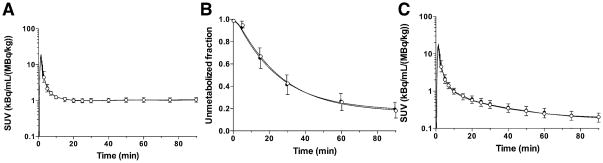
Mean ± SD of (A) total plasma activity, (B) parent fraction in the plasma, and (C) metabolite-corrected plasma activity over time after injection of 11C-LY2795050 in the test (closed circles, n = 16) and retest (open circles, n = 16) scans. Panels (A) and (C) are displayed in SUV units [concentration/(injected dose/body weight)].
Uptake Images
Figure 2 shows template MR images and summed PET images averaged across all subjects and scans. Similar uptake pattern of 11C-LY2795050 was observed in the test and retest scans. High uptake was seen in the amygdala, anterior cingulate cortex, insula, and GP.
Figure 2.

MR images and co-registered PET images summed from 30 to 90 min after injection of 11C-LY2795050: (A) MR images, (B) test scan, and (C) retest scan. PET images are displayed in SUV units. SUV images were averaged across all the subjects.
Test-retest Variability and Reproducibility of Binding Parameters
Regional TACs for representative brain regions under test and retest conditions are shown in Figures 3A and 3B, respectively. The 2TC and MA1 (t* = 30 min) models provided good fits to the regional TACs. MA1 provided reliable VT estimates with the relative standard error (rSE; (standard error)/(estimated parameter)) < 10% in most regions and scans, except for the amygdala in two scans (rSE = 10% and 13%). The 2TC VT estimates were somewhat less stable, with rSE > 10% or k4 < 0.001 min−1 in 2.5 % of the fits [amygdala (n = 4), insula (n = 1), GP (n = 1), putamen (n = 1), caudate (n = 3), and centrum semiovale (n = 1)]. Excluding these unreliable VT estimates, VT values from MA1 and 2TC were nearly identical (VT, MA1 = 1.00 VT, 2TC − 0.02, R2 = 0.99). The MA1 VT estimates were used for assessing the test-retest variability.
Figure 3.
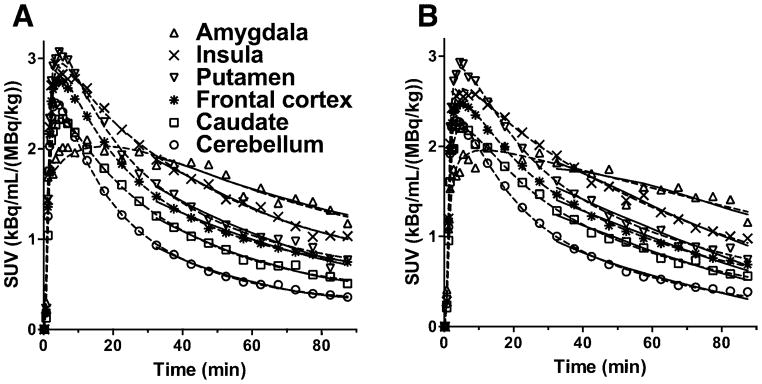
Time-activity curves from six selected regions (amygdala, insula, putamen, frontal cortex, caudate, cerebellum) after injection of 11C-LY2795050 at (A) test and (B) retest conditions from one subject. The fits with MA1 (t*= 30 min) and 2TC models are displayed in solid and dotted lines, respectively.
Table 2 shows the outcome measures of interest estimated with MA1 under test and retest conditions. Inter-subject variability was 9–16% in VT, 16–21% in VT/fP, 14–46% in BPND, 8–41% in BPP, and 15–46% in BPF. Given the relatively small magnitude of BPND (0.33 to 1.5) and BPP (0.52 to 2.42), higher inter-subject variability is expected. For the higher binding regions (e.g. BPND > 0.5), the variability of BPND and BPP values was < 30% and ≤ 20%, respectively.
Table 2.
Binding parameters derived from the multilinear analysis-1 (MA1) method
| Regions | VT [mL/cm3] (%COV) | VT/fP [mL/cm3] (%COV) | BPND (%COV) | BPP [mL/cm3] (%COV) | BPF [mL/cm3] (%COV) | |||||
|---|---|---|---|---|---|---|---|---|---|---|
|
| ||||||||||
| test | retest | test | retest | test | retest | test | retest | test | retest | |
| Amygdala | 4.17(13%) | 3.98(13%) | 439(18%) | 448(26%) | 1.55(19%) | 1.45(21%) | 2.52(15%) | 2.33(17%) | 265(21%) | 264(30%) |
| Insula | 3.40(11%) | 3.38(10%) | 357(15%) | 379(22%) | 1.07(17%) | 1.08(14%) | 1.74(11%) | 1.74(8%) | 183(15%) | 195(20%) |
| Ant. cingulate cortex | 3.28(12%) | 3.26(11%) | 345(16%) | 365(23%) | 1.00(14%) | 1.00(15%) | 1.63(12%) | 1.61(11%) | 171(17%) | 181(22%) |
| Globus pallidus | 3.13(11%) | 3.11(13%) | 329(16%) | 349(26%) | 0.92(23%) | 0.91(21%) | 1.47(16%) | 1.46(20%) | 156(21%) | 164(30%) |
| Putamen | 2.90(11%) | 2.91(10%) | 305(16%) | 326(22%) | 0.77(20%) | 0.79(21%) | 1.25(14%) | 1.27(15%) | 132(19%) | 142(24%) |
| Temporal cortex | 2.65(11%) | 2.64(10%) | 278(15%) | 295(21%) | 0.62(24%) | 0.62(22%) | 0.99(17%) | 0.99(14%) | 104(20%) | 111(20%) |
| Frontal cortex | 2.64(11%) | 2.63(11%) | 278(16%) | 294(22%) | 0.61(22%) | 0.61(20%) | 0.98(16%) | 0.98(14%) | 104(21%) | 110(22%) |
| Occipital cortex | 2.47(11%) | 2.45(10%) | 259(15%) | 274(21%) | 0.51(30%) | 0.51(27%) | 0.81(22%) | 0.81(19%) | 85(24%) | 90(23%) |
| Hippocampus | 2.35(11%) | 2.30(11%) | 247(15%) | 259(25%) | 0.44(30%) | 0.42(34%) | 0.70(25%) | 0.66(30%) | 73(26%) | 75(38%) |
| Caudate | 2.28(11%) | 2.28(12%) | 240(16%) | 256(26%) | 0.40(45%) | 0.40(47%) | 0.62(40%) | 0.63(42%) | 66(43%) | 72(51%) |
| Post. cingulate cortex | 2.19(12%) | 2.17(13%) | 230(17%) | 244(24%) | 0.33(43%) | 0.34(47%) | 0.53(36%) | 0.53(43%) | 56(38%) | 59(46%) |
| Thalamus | 2.19(9%) | 2.17(9%) | 230(15%) | 244(23%) | 0.34(43%) | 0.34(47%) | 0.53(37%) | 0.53(43%) | 57(39%) | 60(45%) |
| Centrum semiovale | 2.19(11%) | 2.14(16%) | 230(15%) | 241(27%) | 0.34(46%) | 0.31(48%) | 0.54(38%) | 0.50(43%) | 56(40%) | 56(47%) |
| Cerebellum | 1.94(16%) | 1.92(16%) | 203(19%) | 216(26%) | 0.17(0%) | 0.17(0%) | 0.28(16%) | 0.28(16%) | 30(19%) | 31(26%) |
%COV is the coefficient of variation (inter-subject variability). Values are mean of n = 16 subjects with each value measured twice in the test and retest scans.
Tables 3 and 4 list the test-retest statistics for distribution volumes and binding potentials, respectively. For the VT estimates, the global mean of TRV and aTRV across all regions was 1% and 7%, respectively. ICC values of the VT estimates were generally good (> 0.6) except for the amygdala (0.41), thalamus (0.54), and centrum semiovale (0.57). The use of fP to normalize VT led to poorer reproducibility, with global means of TRV and aTRV at −4% and 14%, respectively. In the regions with moderate to high KOR density (BPND > 0.4) with the exception of the amygdala and hippocampus, the TRV had a mean close to zero (no trend between test and retest scans) and standard deviation of 3%, and aTRV of the BPND estimates was lower than 10%. ICC values for the BPND estimates were greater than 0.8 in all regions except the amygdala (0.56). The global mean of aTRV of BPF (21%) was significantly higher than that of BPND (13%) or BPP (15%).
Table 3.
Test-retest reproducibility of volume of distribution values
| Regions | 2TC* | MA1 | |||||||
|---|---|---|---|---|---|---|---|---|---|
|
| |||||||||
| VT [mL/cm3] | VT [mL/cm3] | VT/fP [mL/cm3] | |||||||
| † aTRV [%] | † TRV [%] | ‡ ICC | † aTRV [%] | † TRV [%] | ‡ ICC | * aTRV [%] | * TRV [%] | ‡ ICC | |
| Amygdala | 9% | 3±11% | 0.39[−0.18;0.77] | 12% | 5±14% | 0.41[−0.08;0.74] | 18% | −1±22% | 0.55[0.11;0.82] |
| Insula | 7% | −1±9% | 0.58[0.13;0.84] | 7% | 0±9% | 0.68[0.31;0.87] | 14% | −5±18% | 0.46[−0.02;0.77] |
| Ant. cingulate cortex | 8% | 0±10% | 0.61[0.19;0.84] | 6% | 0±8% | 0.78[0.50;0.92] | 14% | −5±16% | 0.60[0.17;0.84] |
| Globus pallidus | 8% | 0±10% | 0.70[0.32;0.89] | 8% | 1±9% | 0.74[0.41;0.90] | 15% | −4±18% | 0.55[0.11;0.82] |
| Putamen | 7% | −2±8% | 0.73[0.37;0.90] | 6% | 0±7% | 0.81[0.55;0.93] | 13% | −6±16% | 0.57[0.14;0.83] |
| Temporal cortex | 9% | 0±11% | 0.50[0.04;0.79] | 7% | 0±8% | 0.70[0.33;0.88] | 13% | −5±17% | 0.50[0.04;0.79] |
| Frontal cortex | 8% | 0±10% | 0.61[0.20;0.84] | 7% | 0±8% | 0.74[0.41;0.90] | 13% | −5±17% | 0.54[0.09;0.81] |
| Occipital cortex | 9% | 0±11% | 0.52[0.06;0.80] | 6% | 1±7% | 0.77[0.46;0.91] | 13% | −5±16% | 0.52[0.07;0.80] |
| Hippocampus | 9% | 2±10% | 0.63[0.22;0.85] | 8% | 2±9% | 0.67[0.28;0.87] | 15% | −4±18% | 0.54[0.10;0.81] |
| Caudate | 7% | −2±8% | 0.77[0.42;0.92] | 6% | 0±7% | 0.82[0.56;0.93] | 13% | −5±16% | 0.60[0.18;0.84] |
| Post. cingulate cortex | 9% | 1±11% | 0.72[0.37;0.89] | 7% | 1±9% | 0.76[0.45;0.91] | 14% | −5±17% | 0.61[0.19;0.84] |
| Thalamus | 8% | 0±9% | 0.50[0.04;0.79] | 7% | 1±9% | 0.54[0.09;0.81] | 15% | −5±18% | 0.51[0.05;0.79] |
| Centrum semiovale | 10% | 4±13% | 0.57[0.12;0.83] | 10% | 3±13% | 0.57[0.14;0.83] | 18% | −3±20% | 0.52[0.06;0.80] |
| Cerebellum | 7% | 0±9% | 0.85[0.63;0.94] | 6% | 1±8% | 0.89[0.71;0.96] | 13% | −5±17% | 0.64[0.23;0.85] |
The 2TC VT estimates with rSE >10% or k4 < 0.001 min−1 were excluded from calculation.
TRV = (test value − retest value)/(test value + retest value)×2, and aTRV is the absolute value of TRV
ICC = (BSMSS−WSMSS)/(BSMSS+WSMSS) where BSMSS is the mean sum of squares between subjects and WSMSS is the mean sum of squares within subjects. ICC is presented with lower and upper bounds of 95% confidence interval with parentheses.
Table 4.
Test-retest reproducibility of binding potential values
| Regions | BPND | BPP [mL/cm3] | BPF [mL/cm3] | ||||||
|---|---|---|---|---|---|---|---|---|---|
|
| |||||||||
| * aTRV [%] | * TRV [%] | † ICC | * aTRV [%] | * TRV [%] | † ICC | * aTRV [%] | * TRV [%] | † ICC | |
| Amygdala | 13% | 7±17% | 0.56[0.12;0.82] | 16% | 8±20% | 0.24[−0.26;0.65] | 22% | 2±27% | 0.53[0.07;0.80] |
| Insula | 7% | −1±8% | 0.88[0.71;0.96] | 10% | 0±11% | 0.36[−0.14;0.71] | 15% | −6±19% | 0.33[−0.17;0.70] |
| Ant. cingulate cortex | 5% | 0±7% | 0.91[0.76;0.97] | 8% | 1±9% | 0.67[0.29;0.87] | 14% | −5±16% | 0.61[0.20;0.84] |
| Globus pallidus | 9% | 1±11% | 0.89[0.71;0.96] | 10% | 1±13% | 0.76[0.45;0.91] | 18% | −4±20% | 0.62[0.20;0.85] |
| Putamen | 7% | −2±8% | 0.93[0.82;0.98] | 7% | −2±8% | 0.85[0.62;0.94] | 14% | −7±15% | 0.66[0.27;0.87] |
| Temporal cortex | 6% | −1±8% | 0.95[0.87;0.98] | 9% | −1±10% | 0.77[0.47;0.91] | 15% | −6±18% | 0.59[0.16;0.83] |
| Frontal cortex | 5% | −1±7% | 0.94[0.83;0.98] | 8% | 0±10% | 0.76[0.45;0.91] | 15% | −6±18% | 0.63[0.22;0.85] |
| Occipital cortex | 9% | −1±13% | 0.95[0.87;0.98] | 10% | 0±12% | 0.86[0.66;0.95] | 14% | −6±18% | 0.71[0.36;0.89] |
| Hippocampus | 15% | 7±17% | 0.89[0.72;0.96] | 17% | 7±18% | 0.79[0.51;0.92] | 22% | 2±25% | 0.70[0.33;0.88] |
| Caudate | 10% | −2±16% | 0.98[0.95;0.99] | 10% | −1±14% | 0.96[0.90;0.99] | 15% | −7±17% | 0.88[0.69;0.95] |
| Post. cingulate cortex | 22% | 9±44% | 0.92[0.80;0.97] | 24% | 10±44% | 0.86[0.66;0.95] | 27% | 5±45% | 0.82[0.57;0.93] |
| Thalamus | 31% | 22±81% | 0.96[0.90;0.99] | 36% | 24±86% | 0.91[0.77;0.97] | 45% | 22±98% | 0.83[0.59;0.94] |
| Centrum semiovale | 33% | 16±59% | 0.82[0.58;0.93] | 35% | 15±60% | 0.70[0.34;0.88] | 42% | 11±64% | 0.67[0.29;0.87] |
TRV = (test value − retest value)/(test value + retest value)×2, and aTRV is the absolute value of TRV
ICC = (BSMSS−WSMSS)/(BSMSS+WSMSS) where BSMSS is the mean sum of squares between subjects and WSMSS is the mean sum of squares within subjects. ICC is presented with lower and upper bounds of 95% confidence interval with parentheses.
Discussion
In this paper we present the test-retest variability and reproducibility of regional binding parameters derived from the KOR antagonist tracer 11C-LY2795050 in human brain.
In accordance with our previous analysis, the 2TC and MA1 models showed similarly good fits to regional TACs, and provided almost identical VT values. However, VT estimates with the 2TC model were unstable in some regions. Hence, the MA1 estimates were used for test-retest reproducibility assessment.
The small variability in the injected mass of 11C-LY2795050 is due to the mass limit of 10 μg, which was reached in most scans because of the narrow range in tracer specific activity (Table 1). Receptor occupancy by the carrier mass was calculated from the equation: 100 × F/(F + KD), where F is the mean value (from 60 to 90 min after injection) of the protein-unbound and metabolite-corrected plasma concentration. Using the in vitro (0.72 nmol/L (9)) and in vivo (0.028 nmol/L (12)) KD values, the occupancy by carrier mass in all scans was calculated as <0.2% and <3%, respectively. In our previous study in rhesus monkeys (11), the LY2795050 ED50 at KOR was estimated as 15.6 μg/kg. Using this ED50 value, the occupancy by LY2795050 was < 1.5% in all scans. In either way, the injected tracer occupied < 5% of the targeted receptor and fulfilled the tracer dose criterion.
The plasma free fraction was used to calculate the normalized distribution volume (VT/fP) and binding potentials relative to free tracer in tissue (BPF). If fP was measured accurately and the distribution volume varies linearly with fP, the use of fP for normalization would reduce the TRV or aTRV. However, fP was too low (< 1%) to be measured accurately for this tracer. Moreover, comparing distribution volume and binding potential with or without correction by fP (VT and VT/fP, and BPP and BPF), the absolute TRV was higher and ICC lower for the estimates with fP correction in comparison to the estimates without fP correction in all regions, because fP is higher in the test scan than the retest scan. Among the three binding potentials, BPF showed the highest aTRV, which is twice of that for BPND. Normalization of VT by fP or binding potential calculated with fP led to worse test-retest reproducibility and reliability, possibly due to small errors in fP measurements.
Test-retest performance of 11C-LY2795050 in VT estimates was excellent across all regions with mean TRV close to 0%, and aTRV of <10%, except for the amygdala and centrum semiovale (aTRV of 12% and 10%, respectively) (Table 3). Similarly, in regions with moderate and high KOR densities, the test-retest variability of BPND and BPP estimates was also good. However, in regions with low KOR density (posterior cingulate cortex, thalamus, centrum semiovale), not surprisingly, the variability of BPND and BPP were higher than that of VT. On the basis of these TRV values, the use of binding potentials would likely be limited to regions with moderate to high KOR density. In this study, we calculated binding potentials with a fixed fraction of individual cerebellum VT as VND. An important assumption here is that the fraction is not changed between the test and retest scans. Obviously, the use of a fixed fraction of cerebellum VT as VND will also need validation in different patient populations by blocking experiments, and in subjects under drug challenge conditions. The use of VT instead of binding potentials is most appropriate, and preferred, if this assumption of a fixed fraction of cerebellum VT as VND is no longer valid, depending on disease or experimental conditions.
The aTRV in the highest binding region, amygdala, was > 10% in all outcome measures although it was lower in other high binding regions. This is likely due to its small size leading to a noisy TAC.
The development of selective KOR imaging agents has been pursued for a long time (19). Although several radiotracers have been developed over the years, thus far only the KOR agonist 11C-GR103545 has been investigated extensively in vivo in nonhuman primates (20, 21) and humans (22), and was found to be a suitable radiotracer for KOR imaging and quantification. As part of a comprehensive evaluation in humans, the test-retest performance of 11C-GR103545 was assessed using methods similar to those described above for 11C-LY2795050 (22). Mean aTRV of VT estimates was about 15% for 11C-GR103545, as compared with <10% for 11C-LY2795050. This difference in test-retest reproducibility of VT estimates is most likely derived from the kinetic behavior of these two tracers: 11C-LY2795050 has fast kinetics, while kinetics of 11C-GR103545 is protracted.
11C-GR103545 is the first KOR agonist radiotracer advanced to imaging applications in human, and 11C-LY2795050 is the first KOR antagonist tracer evaluated in human, both from our laboratory. As a result we now have a pair of agonist and antagonist radiotracers available for in vivo investigation of the KOR.
The opioid receptors belong to the superfamily of G-protein coupled receptors, and G-protein coupled receptors are considered to have two states: a high affinity for agonists, and a low affinity state. Agonists bind only to the high affinity state, while antagonists do not distinguish the low and high affinity states and bind to both. Hence, the availability of a pair of agonist (11C-GR103545) and antagonist (11C-LY2795050) KOR tracers for use in human will provide unique opportunities to assess the potential changes not only in total receptor expression, but also in receptor state under disease conditions, as seen in the studies of dopamine D2/D3 receptors with the agonist tracers 11C-(+)-PHNO, 11C-NPA or 11C-MNPA and the antagonist tracer 11C-raclopride (23–30).
Given the excellent reproducibility of VT estimates derived from PET imaging of KOR with 11C-LY2795050 in the human brain and the involvement of KOR in a number of neuropsychiatric disorders, 11C-LY2795050 is currently being used at our center in multiple clinical imaging studies to investigate the role of KOR in depression, post-traumatic stress disorder (PTSD)(31), cocaine addiction, and alcoholism.
Conclusions
In this report we evaluated the reproducibility of binding parameters with 11C-LY2795050 in humans and found that this novel KOR antagonist radiotracer provides excellent test-retest reproducibility, with absolute test-retest variability of ≤ 10% in all brain regions except the amygdala. Results from the present study strongly support the use of 11C-LY2795050 as a PET radiotracer to image and quantitate KOR in human with high reliability.
Acknowledgments
The authors appreciate the excellent technical assistance of the staff at the Yale University PET Center. This study was supported by Eli Lilly and Company, and by a research grant from NIMH (1 R01 MH091537 to Y. Huang). This publication was also made possible by CTSA Grant UL1 RR024139 from the National Center for Research Resources (NCRR) and the National Center for Advancing Translational Sciences (NCATS), components of the National Institutes of Health (NIH).
Footnotes
Its contents are solely the responsibility of the authors and do not necessarily represent the official view of NIH.
References
- 1.Van’t Veer A, Carlezon WA., Jr Role of kappa-opioid receptors in stress and anxiety-related behavior. Psychopharmacology (Berl) 2013;229:435–452. doi: 10.1007/s00213-013-3195-5. [DOI] [PMC free article] [PubMed] [Google Scholar]
- 2.Mello NK, Negus SS. Interactions between kappa opioid agonists and cocaine. Preclinical studies. Ann N Y Acad Sci. 2000;909:104–132. doi: 10.1111/j.1749-6632.2000.tb06678.x. [DOI] [PubMed] [Google Scholar]
- 3.Tenore PL. Psychotherapeutic benefits of opioid agonist therapy. J Addict Dis. 2008;27:49–65. doi: 10.1080/10550880802122646. [DOI] [PubMed] [Google Scholar]
- 4.Gerra G, Fantoma A, Zaimovic A. Naltrexone and buprenorphine combination in the treatment of opioid dependence. J Psychopharmacol. 2006;20:806–814. doi: 10.1177/0269881106060835. [DOI] [PubMed] [Google Scholar]
- 5.de Lanerolle NC, Williamson A, Meredith C, et al. Dynorphin and the kappa 1 ligand [3H]U69,593 binding in the human epileptogenic hippocampus. Epilepsy Res. 1997;28:189–205. doi: 10.1016/s0920-1211(97)00044-2. [DOI] [PubMed] [Google Scholar]
- 6.Mathieu-Kia AM, Fan LQ, Kreek MJ, Simon EJ, Hiller JM. Mu-, delta- and kappa-opioid receptor populations are differentially altered in distinct areas of postmortem brains of Alzheimer’s disease patients. Brain Res. 2001;893:121–134. doi: 10.1016/s0006-8993(00)03302-3. [DOI] [PubMed] [Google Scholar]
- 7.Carr GV, Bangasser DA, Bethea T, Young M, Valentino RJ, Lucki I. Antidepressantlike effects of kappa-opioid receptor antagonists in Wistar Kyoto rats. Neuropsychopharmacology. 2010;35:752–763. doi: 10.1038/npp.2009.183. [DOI] [PMC free article] [PubMed] [Google Scholar]
- 8.Schank JR, Goldstein AL, Rowe KE, et al. The kappa opioid receptor antagonist JDTic attenuates alcohol seeking and withdrawal anxiety. Addict Biol. 2012;17:634–647. doi: 10.1111/j.1369-1600.2012.00455.x. [DOI] [PMC free article] [PubMed] [Google Scholar]
- 9.Zheng MQ, Nabulsi N, Kim SJ, et al. Synthesis and evaluation of 11C-LY2795050 as a kappa-opioid receptor antagonist radiotracer for PET imaging. J Nucl Med. 2013;54:455–463. doi: 10.2967/jnumed.112.109512. [DOI] [PMC free article] [PubMed] [Google Scholar]
- 10.Huang Y, Zheng MQ, Gerdes JM. Development of effective PET and SPECT imaging agents for the serotonin transporter: has a twenty-year journey reached its destination? Curr Top Med Chem. 2010;10:1499–1526. doi: 10.2174/156802610793176792. [DOI] [PubMed] [Google Scholar]
- 11.Kim SJ, Zheng MQ, Nabulsi N, et al. Determination of the in vivo selectivity of a new kappa-opioid receptor antagonist PET tracer C-11-LY2795050 in the rhesus monkey. J Nucl Med. 2013;54:1668–1674. doi: 10.2967/jnumed.112.118877. [DOI] [PMC free article] [PubMed] [Google Scholar]
- 12.Naganawa M, Zheng MQ, Nabulsi N, et al. Kinetic modeling of 11C-LY2795050, a novel antagonist radiotracer for PET imaging of the kappa opioid receptor in humans. J Cereb Blood Flow Metab. 2014;34:1818–1825. doi: 10.1038/jcbfm.2014.150. [DOI] [PMC free article] [PubMed] [Google Scholar]
- 13.Carson RE, Barker WC, Liow JS, Johnson CA. Design of a motion-compensation OSEM list-mode algorithm for resolution-recovery reconstruction for the HRRT. IEEE 2003 Nuclear Science Symposium Conference Record. 2003;5:3281–3285. [Google Scholar]
- 14.Jin X, Mulnix T, Gallezot JD, Carson RE. Evaluation of motion correction methods in human brain PET imaging--a simulation study based on human motion data. Med Phys. 2013;40:102503. doi: 10.1118/1.4819820. [DOI] [PMC free article] [PubMed] [Google Scholar]
- 15.Tzourio-Mazoyer N, Landeau B, Papathanassiou D, et al. Automated anatomical labeling of activations in SPM using a macroscopic anatomical parcellation of the MNI MRI single-subject brain. Neuroimage. 2002;15:273–289. doi: 10.1006/nimg.2001.0978. [DOI] [PubMed] [Google Scholar]
- 16.Holmes CJ, Hoge R, Collins L, Woods R, Toga AW, Evans AC. Enhancement of MR images using registration for signal averaging. J Comput Assist Tomogr. 1998;22:324–333. doi: 10.1097/00004728-199803000-00032. [DOI] [PubMed] [Google Scholar]
- 17.Ichise M, Liow JS, Lu JQ, et al. Linearized reference tissue parametric imaging methods: application to [11C]DASB positron emission tomography studies of the serotonin transporter in human brain. J Cereb Blood Flow Metab. 2003;23:1096–1112. doi: 10.1097/01.WCB.0000085441.37552.CA. [DOI] [PubMed] [Google Scholar]
- 18.Innis RB, Cunningham VJ, Delforge J, et al. Consensus nomenclature for in vivo imaging of reversibly binding radioligands. J Cereb Blood Flow Metab. 2007;27:1533–1539. doi: 10.1038/sj.jcbfm.9600493. [DOI] [PubMed] [Google Scholar]
- 19.Henriksen G, Willoch F. Imaging of opioid receptors in the central nervous system. Brain. 2008;131:1171–1196. doi: 10.1093/brain/awm255. [DOI] [PMC free article] [PubMed] [Google Scholar]
- 20.Talbot PS, Narendran R, Butelman ER, et al. 11C-GR103545, a radiotracer for imaging kappa-opioid receptors in vivo with PET: synthesis and evaluation in baboons. J Nucl Med. 2005;46:484–494. [PubMed] [Google Scholar]
- 21.Tomasi G, Nabulsi N, Zheng MQ, et al. Determination of in vivo Bmax and Kd for 11C-GR103545, an agonist PET tracer for kappa-opioid receptors: a study in nonhuman primates. J Nucl Med. 2013;54:600–608. doi: 10.2967/jnumed.112.112672. [DOI] [PMC free article] [PubMed] [Google Scholar]
- 22.Naganawa M, Jacobsen LK, Zheng MQ, et al. Evaluation of the agonist PET radioligand [11C]GR103545 to image kappa opioid receptor in humans: Kinetic model selection, test-retest reproducibility and receptor occupancy by the antagonist PF-04455242. Neuroimage. 2014;99:69–79. doi: 10.1016/j.neuroimage.2014.05.033. [DOI] [PMC free article] [PubMed] [Google Scholar]
- 23.Boileau I, Payer D, Chugani B, et al. The D2/3 dopamine receptor in pathological gambling: a positron emission tomography study with [11C]-(+)-propyl-hexahydro-naphtho-oxazin and [11C]raclopride. Addiction. 2013;108:953–963. doi: 10.1111/add.12066. [DOI] [PubMed] [Google Scholar]
- 24.Caravaggio F, Raitsin S, Gerretsen P, Nakajima S, Wilson A, Graff-Guerrero A. Ventral striatum binding of a dopamine D2/3 receptor agonist but not antagonist predicts normal body mass index. Biol Psychiatry. 2013 doi: 10.1016/j.biopsych.2013.02.017. (published online) [DOI] [PMC free article] [PubMed] [Google Scholar]
- 25.Graff-Guerrero A, Willeit M, Ginovart N, et al. Brain region binding of the D2/3 agonist [11C]-(+)-PHNO and the D2/3 antagonist [11C]raclopride in healthy humans. Hum Brain Mapp. 2008;29:400–410. doi: 10.1002/hbm.20392. [DOI] [PMC free article] [PubMed] [Google Scholar]
- 26.Gallezot JD, Kloczynski T, Weinzimmer D, et al. Imaging nicotine- and amphetamine-induced dopamine release in rhesus monkeys with [11C]PHNO vs [11C]raclopride PET. Neuropsychopharmacology. 2014;39:866–874. doi: 10.1038/npp.2013.286. [DOI] [PMC free article] [PubMed] [Google Scholar]
- 27.Narendran R, Mason NS, Laymon CM, et al. A comparative evaluation of the dopamine D(2/3) agonist radiotracer [11C](−)-N-propyl-norapomorphine and antagonist [11C]raclopride to measure amphetamine-induced dopamine release in the human striatum. J Pharmacol Exp Ther. 2010;333:533–539. doi: 10.1124/jpet.109.163501. [DOI] [PMC free article] [PubMed] [Google Scholar]
- 28.Seneca N, Finnema SJ, Farde L, et al. Effect of amphetamine on dopamine D2 receptor binding in nonhuman primate brain: a comparison of the agonist radioligand [11C]MNPA and antagonist [11C]raclopride. Synapse. 2006;59:260–269. doi: 10.1002/syn.20238. [DOI] [PubMed] [Google Scholar]
- 29.Tsukada H, Ohba H, Nishiyama S, Kakiuchi T. Differential effects of stress on [11C]raclopride and [11C]MNPA binding to striatal D2/D3 dopamine receptors: a PET study in conscious monkeys. Synapse. 2011;65:84–89. doi: 10.1002/syn.20845. [DOI] [PubMed] [Google Scholar]
- 30.Kodaka F, Ito H, Kimura Y, et al. Test-retest reproducibility of dopamine D2/3 receptor binding in human brain measured by PET with [11C]MNPA and [11C]raclopride. Eur J Nucl Med Mol Imaging. 2013;40:574–579. doi: 10.1007/s00259-012-2312-8. [DOI] [PubMed] [Google Scholar]
- 31.Pietrzak RH, Naganawa M, Huang Y, et al. Association of in vivo kappa-opioid receptor availability and the transdiagnostic dimensional expression of trauma-related psychopathology. JAMA psychiatry. 2014;71:1262–1270. doi: 10.1001/jamapsychiatry.2014.1221. [DOI] [PubMed] [Google Scholar]