

Abstract
Mammalian target of rapamycin (mTOR) is an evolutionarily conserved serine/threonine kinase controlling many physiological processes in mammals. mTOR functions in two distinct protein complexes, namely mTORC1 and mTORC2. Compared to mTORC1, the specific roles of mTORC2 are less well understood. To investigate the potential contribution of mTORC2 to skeletal development and homeostasis, we have genetically deleted Rictor, an essential component of mTORC2, in the limb skeletogenic mesenchyme of the mouse embryo. Loss of Rictor leads to shorter and narrower skeletal elements in both embryos and postnatal mice. In the embryo, Rictor deletion reduces the width but not the length of the initial cartilage anlage. Subsequently, the embryonic skeletal elements are shortened due to a delay in chondrocyte hypertrophy, with no change in proliferation, apoptosis, cell size, or matrix production. Postnatally, Rictor-deficient mice exhibit impaired bone formation, resulting in thinner cortical bone, but the trabecular bone mass is relatively normal thanks to a concurrent decrease in bone resorption. Moreover, Rictor-deficient bones exhibit a lesser anabolic response to mechanical loading. Thus, mTORC2 signaling is necessary for optimal skeletal growth and bone anabolism.
Keywords: mTORC2, RICTOR, CARTILAGE, BONE, MECHANICAL LOADING, MOUSE
Introduction
Mammalian target of rapamycin (mTOR) signaling has emerged as a central mechanism in controlling many physiological processes in mammalian cells.(1) However, specific functions of the two mTOR-containing complexes, mTORC1 versus mTORC2, at the tissue level in whole organisms are just beginning to be understood. In particular, the physiological role of mTORC2 has been understudied. In contrast to mTORC1, mTORC2 contains Rictor, and phosphorylates a distinct set of downstream targets, including members of the AGC family of kinases such as Akt (at position Ser 473), serum- and glucocorticoid-induced protein kinase 1 (SGK1), and protein kinase C-α (PKC-α).(1–3) Early studies in cell culture showed that mTORC2 controls actin cytoskeleton through modulating PKC-α.(4,5) More recently, mouse genetic studies have implicated hepatic mTORC2 in regulating whole-body metabolism.(6) An increasing number of secreted factors including insulin/IGF1 and Wnt have been shown to activate mTORC2.(6,7) In addition, mechanical stress was shown to activate mTORC2 in vitro.(8) Because both the aforementioned secreted factors and mechanical stress play important roles in skeletal biology, we hypothesize that mTORC2 signaling may regulate skeletal development and homeostasis.(9–11)
Much of the mammalian skeleton including long bones in the limb is formed via endochondral ossification that initiates in the embryo.(12) The process begins with mesenchymal condensations that give rise to cartilage anlagen encased by the perichondrium. After the initial proliferation that increases the size of the cartilage template, chondrocytes at the center along the long axis of the template exit the cell cycle and undergo hypertrophy, whereas those at either end of the template remain mitotic and organize into two morphologically distinct regions containing round versus columnar chondrocytes. Concurrently, perichondrial cells flanking the hypertrophic region differentiate into osteoblasts that produce the bone collar. Most hypertrophic chondrocytes are believed to undergo apoptosis, followed by blood vessel invasion and removal of the hypertrophic cartilage matrix. Meanwhile, osteoblast progenitors co-migrating with the invading blood vessels differentiate into osteoblasts that deposit the trabecular bone.(13) Thus, chondrocyte hypertrophy is tightly coupled with bone formation and is critical for skeletal growth during embryogenesis.
Bone formation continues in postnatal life. This includes bone deposition at the periosteal surface, resulting in widening of the long bones, but the molecular regulation for periosteal bone accrual is just beginning to be understood. A high-bone-mass allele of Lrp5 (A214V) and deletion of Sost both stimulate periosteal bone deposition in the mouse, implicating Wnt signaling in the process.(14–16) Mechanical loading is also known to stimulate periosteal bone formation proportional to the magnitude of strain and at least in part through Wnt signaling.(17–21) In all cases, however, the intracellular molecules mediating the anabolic response are not well understood.
In this study, by deleting Rictor in the limb mesenchyme with Prx1-Cre, we find that mTORC2 signaling promotes skeletal growth via regulation of chondrocyte hypertrophy, and also contributes to the periosteal bone accrual in response to mechanical loading.
Materials and Methods
Mice
Prx1-Cre mice, as reported,(22) were purchased from Jackson Laboratory (Bar Harbor, ME, USA). Rictorflox/flox mice are as described,(23) and kindly provided by Dr. Jeffrey Arbeit at Washington University. Washington University Animal Studies Committee approved all mouse procedures.
Analyses of mouse embryos
Alizarin Red/Alcian Blue staining of embryonic skeleton was performed following protocols described by McLeod.(24) For histological analyses, embryonic limbs were fixed in 10% formalin, decalcified in EDTA (for embryonic day 16.5 [E16.5] or older embryos), and embedded in paraffin. H&E, Von Kossa, and Alcian Blue/Picrosirius Red staining were performed on paraffin sections following the standard procedures. In situ hybridization was performed with 35S-labeled riboprobes as described.(25–28) For cell proliferation assays, pregnant females were injected intraperitoneally with BrdU (0.1 mg/g body weight), and euthanized 2 hours later. BrdU-positive cells were detected on paraffin sections with Zymed’s BrdU staining kit (Zymed Laboratories, San Francisco, CA, USA). The percentage of BrdU-positive cells was quantified from at least 3 animals of each genotype. TUNEL assay was carried out on paraffin sections with In Situ Cell Death Detection Kit TMR Red (Roche, Indianapolis, IN, USA) according to the manufacturer’s instructions.
Analyses of postnatal mice
X-ray, micro–computed tomography (μCT), and histomorphometry were performed as described.(29,30) The thresholds for μCT quantification of trabecular and cortical bone parameters were set at 200/1000 and 250/1000, respectively. μCT analyses of cortical bone parameters were performed on 50-μCT slices (0.8 mm total) from the middle shaft of femurs; trabecular parameters were assessed in 100-μCT slices (1.6 mm total) immediately below the distal growth plate of the femur.
Metabolic labeling of protein synthesis in primary chondrocytes
Mouse primary sternal chondrocytes were isolated and cultured as described.(31) Isolated chondrocytes were seeded in six-well plates at 1 × 10⁶ cells/well. After overnight culture, cells were infected with adenovirus expressing either green fluorescence protein or Cre at a multiplicity of infection (MOI) of 100 for 72 hours. Chondrocytes were then either trypsinized for cell counting followed by lysis with radioimmunoprecipitation assay (RIPA) buffer, or used directly for metabolic labeling. Metabolic labeling was performed as reported.(32) The amount of 35S incorporated into protein was normalized to cell number.
Mouse bone marrow stromal cell cultures and osteoblast differentiation
Isolation and culture of mouse bone marrow stromal cells (BMSCs) were described.(33) Once BMSCs reached confluency at days 7 to 8, cells were reseeded at 0.6 × 10⁵ cells/cm2, and then infected with adenovirus expressing either GFP or Cre at a MOI of 100. After 72 hours of viral infection, BMSCs were cultured in osteogenic media (α-MEM containing 10% FBS, 1% penicillin/streptomycin, 50 μg/mL L-ascorbic acid, and 10 mM β-glycer-ophosphate) for 7 days (for alkaline phosphatase staining and qPCR analysis) or 14 days (for von Kossa staining). Alkaline phosphatase staining was performed as reported.(34) For von Kossa staining, cells were fixed in cold methanol for 20 minutes, rinsed with double-distilled water (ddH2O), and then incubated with 5% silver nitrate solution under bright light for 30 minutes.
Western blot and qPCR
Total protein was extracted from mouse forelimb buds or cell cultures using RIPA buffer. Thirty-microgram (30 μg) protein samples were subsequently resolved by 10% SDS-polyacryl-amide gel electrophoresis and subjected to standard Western blot procedures. Antibodies for Akt, pAkt (S473), rictor, P-4EBP1 (S65), 4EBP1, P-S6 (S240/244), S6, P-FoxO1(T24)/3a(T32), FoxO3a, P-Ndrg1(T346), and β-actin were all purchased from Cell Signaling (Beverly, MA, USA), and were used in 1:1000 dilution. Total RNA was extracted from E12.5 hindlimb bud tissues or cell cultures using RNAeasy mini kit (Qiagen, Valencia, CA, USA). One microgram (1 μg) of total RNA was reverse-transcribed to cDNA using iScript Reverse Transcription Supermix (Bio-Rad, Hercules, CA, USA). qPCR was performed using SYBR green Supermix (Bio-Rad). Gene expression was first normalized to β-actin, and then normalized to control samples. The primers used in this study are listed in Supporting Table S1.
In vivo tibial axial loading
Prior to in vivo loading, WT (n = 4) and Prx1Cre;rictorf/f (RiCKO) (n = 4) mice were strain-gauged on the anteromedial surface, 5 mm proximal to the tibia-fibular junction, in order to apply strain-matched loads. The estimated force-strain relationship for WT mice was ε = 343F + 510 and for RiCKO was ε = 552F + 784, where F represents the negative compressive forces and ε represents the peak compressive strain generated at the periosteal surface of the posterolateral region of the tibia.
For in vivo loading, mice were anesthetized (2% to 3% isoflurane) and their right tibias were subjected to axial compression for 1200 cycles/day (4-Hz triangle waveform with 0.1-s rest-insertion after each cycle) using a materials testing system (Electropulse 1000; Instron, Norwood, MA, USA), as described.(17,35,36) Mice (n = 5/group) were loaded 5 days/week for 2 weeks (study days 1 to 5 and 8 to 12). After each loading session, mice received buprenorphine (0.1 mg/kg i.m.) and were returned to their cages for unrestricted activity. The left tibia served as a non-loaded, contralateral control. To determine changes in bone mass and structure, right and left tibia were scanned before and after loading with VivaCT (VivaCT 40; Scanco, Brüttisellen, Switzerland) with the setting of 70 kV, 114 mA, and 21.5 μm voxel resolution. Analyses of cortical bone parameters were performed on 50 slices (total of 1.075 mm) starting from 5 mm proximal to the distal tibia-fibular junction. For dynamic histomorphometry, fluorochromes were injected intraperitoneally on days 5 (calcein green, 10 mg/kg; Sigma, St. Louis, MO, USA) and 12 (alizarin complexone, 30 mg/kg; Sigma), and tibias were harvested on day 17. Dynamic histomorphometric analysis was performed on 30-μm sections taken at the mid-diaphysis, 5 mm proximal of the distal tibiofibular junction, using commercial software (Osteo II, BIOQUANT, Nashville, TN, USA) to determine measures of bone formation. Those measures included mineralizing surface (MS/BS), mineral apposition rate (MAR), and bone-formation rate (BFR/BS).(37) Endocortical (E) and periosteal (P) surfaces were analyzed separately. To assess the local loading effect, relative (r) values were computed for each mouse as loaded (right) minus non-loaded (left).
Statistics
All quantitative data are presented as mean ± SD with a minimum of three independent samples. Statistical significance is determined by two-tailed Student’s t test. A p value less than 0.05 is considered statistically significant.
Results
mTORC2 promotes embryonic skeletal growth
To investigate the role of mTORC2 in skeletal development, we deleted Rictor in early limb mesenchymal cells with Prx1-Cre.(22) Briefly, Prx1Cre;Rictorf/+ male mice were crossed with Rictorf/f females to generate Prx1Cre;Rictorf/f progenies (hereafter RiCKO). The deletion efficiency was evaluated in the limb buds of E12.5 embryos. Western blot showed that Rictor levels and phosphorylation of AKT at S473, a direct readout of mTORC2 activity, were both markedly reduced in the RiCKO limb buds (Fig. 1A). Similarly, qPCR confirmed that rictor mRNA level was reduced by about 80% in the mutant samples (Supporting Fig. S1A).
Fig. 1.

mTORC2 promotes embryonic skeletal growth. (A) Western blot analyses of E12.5 forelimbs. (B) Limb skeleton at E18.5. Cartilage stained blue; bone collar stained red. (C) Relative lengths of long bones. n = 4 for each genotype; *p < 0.05. (D) Longitudinal sections of humeri at E18.5. Cartilage stains blue; bone stains red. Double-headed arrows denote bone collar length. (E) H&E staining of longitudinal sections of humeri at E18.5. Boxed areas shown at higher magnification in lower panels. (F) Chondrocyte density. n = 3 for each genotype. FL = forelimb; HL = hindlimb; BL = bone collar length; CL = cartilage length; TL = total length; BW = bone width; C = columnar region; R = round region.
The RiCKO mice were born at the expected Mendelian ratio with no gross abnormality. However, skeletal staining of the embryos at E18.5 indicated that the limb skeletal elements of the mutant embryos were slightly shorter and thinner than their normal counterparts (Fig. 1B, Supporting Fig. S1B). Measurements confirmed that the total length (TL) of humerus, femur, radius, or tibia was shortened by 10% to 15% in RiCKO embryos compared to the normal littermates (Fig. 1C, Supporting Fig. S1C). Similarly, the diaphyseal width of each bone (BW; measured at mid-point of bone shaft) was reduced by 15% to 25% in the mutants (Fig. 1C, Supporting Fig. S1C). Interestingly, when the cartilaginous versus bony portion (stained blue and red, respectively) of each element was measured separately, the bone shaft (BL) accounted for the entire length difference between RiCKO and control bones, whereas the cartilage length (CL) was not significantly different between the genotypes (Fig. 1C, Supporting Fig. S1C). Histology of the humerus corroborated the shortening of bone shaft in the mutant (Fig. 1D). Closer examination of the cartilage did not detect any difference in chondrocyte morphology or organization in either the round or columnar zone between the genotypes (Fig. 1E). The cell density within these regions was also normal in the RiCKO embryo (Fig. 1F). Thus, mTORC2 is necessary for the optimal growth of embryonic long bones in both length and width, but does not overtly affect the morphology of growth-region cartilage.
We next examined other aspects of chondrocyte biology. BrdU labeling experiments detected no defect in cell proliferation within either round or columnar chondrocytes of the proximal humerus in RiCKO embryos at E15 (Fig. 2A, B). The normal cell density within the matrix-rich cartilage suggested that mTORC2 was unlikely to play an important role in the regulation of protein synthesis. To test this notion directly, we performed metabolic labeling experiments to measure the rate of protein synthesis in primary chondrocytes with or without Rictor deletion. Chondrocytes isolated from newborn Rictorf/f mice were infected with adenovirus expressing either Cre or GFP as control. Western blot analyses confirmed effective Cre-mediated deletion of Rictor, and the expected suppression of Akt phosphorylation at S473 (P-AKT(S473)), a known target of mTORC2 (Fig. 2C). In contrast, phosphorylation of 4EBP1 or S6, both targets of mTORC1, was not affected (Fig. 2C). Importantly, Rictor-deficient chondrocytes exhibited a normal protein synthesis rate when compared to the control (Fig. 2D). Taken together, these data indicate that mTORC2 is dispensable for chondrocyte proliferation and protein synthesis.
Fig. 2.
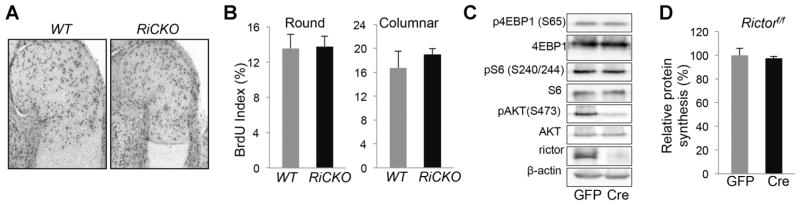
mTORC2 is dispensable for chondrocyte proliferation and protein synthesis. (A) Representative images of BrdU staining at proximal end of humerus at E15. (B) BrdU labeling index (% positive cells) in round and columnar regions. n = 3 for each genotype. Western blot analyses (C) and metabolic labeling (D) of primary chondrocytes isolated from Rictorf/f mice and infected with adenovirus expressing GFP or Cre. n = 3.
mTORC2 enhances chondrocyte hypertrophy
The size deficit of long bones in late embryos could result from a smaller cartilage anlage at an earlier stage of embryogenesis. To explore this possibility, we examined embryos at E13.5 when the limb skeletal elements had not yet initiated bone formation, and chondrocytes were yet to undergo overt hypertrophy. At this stage, the humerus in RiCKO embryos had normal length but reduced width compared to the control (Fig. 3A, B). Therefore, although the width deficit in RiCKO bones began with the cartilage anlage, the length deficiency had a later origin.
Fig. 3.

mTORC2 enhances chondrocyte hypertrophy. (A) Representative images of forelimb cartilage at E13.5. Double-headed arrows denote length of humerus. (B) Relative length of humerus at E13.5. *p < 0.05, n = 3. (C) H&E staining (upper) and in situ hybridization (lower) of humeral sections at E15. Double-headed arrows indicate hypertrophic zone. In situ hybridization signal in red. (D) TUNEL assays on longitudinal sections of humerus at E15. Arrows denote apoptosis in perichondrium.
Chondrocyte hypertrophy is a major driving force for the longitudinal growth of long bones. We therefore examined the status of hypertrophy in RiCKO versus control embryos. At E15, histology showed that the hypertrophic zone was notably shorter in the mutant compared to the control embryo (Fig. 3C, upper panels). In situ hybridization for collagen type X alpha 1 (Col10α1), a specific marker for early and intermediate hypertrophic chondrocytes, revealed that in the control embryo, cells within the central hypertrophic domain no longer expressed the marker, indicative of their terminal hypertrophic stage (Fig. 3C, lower panels). In contrast, all hypertrophic chondrocytes in the RiCKO embryo continued to express high levels of Col10α1 at E15. Consistent with a delay in terminal hypertrophy (eventually leading to apoptosis) in the RiCKO embryo, TUNEL assays detected apoptosis of hypertrophic chondrocytes only in the WT littermate, even though apoptosis occurred within the perichondrium in both genotypes (Fig. 3D). The delay in terminal hypertrophy of chondrocytes is expected to diminish the longitudinal growth of long bones in RiCKO embryos.
mTORC2 augments bone formation
In addition to the smaller long bones, whole-mount skeletal staining also revealed a deficit in ossification of the skull in RiCKO embryos. This was most evident at E16.5 and E17.5, but remained detectable at E18.5 (Fig. 4A, Supporting Fig. S1B). Because the skull is targeted by Prx1-Cre, this finding is consistent with a direct role of Rictor in bone formation. To ensure that Rictor deletion disrupted normal mTORC2 signaling in osteoblasts, we cultured calvarial osteoblasts from neonatal Rictorf/f mice and infected them with adenovirus expressing Cre or GFP. Western blot analyses showed that rictor deletion markedly suppressed P-Akt(S473) and P-Ndrg1(T346), both indicators for mTORC2 activity (Fig. 4B). On the other hand, phosphorylation of FoxO1/3a was not notably impaired by Rictor deletion. To test the function of mTORC2 directly, we performed osteoblast differentiation assays in vitro, with BMSCs isolated from postnatal mice. We confirmed that after 7 days of culture in osteogenic media, BMSCs from WT mice markedly upregulated osteocalcin (also known as Bglap), a marker for mature osteoblasts. Interestingly, upon differentiation, BMSCs also increased the expression of mTORC2 components, including Rictor, Mlst8, Sin1, and mTOR (Fig. 4C). We then isolated BMSCs from Rictorf/f mice and infected them with adenovirus expressing Cre or GFP. After 7 days of culture in osteogenic media, Rictor-deficient cells exhibited a markedly lower level of alkaline phosphatase (AP) activity (Fig. 4D, upper panels). After 14 days, the Rictor-deficient cells failed to undergo mineralization, as indicated by the lack of von Kossa staining (Fig. 4D, lower panels). Furthermore, molecular analyses by qPCR in cells after 7 days of differentiation confirmed a markedly lower mRNA level of Alpl in the Rictor-deficient cells, along with several other osteoblast markers including Sp7, Ibsp, and Bglap, even though Runx2, Col1α1, or Twist1, which encodes an antagonist of Runx2, were relatively normal (Fig. 4E). In addition, the Rictor-deficient cells expressed significantly less Rankl (also known as Tnfsf11), even though other regulators of osteoclastogenesis such as Opg (also known as Tnfrsf11b) and M-CSF (also known as Csf1) were relatively normal (Fig. 4F). These results indicate that mTORC2 signaling directly promotes osteoblast differentiation, and may indirectly stimulates osteoclastogenesis.
Fig. 4.

mTORC2 promotes osteoblast differentiation. (A) Representative images of skull at E16.5 and E17.5. Cartilage stained blue; bone stained red. Red arrows denote parietal bone; asterisks denote interparietal bone. (B) Western blot analyses of calvarial osteoblasts isolated from Rictorf/f neonates and infected with adenovirus expressing GFP or Cre for 4 days. (C) qPCR analyses of gene expression in wild-type BMSC before (D0) or after 7 days of differentiation (D7). (D) Alkaline phosphatase staining (top) and von Kossa staining (bottom) of normal (GFP) versus rictor-deficient (Cre) BMSC after 7 (D7) or 14 days of differentiation (D14). (E, F) qPCR analyses of gene expression in BMSC after 7-day differentiation. *p < 0.05, n = 3.
The finding above predicts that Rictor deletion may reduce bone mass in postnatal mice. To investigate this possibility, we examined RiCKO versus littermate control mice at 6 weeks of age. X-ray images showed that both the tibia and the femur remained shorter in RiCKO mice (Fig. 5A, B). Moreover, μCT imaging revealed that both outer and inner diameters of the femur diaphysis were smaller in the mutant than the WT (Fig. 5C). Quantitative μCT analyses in the femur showed that total cross-section area (Tt.Ar), cortical bone area (Ct.Ar), and cortical thickness (Ct.Th) were all reduced in the mutant by 27%, 32%, and 22%, respectively, even though the percentage of cortical bone area over total cross-section area (Ct.Ar/Tt.Ar) was not altered (Fig. 5D). In contrast to the cortical bone, the trabecular bone parameters did not change in the mutant (Fig. 5E, F). The decrease in cortical bone mass was likely a result of impaired osteoblast activity, because dynamic histomorphometry demonstrated a significant decrease in MAR, but no change in the percentage of mineralizing surface over total bone surface (MS/BS), at both the periosteal and endosteal surface in femurs of RiCKO mice (Fig. 6A). As a result, the bone formation rate (BFR/BS) was significantly reduced at both surfaces in the mutant. A similar decrease in MAR and BFR/MS was observed in trabecular bone with no change in MS/BS or osteoblast number, but this was concurrent with a decrease in osteoclast number, likely explaining the relatively normal trabecular bone mass (Fig. 6B, C). Histology also revealed that the RiCKO mice possessed less bone marrow fat at 6 weeks of age (Fig. 6D). In keeping with fewer osteoclasts in trabecular bone, the serum level of CTX-I, a cleavage product of type I collagen reflecting total bone resorption activity, was reduced in the RiCKO mice (Fig. 6E). Consistent with an overall decrease in bone formation, the mutant mice exhibited a significant reduction in the serum level of procollagen type 1 N propeptide (P1NP) (Fig. 6F). Overall, mTORC2 signaling is necessary for optimal bone accrual in postnatal mice.
Fig. 5.
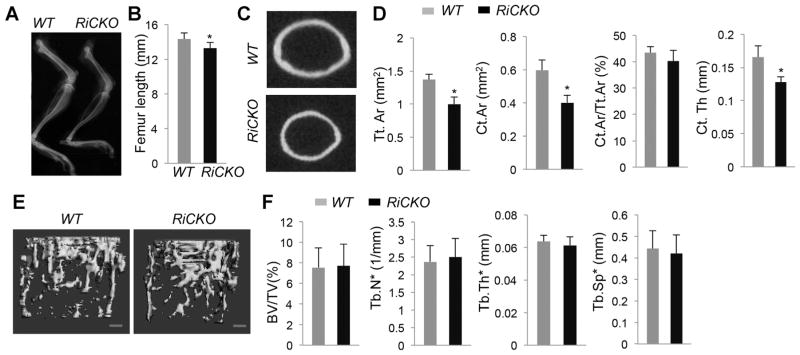
mTORC2 signaling is necessary for optimal bone accrual in postnatal mice. (A) Representative X-ray images of hindlimbs at 6 weeks of age. (B) Femur lengths. *p < 0.05, n = 5. (C) Representative images of μCT slice at mid-point of femur shaft. (D) Cortical bone parameters by μCT. *p < 0.05, n = 5. (E) μCT 3D reconstruction of trabecular bone in distal femur. Scale bar 100 μm. (F) Trabecular bone parameters in distal femur by μCT. n = 5.
Fig. 6.

mTORC2 augments anabolic bone formation. (A) Dynamic histomorphometry of cortical bone in femur. (B) Dynamic histomorphometry of trabecular bone in femur. Data from secondary ossification center of distal femur. (C) Osteoclast or osteoblast number normalized to trabecular bone surface in primary ossification center of proximal tibia. (D) Assessment of bone marrow adiposity. Left: representative H&E sections of distal tibia. Right: quantification of adipocytes, with each data point representing average of two medial sections from one mouse, average and SD shown for four mice per genotype. (E) Serum CTX-I assay. (F) Serum PINP assay. *p < 0.05, n = 4. E = endosteal surface; P = periosteal surface; Oc = osteoclast; OB = osteoblast.
mTORC2 mediates bone anabolic response to mechanical stress
The suboptimal bone accrual rate in postnatal RiCKO mice implies that the mutant bones may exhibit a lesser anabolic response to mechanical stress, a primary stimulus for bone formation. To test this hypothesis, we subjected the tibia of 4-month-old mice to axial loading. In vivo μCT analyses before loading indicated that the cortical bone size and thickness remained smaller in the RiCKO mice at this age (Fig. 7A). Similar to the younger mice, these animals did not show a change in trabecular bone mass when compared to the littermate controls (Fig. S2). As expected from the smaller size, strain-gauge analyses revealed that the mutant tibia required less force to produce the same strain at the mid-diaphyseal surface (Supporting Fig. S3). In this study, we selected a peak compression strain of −2200 με, which required an axial loading of 5.6 N in the RiCKO mice but 8 N in the WT littermates. Dynamic histomorphometry showed that loading similarly increased MS/BS at the periosteal surface in both genotypes (minimal changes at the endosteal surface) (Fig. 7B). However, loading induced a significantly lesser MAR response at the periosteal surface in the RiCKO mice compared to the WT littermates (Fig. 7C). Consequently, loading-induced BFR at the periosteal surface was significantly reduced in the RiCKO mice (Fig. 7D). Consistent with the lesser BFR response, post-loading μCT scan revealed that the loading-induced increase in cortical tissue volume or bone volume was reduced in the RiCKO mice, although the latter parameter did not reach statistical significance (data not shown). Overall, mTORC2 activity in bone is necessary for the normal anabolic response to mechanical stimuli.
Fig. 7.

mTORC2 mediates bone anabolic response to mechanical stress. (A) VivaCT analyses at 4 months of age before loading. *p < 0.05, n = 5. (B–D) Relative (r) changes in dynamic histomorphometric parameters between loaded and non-loaded tibias at the tibial mid-diaphysis. *p < 0.05, n = 4. E = endosteal surface; P = periosteal surface.
Discussion
We have uncovered Rictor as an important regulator of limb skeletal growth and bone formation in mice. Targeted deletion of Rictor, an essential component of mTORC2, in the limb mesenchyme, delays chondrocyte hypertrophy and shortens the long bones. Moreover, Rictor is necessary for optimal cortical bone accrual in postnatal life, both under basal conditions and in response to experimental mechanical loading. Thus, Rictor-mediated mTORC2 signaling plays important roles in both chondrocytes and osteoblasts.
It is worth noting that Rictor deletion also reduces the width of the long bones. The width deficit is noticeable in the cartilage anlage prior to the onset of hypertrophy, and persists throughout the life of RiCKO mice. How mTORC2 controls cartilage width is not understood at present, but it does not seem to involve changes in the overall chondrocyte proliferation or survival. It is possible that mTORC2 affects the dimension of the initial mesenchymal condensations, but future studies are necessary to test this possibility. Moreover, we cannot rule out that Rictor may perform other functions beyond mTORC2 to contribute to the phenotype.
The study identifies distinct roles for mTORC2 from mTORC1 in the skeleton. Previously, deletion of the mTORC1-specific Raptor with Prx1-Cre caused severe skeletal dysplasia, mainly due to impaired protein synthesis in chondrocytes.(38) The severity of cartilage phenotype and neonatal lethality in those mice precluded a detailed analysis of bone formation. Here we show that loss of Rictor and mTORC2 signaling only modestly affects cartilage development. Studies of the postnatal mice allowed us to uncover the role of mTORC2 in osteoblasts. The precise role of mTORC1 in normal bone formation warrants further study. We previously showed that mTORC1 contributed to the hyperactive osteoblast activity in response to Wnt overexpression, but appeared to be dispensable for basal bone formation when Raptor was deleted for 3 weeks beginning at 1 month of age.(39) While this paper was under preparation, others reported that osteoblast-specific deletion of mTOR decreased trabecular bone mass, whereas hyperactivation of mTORC1 through TSC2 deletion led to excessive production of immature osteoblasts.(40) Future studies to delete mTORC1 specifically in the osteoblast lineage will provide additional insights about its role in bone formation.
We find that Rictor is necessary for normal osteoblast activity. Although the bone formation rate is lower in both cortical and trabecular compartments, reduced bone mass is only seen in the cortex of the mutant bones. This is likely a result of the concurrent decrease in osteoclast number in the trabecular bone. The osteoclast defect appears to be secondary to Rictor deficiency in the osteoblast lineage, because the Rictor-deficient cells express less Rankl. Thus, Rictor in osteoblast-lineage cells not only enhances osteoblast activity directly, but also promotes osteoclastogenesis indirectly.
It is somewhat surprising that osteoblast numbers were not reduced in the RiCKO mice, given that Rictor-deficient BMSCs were impaired in osteoblast differentiation in vitro. It is possible that other mechanisms may compensate for mTORC2 deficiency in vivo. Our in vitro results are consistent with those from a previous study in which Rictor was knocked down with siRNA in marrow-derived mesenchymal stem cells.(8) In that study, the authors suggested that mTORC2 regulates cell-lineage selection in favor of osteoblasts over adipocytes. Such a model would predict greater marrow adiposity in the RiCKO mice, but we observed fewer bone marrow adipocytes instead. Thus, mTORC2 appears to be required for proper bone marrow adipogenesis in vivo.
A major finding of the present work is that mTORC2 as a necessary mediator for the anabolic response to mechanical loading. The adaptive response of bone to mechanical loading has been long recognized. Loss of skeletal loading due to intrauterine neuromuscular diseases in humans is known to diminish bone size and strength at birth.(41) Conversely, the playing arms of tennis players develop larger bones than the nonplaying arms.(42) More recent studies in rodents have identified Wnt signaling as an important mechanoresponsive mechanism.(43) Mice lacking the Wnt co-receptor Lrp5 are severely impaired in bone anabolic response to loading.(44) Furthermore, loading markedly suppresses production of the secreted Wnt antagonist Sost by osteocytes.(20) Finally, we have recently shown that Wnt-Lrp5 signaling activates mTORC2 to promote glycolysis.(7) Thus, the Sost-Wnt-mTORC2 signaling axis may be a major mechanism responsible for the bone anabolic response to loading. Further elucidation of the molecular events downstream of mTORC2 may open avenues for developing novel anabolic strategies mimicking mechanical loading.
Supplementary Material
Acknowledgments
We thank Dr. Jeffery Arbeit (Washington University) for providing the Rictorf/f mice. The work is supported by NIH grants R01 AR060456, R01 AR055923 (FL), R01 047867 (MS), T32 AR060719 (NH), and P30 AR057235 (Washington University Musculoskeletal Research Center).
Footnotes
Disclosures
All authors state that they have no conflicts of interest.
Additional Supporting Information may be found in the online version of this article.
References
- 1.Laplante M, Sabatini DM. mTOR signaling in growth control and disease. Cell. 2012;149(2):274–93. doi: 10.1016/j.cell.2012.03.017. [DOI] [PMC free article] [PubMed] [Google Scholar]
- 2.Sarbassov DD, Guertin DA, Ali SM, Sabatini DM. Phosphorylation and regulation of Akt/PKB by the rictor-mTOR complex. Science. 2005 Feb 18;307(5712):1098–101. doi: 10.1126/science.1106148. [DOI] [PubMed] [Google Scholar]
- 3.Garcia-Martinez JM, Alessi DR. mTOR complex 2 (mTORC2) controls hydrophobic motif phosphorylation and activation of serum- and glucocorticoid-induced protein kinase 1 (SGK1) Biochem J. 2008;416(3):375–85. doi: 10.1042/BJ20081668. [DOI] [PubMed] [Google Scholar]
- 4.Jacinto E, Loewith R, Schmidt A, et al. Mammalian TOR complex 2 controls the actin cytoskeleton and is rapamycin insensitive. Nat Cell Biol. 2004;6(11):1122–8. doi: 10.1038/ncb1183. [DOI] [PubMed] [Google Scholar]
- 5.Sarbassov DD, Ali SM, Kim DH, et al. Rictor, a novel binding partner of mTOR, defines a rapamycin-insensitive and raptor-independent pathway that regulates the cytoskeleton. Curr Biol. 2004;14(14):1296–302. doi: 10.1016/j.cub.2004.06.054. [DOI] [PubMed] [Google Scholar]
- 6.Hagiwara A, Cornu M, Cybulski N, et al. Hepatic mTORC2 activates glycolysis and lipogenesis through Akt, glucokinase, and SREBP1c. Cell Metab. 2012;15(5):725–38. doi: 10.1016/j.cmet.2012.03.015. [DOI] [PubMed] [Google Scholar]
- 7.Esen E, Chen J, Karner CM, Okunade AL, Patterson BW, Long F. WNT-LRP5 signaling induces Warburg effect through mTORC2 activation during osteoblast differentiation. Cell Metab. 2013;17(5):745–55. doi: 10.1016/j.cmet.2013.03.017. [DOI] [PMC free article] [PubMed] [Google Scholar]
- 8.Sen B, Xie Z, Case N, et al. mTORC2 regulates mechanically induced cytoskeletal reorganization and lineage selection in marrow-derived mesenchymal stem cells. J Bone Miner Res. 2014;29(1):78–89. doi: 10.1002/jbmr.2031. [DOI] [PMC free article] [PubMed] [Google Scholar]
- 9.Xian L, Wu X, Pang L, et al. Matrix IGF-1 maintains bone mass by activation of mTOR in mesenchymal stem cells. Nat Med. 2012;18(7):1095–101. doi: 10.1038/nm.2793. [DOI] [PMC free article] [PubMed] [Google Scholar]
- 10.Long F. Building strong bones: molecular regulation of the osteoblast lineage. Nat Rev Mol Cell Biol. 2012;13(1):27–38. doi: 10.1038/nrm3254. [DOI] [PubMed] [Google Scholar]
- 11.Fulzele K, Riddle RC, DiGirolamo DJ, et al. Insulin receptor signaling in osteoblasts regulates postnatal bone acquisition and body composition. Cell. 2010;142(2):309–19. doi: 10.1016/j.cell.2010.06.002. [DOI] [PMC free article] [PubMed] [Google Scholar]
- 12.Long F, Ornitz DM. Development of the endochondral skeleton. Cold Spring Harb Perspect Biol. 2013;5(1):a008334. doi: 10.1101/cshperspect.a008334. [DOI] [PMC free article] [PubMed] [Google Scholar]
- 13.Maes C, Kobayashi T, Selig MK, et al. Osteoblast precursors, but not mature osteoblasts, move into developing and fractured bones along with invading blood vessels. Dev Cell. 2010;19(2):329–44. doi: 10.1016/j.devcel.2010.07.010. [DOI] [PMC free article] [PubMed] [Google Scholar]
- 14.Niziolek PJ, Farmer TL, Cui Y, Turner CH, Warman ML, Robling AG. High-bone-mass-producing mutations in the Wnt signaling pathway result in distinct skeletal phenotypes. Bone. 2011;49(5):1010–9. doi: 10.1016/j.bone.2011.07.034. [DOI] [PMC free article] [PubMed] [Google Scholar]
- 15.Li X, Ominsky MS, Niu QT, et al. Targeted deletion of the sclerostin gene in mice results in increased bone formation and bone strength. J Bone Miner Res. 2008;23(6):860–9. doi: 10.1359/jbmr.080216. [DOI] [PubMed] [Google Scholar]
- 16.Cui Y, Niziolek PJ, Macdonald BT, et al. Lrp5 functions in bone to regulate bone mass. Nat Med. 2011;17(6):684–91. doi: 10.1038/nm.2388. [DOI] [PMC free article] [PubMed] [Google Scholar]
- 17.Lynch ME, Main RP, Xu Q, et al. Tibial compression is anabolic in the adult mouse skeleton despite reduced responsiveness with aging. Bone. 2011;49(3):439–46. doi: 10.1016/j.bone.2011.05.017. [DOI] [PMC free article] [PubMed] [Google Scholar]
- 18.Hsieh YF, Turner CH. Effects of loading frequency on mechanically induced bone formation. J Bone Miner Res. 2001;16(5):918–24. doi: 10.1359/jbmr.2001.16.5.918. [DOI] [PubMed] [Google Scholar]
- 19.Brodt MD, Silva MJ. Aged mice have enhanced endocortical response and normal periosteal response compared with young-adult mice following 1 week of axial tibial compression. J Bone Miner Res. 2010;25(9):2006–15. doi: 10.1002/jbmr.96. [DOI] [PMC free article] [PubMed] [Google Scholar]
- 20.Robling AG, Niziolek PJ, Baldridge LA, et al. Mechanical stimulation of bone in vivo reduces osteocyte expression of Sost/sclerostin. J Biol Chem. 2008;283(9):5866–75. doi: 10.1074/jbc.M705092200. [DOI] [PubMed] [Google Scholar]
- 21.Tu X, Rhee Y, Condon KW, et al. Sost downregulation and local Wnt signaling are required for the osteogenic response to mechanical loading. Bone. 2012;50(1):209–17. doi: 10.1016/j.bone.2011.10.025. [DOI] [PMC free article] [PubMed] [Google Scholar]
- 22.Logan M, Martin JF, Nagy A, Lobe C, Olson EN, Tabin CJ. Expression of Cre recombinase in the developing mouse limb bud driven by a Prxl enhancer. Genesis. 2002;33(2):77–80. doi: 10.1002/gene.10092. [DOI] [PubMed] [Google Scholar]
- 23.Shiota C, Woo JT, Lindner J, Shelton KD, Magnuson MA. Multiallelic disruption of the rictor gene in mice reveals that mTOR complex 2 is essential for fetal growth and viability. Dev Cell. 2006;11(4):583–9. doi: 10.1016/j.devcel.2006.08.013. [DOI] [PubMed] [Google Scholar]
- 24.McLeod MJ. Differential staining of cartilage and bone in whole mouse fetuses by Alcian Blue and Alizarin Red S. Teratology. 1980;22(3):299–301. doi: 10.1002/tera.1420220306. [DOI] [PubMed] [Google Scholar]
- 25.Long F, Zhang XM, Karp S, Yang Y, McMahon AP. Genetic manipulation of hedgehog signaling in the endochondral skeleton reveals a direct role in the regulation of chondrocyte proliferation. Development. 2001;128(24):5099–108. doi: 10.1242/dev.128.24.5099. [DOI] [PubMed] [Google Scholar]
- 26.Long F, Chung UI, Ohba S, McMahon J, Kronenberg HM, McMahon AP. Ihh signaling is directly required for the osteoblast lineage in the endochondral skeleton. Development. 2004;131(6):1309–18. doi: 10.1242/dev.01006. [DOI] [PubMed] [Google Scholar]
- 27.Hu H, Hilton MJ, Tu X, Yu K, Ornitz DM, Long F. Sequential roles of Hedgehog and Wnt signaling in osteoblast development. Development. 2005;132(1):49–60. doi: 10.1242/dev.01564. [DOI] [PubMed] [Google Scholar]
- 28.Joeng KS, Long F. The Gli2 transcriptional activator is a crucial effector for Ihh signaling in osteoblast development and cartilage vascularization. Development. 2009;136(24):4177–85. doi: 10.1242/dev.041624. [DOI] [PMC free article] [PubMed] [Google Scholar]
- 29.Chen J, Long F. beta-catenin promotes bone formation and suppresses bone resorption in postnatal growing mice. J Bone Miner Res. 2013;28(5):1160–9. doi: 10.1002/jbmr.1834. [DOI] [PMC free article] [PubMed] [Google Scholar]
- 30.Bouxsein ML, Boyd SK, Christiansen BA, Guldberg RE, Jepsen KJ, Muller R. Guidelines for assessment of bone microstructure in rodents using micro-computed tomography. J Bone Miner Res. 2010;25(7):1468–86. doi: 10.1002/jbmr.141. [DOI] [PubMed] [Google Scholar]
- 31.Retting KN, Song B, Yoon BS, Lyons KM. BMP canonical Smad signaling through Smad1 and Smad5 is required for endochondral bone formation. Development. 2009;136(7):1093–104. doi: 10.1242/dev.029926. [DOI] [PMC free article] [PubMed] [Google Scholar]
- 32.Thoreen CC, Chantranupong L, Keys HR, Wang T, Gray NS, Sabatini DM. A unifying model for mTORC1-mediated regulation of mRNA translation. Nature. 2012;485(7396):109–13. doi: 10.1038/nature11083. [DOI] [PMC free article] [PubMed] [Google Scholar]
- 33.Tu X, Joeng KS, Nakayama KI, et al. Noncanonical Wnt signaling through G protein-linked PKCdelta activation promotes bone formation. Dev Cell. 2007;12(1):113–27. doi: 10.1016/j.devcel.2006.11.00. [DOI] [PMC free article] [PubMed] [Google Scholar]
- 34.Katagiri T, Yamaguchi A, Komaki M, et al. Bone morphogenetic protein-2 converts the differentiation pathway of C2C12 myoblasts into the osteoblast lineage. J Cell Biol. 1994;127(6 Pt 1):1755–66. doi: 10.1083/jcb.127.6.1755. [DOI] [PMC free article] [PubMed] [Google Scholar]
- 35.Lynch ME, Main RP, Xu Q, et al. Cancellous bone adaptation to tibial compression is not sex dependent in growing mice. J Appl Physiol. 2010;109(3):685–91. doi: 10.1152/japplphysiol.00210.2010. [DOI] [PMC free article] [PubMed] [Google Scholar]
- 36.Holguin N, Brodt MD, Sanchez ME, Kotiya AA, Silva MJ. Adaptation of tibial structure and strength to axial compression depends on loading history in both C57BL/6 and BALB/c mice. Calcif Tissue Int. 2013;93(3):211–21. doi: 10.1007/s00223-013-9744-4. [DOI] [PMC free article] [PubMed] [Google Scholar]
- 37.Dempster DW, Compston JE, Drezner MK, et al. Standardized nomenclature, symbols, and units for bone histomorphometry: a 2012 update of the report of the ASBMR Histomorphometry Nomenclature Committee. J Bone Miner Res. 2013;28(1):2–17. doi: 10.1002/jbmr.1805. [DOI] [PMC free article] [PubMed] [Google Scholar]
- 38.Chen J, Long F. mTORC1 signaling controls mammalian skeletal growth through stimulation of protein synthesis. Development. 2014;141(14):2848–54. doi: 10.1242/dev.108811. [DOI] [PMC free article] [PubMed] [Google Scholar]
- 39.Chen J, Tu X, Esen E, et al. WNT7B promotes bone formation in part through mTORC1. PLoS Genet. 2014;10(1):e1004145. doi: 10.1371/journal.pgen.1004145. [DOI] [PMC free article] [PubMed] [Google Scholar]
- 40.Riddle RC, Frey JL, Tomlinson RE, et al. Tsc2 is a molecular checkpoint controlling osteoblast development and glucose homeostasis. Mol Cell Biol. 2014;34(10):1850–62. doi: 10.1128/MCB.00075-14. [DOI] [PMC free article] [PubMed] [Google Scholar]
- 41.Rodriguez JI, Palacios J, Garcia-Alix A, Pastor I, Paniagua R. Effects of immobilization on fetal bone development. A morphometric study in newborns with congenital neuromuscular diseases with intrauterine onset. Calcif Tissue Int. 1988;43(6):335–9. doi: 10.1007/BF02553275. [DOI] [PubMed] [Google Scholar]
- 42.Jones HH, Priest JD, Hayes WC, Tichenor CC, Nagel DA. Humeral hypertrophy in response to exercise. J Bone Joint Surg. 1977;59(2):204–8. [PubMed] [Google Scholar]
- 43.Robling AG, Turner CH. Mechanical signaling for bone modeling and remodeling. Crit Rev Eukaryot Gene Expr. 2009;19(4):319–38. doi: 10.1615/critreveukargeneexpr.v19.i4.50. [DOI] [PMC free article] [PubMed] [Google Scholar]
- 44.Sawakami K, Robling AG, Ai M, et al. The Wnt co-receptor LRP5 is essential for skeletal mechanotransduction but not for the anabolic bone response to parathyroid hormone treatment. J Biol Chem. 2006;281(33):23698–711. doi: 10.1074/jbc.M601000200. [DOI] [PubMed] [Google Scholar]
Associated Data
This section collects any data citations, data availability statements, or supplementary materials included in this article.