

Summary
Activation-induced cytidine deaminase (AID) initiates both somatic hypermutation (SHM) for antibody affinity maturation and DNA breakage for antibody class switch recombination (CSR) via transcription-dependent cytidine deamination of single stranded DNA targets. While largely specific for immunoglobulin genes, AID also acts on a limited set of off-targets, generating oncogenic translocations and mutations that contribute to B cell lymphoma. How AID is recruited to off-targets has been a long-standing mystery. Based on deep GRO-Seq studies of mouse and human B lineage cells activated for CSR or SHM, we report that most robust AID off-target translocations occur within highly focal regions of target genes in which sense and antisense transcription converge. Moreover, we found that such AID-targeting “convergent” transcription arises from antisense transcription that emanates from Super-Enhancers within sense transcribed gene bodies. Our findings provide an explanation for AID off-targeting to a small subset of mostly lineage-specific genes in activated B cells.
Introduction
The B cell antigen receptor (“BCR”) is comprised of immunoglobulin (Ig) heavy (IgH) and light (IgL) chains. In response to antigen activation, B lymphocytes in peripheral lymphoid organs undergo somatic hypermutation (SHM) and IgH class switch recombination (CSR), and ultimately secrete their BCR as an antibody. SHM diversifies antibody repertoires by introducing high-frequency mutations into IgH and IgL variable region exons (Di Noia and Neuberger, 2007). SHM occurs in germinal centers (GCs) of peripheral lymphoid tissues, where B cells are selected for mutations that generate BCRs with increased antigen affinity (Victora and Nussenzweig, 2012). IgH CSR involves generation and joining of IgH locus DSBs in switch (S) regions that precede various sets of IgH CH exons (“CHs”) to replace the initially expressed CH with a downstream CH, thereby, producing antibodies with different effector functions (Matthews et al., 2014). Both SHM and CSR are initiated by activation induced cytidine deaminase (AID) (Muramatsu et al., 2000), which deaminates cytosine to uridine on single-stranded DNA (ssDNA) (Di Noia and Neuberger, 2007). Mismatches created by these deaminated cytidines are processed into mutations or DSBs during SHM and CSR, respectively, through a process that employs activities of normal base excision or mismatch repair pathways (Di Noia and Neuberger, 2007).
Within target sequences, AID cytidine deamination focuses on 3-4bp “SHM” motifs that are greatly enriched in S regions and in portions of variable region exons that encode antigen-binding sites (Di Noia and Neuberger, 2007). Transcription is required for AID targeting during SHM and CSR (Alt et al., 2013; Storb, 2014). In this regard, SHM of V(D)J exons in GC B cells begins about 150bp downstream of the transcription start site (TSS) and tapers off 1-2 kb downstream (Liu and Schatz, 2009). Likewise, each CH has a promoter upstream of the S region that upon induction by external signals generates transcription through the S region and, thereby, targets AID (Matthews et al., 2014). Mouse and human S regions also have a highly G-rich non-template strand that upon transcription forms stable R-loops that provide ssDNA to augment AID targeting (Matthews et al., 2014; Alt et al., 2013). RNA polymerase II (Pol II) has been implicated in directing AID to Ig gene SHM and CSR targets through a transcription coupled mechanism (Storb, 2014) that involves AID association with the Spt5 transcription cofactor in the context of Pol II stalling (Pavri et al., 2010). R loops or other aspects of repetitive S region structure may augment AID access by promoting Pol II stalling (Rajagopal et al., 2009; Wang et al., 2009). Once AID is recruited to Ig targets, replication protein A (RPA) and the RNA exosome RNA degradation complex contribute to generating requisite ssDNA substrates (Basu et al., 2011; Matthews et al., 2014: Pefanis et al., 2014).
Beyond Ig gene targets, AID initiates recurrent mutations or DSBs in a small subset of non-Ig genes collectively termed AID “off-target” genes (Pasqualucci et al., 2001; Chiarle et al., 2011; Klein et al., 2011; Liu et al., 2008). Off-target AID activity promotes translocations between Ig loci and cellular oncogenes, as well as SHMs of oncogenes associated with B cell lymphomas (Alt et al., 2013; Kuppers and Dalla-Favera, 2001). Identification of AID off-targets has been facilitated by genome-wide translocation cloning methods (Chiarle et al., 2011; Klein et al., 2011) and other large-scale approaches (Liu et al., 2008; Yamane et al., 2011). In general, AID activity occurs at much lower levels on off-targets than on Ig genes (Liu and Schatz, 2009; Yamane et al., 2011; Chiarle et al., 2011; Klein et al., 2011), likely due to specialized AID-targeting features of the latter. AID off-target sequences are not enriched in AID hotspot motifs relative to the genome in general (Duke et al., 2013). Consistent with a role for transcription, AID off-target activity is most abundant on transcribed genes downstream of their TSSs (Pasqualucci et al., 2001; Liu et al., 2008; Chiarle et al., 2011; Klein et al., 2011). However, transcription per se is not sufficient to target AID, as most transcribed genes are not AID off-targets (Alt et al., 2013; Liu and Schatz, 2009). Next-generation sequencing studies revealed unexpected transcriptional features, including divergent sense and antisense transcription at TSSs (Wu and Sharp, 2013; Adelman and Lis, 2012) and frequent promoter proximal Pol II pausing (Adelman and Lis, 2012). But, divergent transcription (“DivT”) from TSSs occurs in over half of all genes and generally does not map directly to sites of AID off-target activity (Chiarle et al., 2011; see below). Likewise, transcriptional pausing alone cannot explain AID off-targeting, since more than 30% of transcribed genes have paused Pol II (Adelman and Lis, 2012). Thus, mechanisms that lead to recurrent AID targeting may arise from previously unrecognized transcriptional or epigenetic determinants (Alt et al., 2013).
Global Run-on Sequencing (GRO-Seq) detects nascent transcripts generated by transcriptionally engaged RNA polymerases (Core et al., 2008). GRO-Seq revealed that a large fraction of intergenic regions are transcribed, with a subset emanating from transcriptional enhancers (Wang et al., 2011). Enhancers are sequence-defined, cis-regulatory elements that influence target gene expression irrespective of orientation (Levine et al., 2014). Both enhancers within genes (intragenic) and intergenic enhancers may regulate target promoters locally and over long distances (Levine et al., 2014). Active enhancer sequences are commonly transcribed by RNA Pol II generating so-called “enhancer RNAs (eRNAs)”; and transcription arising from enhancers is often divergent, with both sense and antisense transcription emanating from enhancer elements (Natoli and Andrau, 2012; Wang et al., 2011). Various regulatory functions have been ascribed to eRNAs and other non-coding RNAs (Lam et al., 2014): however, much of non-coding RNA biology is not fully understood.
Enhancers are comprised of discrete or clustered transcription factor binding sequences. A common feature of active enhancers is chromatin that is characteristically modified by acetylation (e.g. histone 3 lysine 27; H3K27Ac) and methylation (e.g. histone 3 lysine 4 mono-methylation; H3K4me1) (Creyghton et al., 2010). An unexpected asymmetry in the regional allocation of enhancer factors and enrichment for enhancer marks within and unique to each mammalian cell type studies revealed a subset of so-called super-enhancers (SEs) that feature clusters of highly hyperacetylated and actively transcribed enhancers that, on average, are 10-fold longer than other “typical” enhancers (Whyte et al., 2013; Loven et al., 2013). Like locus control regions, SEs regulate genes involved in specialized cellular function (Parker et al., 2013) and are found within or adjacent to lineage-specifying transcription factor genes (Whyte et al., 2013; Hnisz et al., 2013). In cancer, SEs frequently enforce oncogene expression (Loven et al., 2013) and, thereby, contribute to tumor pathogenesis. For example, translocations that juxtapose c-myc to the IgH 3′ regulatory region, a known SE (Delmore et al., 2011; Chapuy et al., 2013), promote B cell lymphoma by activating c-myc over long distances (Gostissa et al., 2009). In this context, selectively blocking SE activity with bromodomain and extra-terminal domain (BET) inhibitors is a promising cancer therapeutic strategy (Delmore et al., 2011; Loven et al., 2013; Chapuy et al., 2013).
Here, we report that the majority of detectable AID off-target activity in a variety of mouse and human lymphoid or non-lymphoid cell types occurs within focal regions of overlapping sense/anti-sense transcription within intragenic SEs.
Results
Deep GRO-Seq Transcription Profiles of Naïve, GC and CSR-activated B Cells
To elucidate transcriptional features that influence AID targeting genome-wide, we applied GRO-Seq to splenic naïve, GC and CSR-activated B cells at much greater depth than done previously. Naïve splenic B cells were purified (Figure S1A) and then cultured in the presence of αCD40 plus interleukin-4 (IL4) for 60 hours to stimulate AID induction and CSR to IgG1 and IgE (Figure S1A). Splenic GC B cells were purified from sheep red blood cell immunized mice (Figure S1A) and confirmed to be greater than 90% pure (Figure S1B, C, D). Three independent GRO-Seq biological replicates were performed for each cell type and gave highly reproducible results (Figure S1E). Transcription profiles of over 20,000 genes revealed distinct (but overlapping) gene expression patterns for each cell types that were further classified by gene ontology terms (Figure S1G and Table S1). As expected (Core et al., 2008: Chiarle et al., 2011), GRO-Seq revealed divergent sense and anti-sense transcription at TSSs of over 50% of the genes in each of the three cell types (Figure 1&S1F). In depth examination of sense transcription profiles of several “signature” genes illustrates the specificity of purified cell populations. For example, Aicda sense transcription reflects AID protein expression in the three cell types, with high levels in GC B cells and activated B cells; but none detectable in naïve B cells (Figure 1). In contrast, several GC B cell-specific genes, including SLIP-GC (Richter et al., 2009) and Bcl6 (Basso and Dalla-Favera, 2010), had high sense transcription through their gene bodies in GC B cells, but not in naïve or CSR-activated B cells (Figure 1). Finally, Bcl2, which is expressed in CSR-activated but not in GC B cells (Liu et al., 1991), showed corresponding sense transcription patterns (Figure 1).
Figure 1. GRO-Seq Profiles of Naïve, Germinal Center, and CSR-activated B Cells.
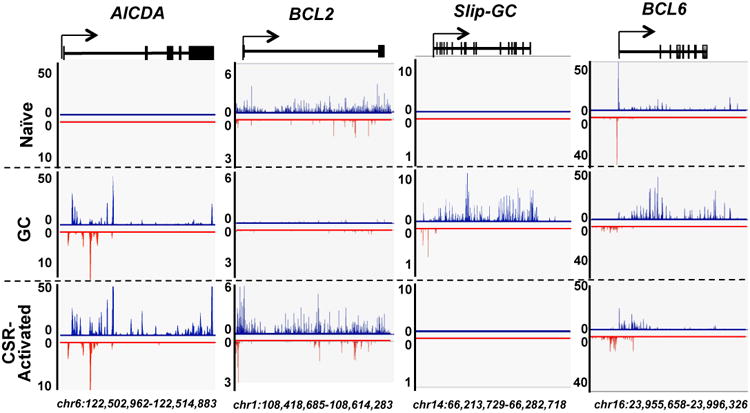
GRO-Seq profiles of four representative genes are shown for different B cell types. The Y-axis indicates GRO-Seq counts normalized to number of reads per million. Gene sense and antisense transcription are displayed in blue and red, respectively. Gene exons are illustrated by squares along gene bodies at the top of each panel. Arrows indicate TSSs and direction of sense transcription. Genome coordinates (mm9/NCBI37) are labeled at the bottom. All the profiles were generated from merged data of three independent experiments, which individually showed similar patterns. See also Figure S1 and Table S1.
While IgH CH exons were appropriately transcribed in the three cell populations (Figure S1H), transcription within core S regions could not be mapped due to their abundant repetitive sequence (Pavri et al., 2010). All analyzed mice had a clonal knock-in VH(D)JH exon (VHB1-8; Sonoda et al., 1997), which showed active transcription at its upstream regions in all three cell types (Figure S1H). However, detailed analyses of transcription through the body of the VHB1-8 allele was not possible (Figure S1H); because it uses a member of the VHJ558 family, which contains many highly related, unexpressed upstream copies (Brodeur and Riblet, 1984).
Enhanced Identification of AID Off-Target Sites in αCD40 plus IL4 Stimulated B Cells
We developed High-Throughput Genome-wide Translocation Sequencing (“HTGTS”) to map, at the nucleotide level, translocation junctions between bait I-SceI nuclease generated DSBs in c-myc and other endogenous DSBs (Chiarle et al., 2011). Identification of DSB hotspots from a fixed chromosomal site is facilitated by ability of recurrent DSBs to dominate genome-wide translocation landscapes due to cellular heterogeneity in three-dimensional genome organization (Zhang et al., 2012). Beyond expected Ig locus targets, our prior HTGTS studies revealed15 non-Ig genes that are recurrent targets of AID-initiated DSBs and translocations (Chiarle et al., 2011; Table S2). To increase the depth of HTGTS AID off-target data and allow better comparison with deeper GRO-Seq transcription profiles, we further employed a modified, more sensitive HTGTS approach (Frock et al., in press), coupled with Ataxia Telangiectasia Mutated (ATM)-deficient CSR-activated B cells (Hu et al., 2014). This combined approach identified highly clustered AID-dependent off-target DSB sites within 36 additional genes (Supplementary Methods, Table S2; Figure S2A). Overall, we now have identified 51 highly focal AID off-target DSB/translocation sites in αCD40 plus IL4-stimulated B cells (Table S2). Nearly 90% of the new off-target set was validated in WT B cells by HTGTS and/or by an independent method (Qian et al., in press; Supplementary Methods). As previously found for our more limited set of AID off-target sites (Chiarle et al., 2011), many of our new AID off targets occurred within genes that have divergently transcribed TSSs; but the focal sites of HTGTS junctions within them were downstream of and distinct from divergently transcribed TSSs (Chiarle et al., 2011; Figure 2). Thus, we were compelled to search for other factors that promote such focal AID off-targeting. As we found no enrichment for known AID targeting motifs in these regions (Supplementary Methods), we focused our search on potentially novel transcriptional and/or epigenetic features and, as described below, identified both.
Figure 2. AID Off-Target Translocations Cluster Within Regions of ConvT and SEs.
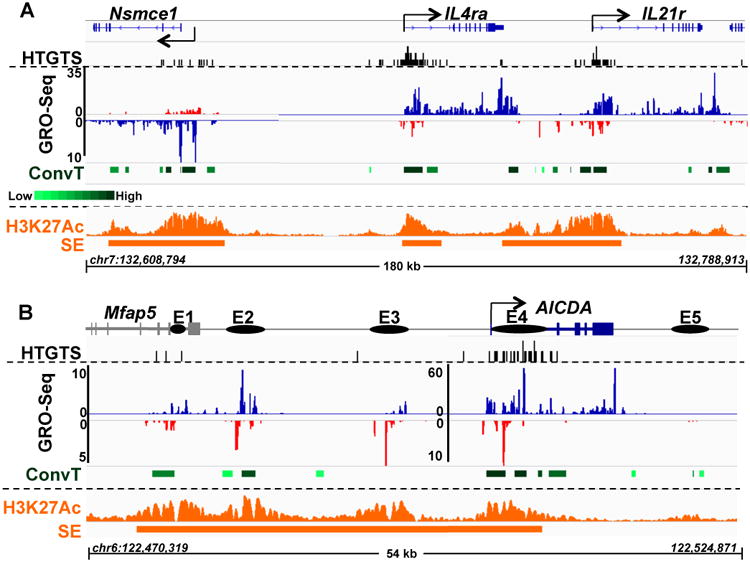
(A) HTGTS, GRO-Seq, ConvT and H3K27Ac profiles in the vicinity of Nsmce1, IL4ra, and IL21r genes. Top Panel: HTGTS junctions are indicated by black bars. Middle Panel (GRO-Seq): GRO-Seq-determined sense and antisense transcription is displayed in blue and red, respectively. ConvT regions are shown as green bars at the bottom with the darkest shades corresponding to highest levels of ConvT as calculated by the geometric means of sense and antisense transcription reads (see supplementary methods). A scale bar is shown below the ConvT label. Bottom Panel (H3K27Ac and SE): The H3K27Ac ChIP-Seq profile is shown in orange and identified SEs depicted below with orange bars. Nsmce1 TSS is manually curated based on GRO-Seq profile. (B) Profile of AICDA gene. Known AICDA enhancers are represented as E1-5 with solid circles. To represent lower level transcription of certain enhancers, a smaller scale is used for E1-3. Genome coordinates (mm9/NCBI37) are at the bottom of each panel. Other details are the same as for panel A. See also Figure S2 and Table S2.
AID Off-Targets Cluster at Sense/Antisense Transcription Sites Downstream of the TSS
With our present, substantially deeper, GRO-Seq data sets, we further analyzed potential relationships between sense/antisense transcription and AID off-target sites in αCD40 plus IL4 activated B cells. Initially, we visually inspected three linked AID off-target sites, including sites in the previously characterized IL4r and IL21r genes (Chiarle et al., 2011) and a newly identified site in Nsmce1. In each of these linked genes, HTGTS translocation junctions were tightly clustered in a region downstream of the TSS (Figure 2A). Moreover, in each, translocation clusters fell within sites that exhibited enriched, overlapping sense and antisense transcription to which we heretofore apply the term “convergent transcription” (ConvT) (Figure 2A and 3A). We also found a robust AID off-target site within the AID gene (“Aicda”) itself (Figure 2B; Table S2). Aicda is associated with five enhancers that lie upstream, within, or downstream of the gene body (Kieffer-Kwon et al., 2013; Matthews et al., 2014; Figure 2B). Four of these enhancers showed both sense and antisense transcription, likely at least in part in the context of generating eRNAs (Natoli and Andrau, 2012; Figure 2B). Notably, the major focal cluster of AID off-target sites in and around Aicda fell within a ConvT region associated with enhancer 4 downstream of the TSS (Figure 2B).
Figure 3. AID Off-targets Correlate with ConvT in CSR-activated B Cells.
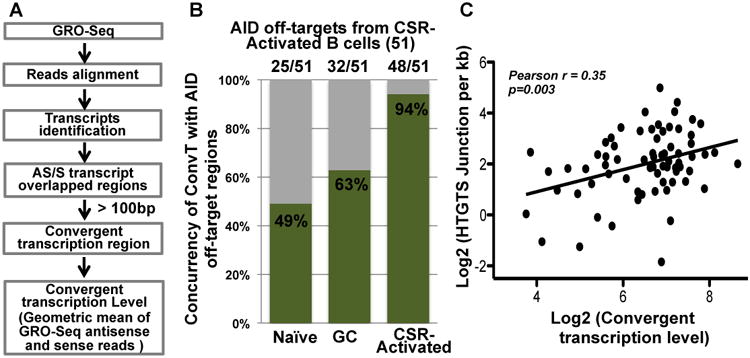
(A) Pipeline for identification of ConvT regions. Raw GRO-Seq reads were aligned to the genome and transcripts were identified de novo. A “ConvT” region was defined as sense and antisense transcription overlaps that were longer than 100bp. See supplementary methods for details. (B) The percentage of the 51 AID off-target regions identified in CSR-activated B cells that were associated with ConvT regions in the three listed cell populations is the indicated by the green bars. (D) Numbers of translocation junctions per kilobase (kb) (Y axis) plotted against ConvT levels (X axis) of all individual AID off-target regions except Pvt1 (see Supplementary Methods). Pearson's correlation coefficient and two-tailed p value are indicated. See also Figure S3.
Genome-Wide Association of ConvT and AID Off-Targets in CSR-activated B Cells
Visual inspection of AID off-target sites in additional genes revealed similar coincidence of regions of robust sense/antisense (“S/AS”) ConvT downstream of the TSS with focal clusters of AID-dependent off-target translocations (see below, Figure S2.), leading us to examine this potentially striking association genome-wide. While metagene profiles of GRO-Seq data from αCD40 plus IL4 activated B cells confirmed expected DivT at many TSSs (Wu and Sharp, 2013), they did not reveal similarly abundant convergent transcription (Figure S1F). Thus, at least at robust levels, convergent transcription likely occurs in a much smaller fraction of genes (Figure S1F). For further analyses, we developed a computational pipeline to specifically identify S/AS ConvT regions genome-wide using deep GRO-Seq data sets (Figure 3A and supplementary methods). Strikingly, among the 51 AID off-target genes, 48 (94%) had their highly clustered AID off-target translocations within regions associated with S/AS convergent transcription (Figure 3B). We randomly sampled convergent transcription of regions, in the top three transcription-level deciles, that were similar in size to those of AID off-target regions and found a much lower association with convergent transcription than for AID off-target regions (Figure S3A). This finding shows that AID off-targets are highly enriched at ConvT sites. Finally, concurrency between S/AS convergent transcription and AID off-target translocations was much higher in αCD40 plus IL4 activated B cells (94%) than in naïve (49%) or GC (63%) B cells, consistent the notion that not all AID off-targets would be shared among three cell types with overlapping, but clearly distinct, transcription profiles (Figure 3B and S3B; also see below).
To further examine the relationship between ConvT and AID targeting, we calculated the geometric mean of GRO-Seq sense and antisense transcription reads in regions of interest to quantify degree of convergent transcription (Supplementary Methods), and divided the values into deciles displayed by different shades of green bars below the GRO-Seq profiles (e.g. Figure 2, Figure S2; dark green is highest and light green lowest levels). For most AID off-targets, HTGTS junctions clustered in regions with the most abundant ConvT (e.g. Figure 2; Figure S2). Furthermore, ConvT associated with AID off-targets was substantially greater than that at other genomic loci (Figure S3C). In addition, within AID off-target ConvT regions, the highest density of translocations occurred at sites with the most robust ConvT (Figure 3C). We further evaluated this relationship by determining how variations in sequencing depth influenced identification of ConvT. Even with our current very deep sequencing depth (>306 million mappable reads), we did not reach saturation of the total length of ConvT regions (Figure S3D), consistent with (at least low-level) pervasive transcription of the genome (Jacquier, 2009). In contrast, we reached saturation of the concurrency of AID off-targets with ConvT regions at about 40% of our current GRO-Seq depth (120 million mappable reads; Figure S3D), confirming that most AID off-target DSB/translocation regions detectable by HTGTS in αCD40 plus IL4 stimulated B cells are associated with relatively strong convergent transcription (Figure 3C and S3D).
Convergent Transcription at AID off-targets Arises from Intragenic SEs
ConvT of overlapping genes was first described in bacteriophage lambda (Ward and Murray, 1979), and has been associated with transcriptional gene silencing (Gullerova and Proudfoot, 2012) and RNA Pol II collision (Hobson et al., 2012). Considering that intragenic antisense transcription associated with AID-off target sequences may arise from enhancer elements, we explored whether intragenic SEs were enriched for AID off-targets compared to typical enhancers. Enhancer regions were identified by triplicate chromatin immunoprecipitation with massively parallel genome sequencing (ChIP-Seq) using an antibody to the active enhancer histone mark H3K27Ac in chromatin purified from αCD40 plus IL4 stimulated B cells (Figure S4A). SEs were called based on outlier analysis for regions of asymmetric, high enrichment for H3K27Ac, as previously described (Whyte et al., 2013). We found the Aicda locus to be largely encompassed within a SE in CSR-activated B cells with robust H3K27Ac signals over E1, E2, E3 and E4 (Figure 2B), the active enhancers in CSR-activated B cells (Kieffer-Kwon et al., 2013; Matthews et al., 2014). Notably, E4 also corresponds in position to a cluster of HTGTS junctions and robust ConvT (Figure 2B). Likewise, the Nsmce1, IL4ra, Il21r, and many other AID off-target genes were each associated with SEs and again the peak of HTGTS junctions and regions of robust ConvT occurred within regions of robust H3K27Ac SE signals (Figure 2A; Figure S2).
We performed an unbiased association analysis between the 51 AID off-targets identified by HTGTS and the non-Ig 448 SEs that we identified in αCD40 plus IL4 activated B cells. These studies revealed that 50 of the 51 AID off-target genes in these cells are associated with SEs and that the discrete translocation clusters were within SEs (Figure 4A). Notably, the single AID off-target region not within SE (under the current cutoff for SE identification; Supplementary Methods) was in a typical enhancer (Table S2). In addition, 47 (92%) of the AID off-target translocation clusters were within regions of SEs that overlap with annotated gene bodies (Figure 4A). The other 3 HTGTS off-target translocation clusters occurred within transcribed regions of SEs that have not yet been assigned to a target gene (Table S3). As a comparison, random samplings of transcribed genomic regions corresponding in size to those of AID off-targets yielded at most three (6%) that overlapped with SEs. Independent analysis of the relationship between HTGTS hotspots and H3K27Ac ChIP-Seq using an orthogonal computational method identified 41 AID off-targets within SE domains (Figure S4C, D), including additional novel off-targets that correlated with robust ConvT (Supplementary Methods; Figure S2D; Table S2). Finally, within a given AID off-target region, translocation junction frequency highly correlated with H3K27Ac abundance (Figure S4B). In this regard, SEs associated with AID off-target sequences were more enriched for H3K27Ac, compared to other SEs (Figure 4B). Thus, the relative activity of SEs, estimated by regional histone acetylation, correlates with the frequency of AID off-targets within them.
Figure 4. AID Off-target ConvT Arising from Intragenic SEs.
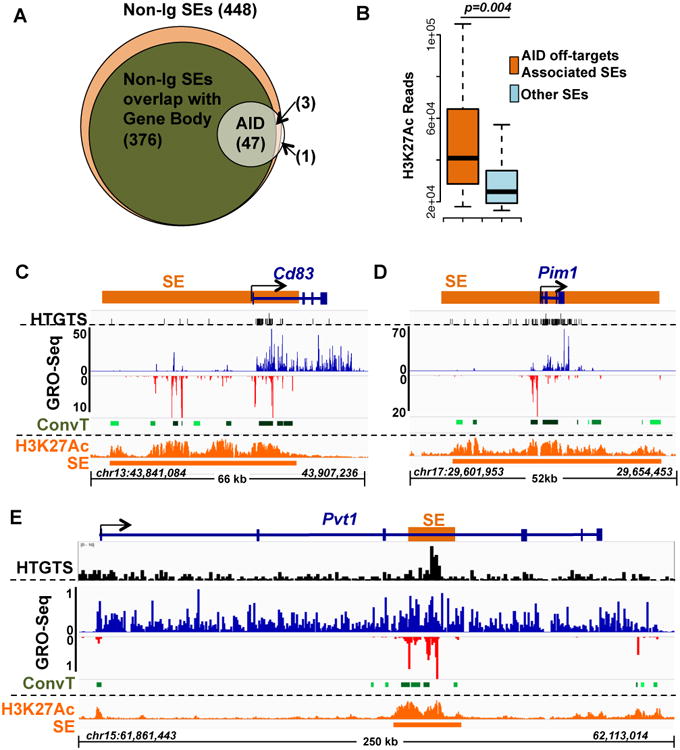
(A) Venn diagram showing the number of AID off-target regions that overlapped with total non-Ig SEs (448) and with non-Ig SEs overlapping with Gene Bodies (376). (B) H3K27Ac signals of AID off-target-associated SEs (orange) and the other SEs (cyan) are plotted. AID off-target associated SEs had a stronger H3K27Ac signal (Mann-Whitney U-test, p value =0.004). Representative AID off-targets are shown based on the SE location indicated in the diagram at the top of each panel. (C) Many AID targets locate downstream of TSSs where SEs and genes overlap. CD83 is shown as an example. (D) For some relatively small genes located within a larger SE, nearly the whole gene body is an AID off-target, as shown for Pim1. (E) SEs inside of very long genes, like Pvt1 also provide focal AID off-targets. HTGTS, GRO-Seq and H3K27Ac/SE data is illustrated for each panel as described in Figure 2A. The relatively high HTGTS background in Pvt1 results from long resections downstream of the HTGTS bait DSB in c-myc (Chiarle et al., 2011). See also Figure S4 and Table S3.
The majority (30 of 51) of the AID off-target genes had a SE that overlapped with the region just downstream of the TSS that was enriched in AID off-targets, as represented by the CD83 gene (Figure 4C; Figure S2). In addition, a number (12 of 51) of the AID targets were relatively small genes, such as Pim1, that were located within large SEs and, correspondingly, off-target translocations tended to span the gene body (Figure 4D; Figure S2). Several AID off-target genes (3 of 51) were large genes, such as Pvt1, the well-known translocation target downstream of c-myc, in which translocations clustered within SEs that occurred inside the gene body (Figure 4E). Finally, the remainder (6 of 51) fell into a heterogeneous set in which AID off-target translocations clustered into convergently transcribed SE domains that, for various reasons were not yet assignable to a specific gene (e.g. Gpr183; Figure S2C).
Intragenic SEs with Robust ConvT Represent the Most Common AID Off-targets
Nearly all AID off-target clusters identified by HTGTS in αCD40 plus IL4 activated B cells are associated with SEs; yet, only a subset of SEs are AID off-targets. Motivated by the putative contribution of S/AS eRNA transcription to translocation frequency, we compared regions of AID off-target genes where SEs overlap with the gene body (intragenic SEs) to regions where SEs lie outside the gene body (intergenic SEs) and to regions of gene bodies that do not overlap with SEs (“non-overlapping gene region”), for translocation density (translocations per 1kb; Figure 5A) and for ConvT levels (geometric means; Figure 5A). We observed that translocation junction density and ConvT levels in AID off-target regions are highly enriched among intragenic SEs compared to both intergenic SEs and non-overlapping gene regions (Figure 5A; upper). Despite this enrichment, only about 10% of all intragenic SEs in the CSR-activated B cells are AID off-targets (Figure 4A; Table S3) and other SE-gene overlap regions exist that are not enriched in AID off-target activity (Figure 5B; upper). Comparison of ConvT levels in each of the three regions outlined above (Figure 5A, B; lower panels) revealed that intragenic SEs featuring high levels of ConvT were more frequently AID off-target regions than intragenic SEs lacking high-level S/AS transcription (Figure 5A, B; lower panels).
Figure 5. Convergently Transcribed Intragenic SEs are Preferred AID off-targets.
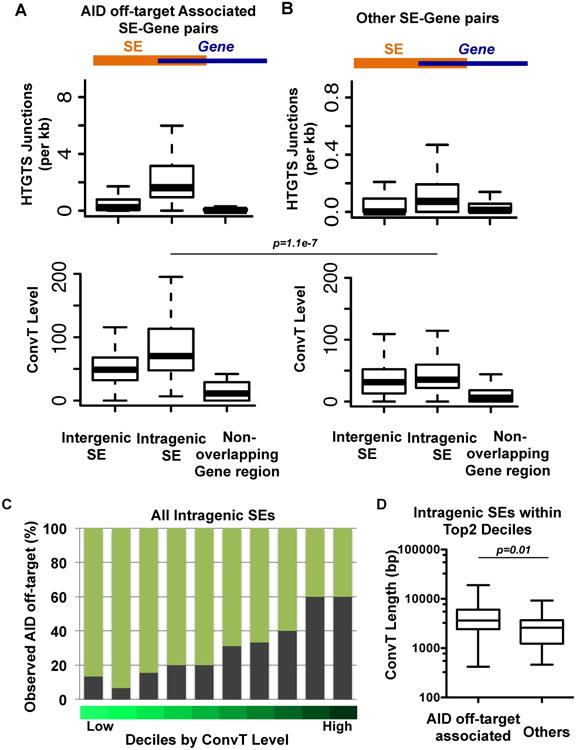
(A) Upper and Lower: Each SE associated with an AID off-target region and its overlapping gene body were divided into intergenic SEs, intragenic SEs, and non-overlapping gene regions as described in the text and outlined at the top of the Panels. For all AID off-targets, the number of translocation junctions per kb in each of the 3 regions (upper panel) and convergent transcription levels of each region (lower panel) are plotted. (B) Upper and Lower: Each SE that was not associated with an AID off-target region and its overlapping gene body were divided into regions as describe for panel C and translocation junction numbers per kb (upper panel) and convergent transcription levels (lower panel) plotted for each region. A Mann-Whitney U-test was performed to compare two classifications of SEs for convergent transcription ratios within each of the 3 regions; the only significant difference found was that the AID-off-target intragenic SEs has a significantly higher convergent transcription ratio than non-AID off-target intragenic SEs (p value =1.1e-7). (C) All intragenic SEs were grouped into deciles based on the ConvT levels. The fraction of AID off-targets in each decile is indicated by grey bar. (D) Intragenic SEs in the top 2 deciles are divided into those associated with AID off-targets (60%) and those that are not (40%). Length of ConvT regions was plotted and found to be significantly longer in the AID off-target associated intragenic SEs (Mann-Whitney U-test, p value =0.01).
Finally, to further address why some SEs are AID targets and others are not, we grouped all intragenic SEs into deciles based on low to high convergent transcription (Figure 5C). We then calculated the percentage of the combined 228 unique AID off-targets revealed by HTGTS (this study) and by an independent RPA-ChIP study (Qian et al., in press) in CSR-activated B cells in each decile. Strikingly, 60% of all SEs within the top 2 deciles (highest convergent transcription) were sites of clustered AID off-target DSBs and/or translocations. Comparative analysis of SEs in these top two deciles that were AID off-targets versus those that were not did not reveal any obvious sequence differences (e.g. GC content or WRCH and AGCT motifs density). However, ConvT regions associated with SEs in the top two deciles that were AID off-targets were significantly longer than those that were not (Figure 5D). These studies provide strong evidence that ConvT from intergeneic SEs generates a major class of focal AID off-target regions.
AID Off-targets in GC B cells Associate with Convergent Transcription
Prior studies of a selected set of AID off-targets divided them into three groups in GC B cells based on mutation frequency in Ung/Msh2 double deficient B cells versus AID-deficient B cells, including 15 Group A genes that had high levels of mutation, 21 group B genes that had substantially lower levels, and 47 group C genes that were infrequently mutated (Liu et al., 2008). Our GRO-Seq analyses of GC B cells revealed that nearly 70% of the highly mutated Group A gene off-target regions, including Pim1, Ebf1, CD83 and Ocab, overlapped with ConvT regions (Figure 6A, C) that were well above simulated background levels expected for the most highly transcribed genes (Figure. S5A). In contrast, regions reported to have low level mutation frequency (Group B and C genes) showed low correlations with convergent transcription (33% and 32%, respectively; Figure. 6A) that were not above simulated background concurrency (Figure S5A). Finally, of the five Group A genes that did not associate directly with convergent transcription, SHMs in four occurred quite proximal to ConvT regions (Figure S5C). We identified SEs in GC B cells via H3K27Ac ChIP-Seq analyses. We found that some SEs were shared between GC and CSR-activated B cells; while many others were found only in one or the other cell type (Figure S5B, Table S3), consistent with the overlapping but distinct GRO-Seq profiles of these two cell types (Figure S3B, Table S1). Of the highly mutated Group A gene regions, nearly half were associated with SEs (Figure 6B), and all were associated with H3K27Ac peaks (Figure 6C and S5C). For Group B and C gene regions, concurrencies with SE were 20% and 2%, respectively. Thus, under physiological conditions in the GC, AID often targets convergently transcribed intragenic SEs or, occasionally, typical enhancers.
Figure 6. Transcription of AID off-targets in GC B Cells.
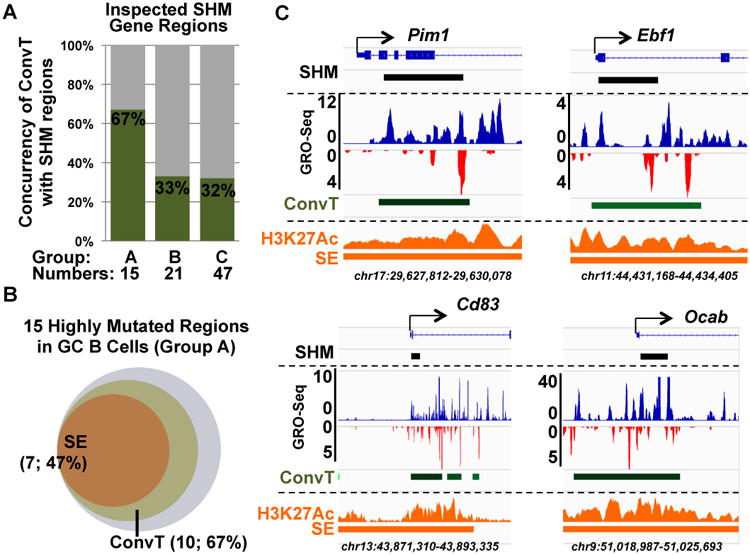
Regions of genes containing SHMs in Ung/Msh2 double deficient GC B cells were analyzed for convergent transcription as determined by GRO-Seq and outlined in Figure 3. GC AID off-target Group A, B and C genes include gene regions with high, intermediate, and low frequencies of AID-dependent mutations, respectively (Liu et al., 2008). (A): Concurrency of Group A, B and C gene ConvT regions in GC B cells. (B): Venn diagram showing the number of Group A gene regions that overlapped with SEs and ConvT. (C): Examples of Group A gene regions are shown. Approximately 2-3 kb regions around the TSSs of the indicated genes are shown. The “SHM” diagram at the top of each sub-panel indicates regions of these genes included in the prior SHM analyses (Liu et al., 2008) with a black bar. GRO-Seq profile, ConvT, H3K27Ac ChIP-Seq profile, and SEs are shown as in Figure 2A. See also Figure S5 and Table S3.
Convergently Transcribed Intragenic SEs Target AID in Non-B Lymphoid and human cells
Ectopic manipulation of endogenous SEs and ConvT regions to assess affects on AID targeting would be problematic since these regions are the actual AID targets. As an alternative approach, we performed GRO-Seq on mouse embryonic fibroblasts (MEFs) in which ectopic AID expression revealed a set of 29 AID off-target sequences, most of which were novel (Qian et al., in press) (Table S4). Remarkably, we found that the great majority of these clustered MEF translocations occurred in ConvT regions (Figure 7A and S6A) that also were mostly also associated with SEs (Qian et al., in press) (Table S4). We also tested the generality of our ConvT findings with respect to AID off-target events observed during SHM in the human Ramos Burkitt's lymphoma cell line. Strikingly, the majority of fifty-four AID off-targets identified in this line again were associated with SEs (Qian et al, in press); and we found that most were clustered in regions of strong ConvT (Figure 7B and S6B; Table S4). As discussed below, we have also extended our findings to human B cell lymphoma translocations.
Figure 7. Model of AID Targeting at Off-targets.
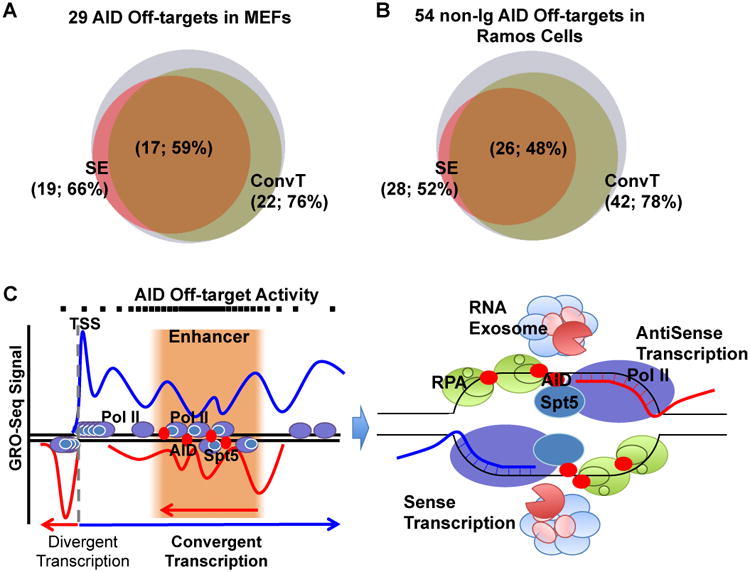
(A) Venn diagram showing the number of AID off-target regions that overlapped with SEs and ConvT in MEFs with ectopic AID overexpression. (B) Venn diagram showing number of AID off-target regions that overlapped with SEs and ConvT in Ramos Human Burkitt's lymphoma cell line. (C) Model of AID “off-targeting”. Left: At AID off-targets, SEs overlap with gene bodies and this combination generates regions of sense/antisense convergent transcription due to sense gene transcription encountering the enhancer antisense transcription. Right: Stalled RNA polymerase with the help of Spt5 recruits AID and generates regions of ssDNA. RNA Exosome or other RNases degrade the aborted sense and antisense transcripts, and works together with RPA to help AID access to the ssDNA substrates. Some aspects adapted from Basu et al., 2011; See Discussion for other details. See also Figure S6 and Table S4.
Discussion
Off-Target AID Activity in Convergently Transcribed Intragenic SEs
We report that most AID off-target DSBs and translocations in CSR-activated B cells occur in and around ConvT regions within genes (Figure 3). Furthermore, most of these AID off-target sites in CSR-activated B cells occurred within portions of genes that overlapped with enhancers, the vast majority of which were SEs (Figure 4). Together, these findings implicate a role for SEs within genes in generating robust ConvT and, thereby, in creating susceptibility to AID off-target activity. Notably, we also found that the majority of the regions with highest levels of off-target AID activity in GC B cells or in human Ramos cells undergoing SHM are in focal areas of target genes that contain SEs and undergo robust ConvT (Figures 6 and 7). Even in non-lymphoid cells (MEFs) in which AID was ectopically expressed, we found that the great majority of 29 AID dependent translocation clusters occurred in regions that underwent robust ConvT (Figure 7), confirming our findings for a totally different set of genes in a different cell type. Together, these finding strongly support a mechanistic link between AID off-target sequences and S/AS convergent transcription. A role for SEs in AID off-targeting also has been revealed by a separate study (Qian et al., in press).
Potential Mechanisms by which SEs and ConvT Contribute to AID Off-target Activity
RNA polymerase II (Pol II) transcriptional pausing or stalling contributes to directing AID to Ig gene SHM and CSR targets via a process thought to involve AID association with the Spt5 transcription cofactor (Pavri et al., 2010; Storb, 2014). Ig gene V(D)J exons and S regions likely evolved specific features to promote AID targeting (Alt et al., 2013). As AID off-target genes lack consistent sequence features of Ig gene AID targets (Duke et al., 2013), the question of how they attract AID has been long-standing. Our current findings implicate a mechanism that answers this question for the majority of AID off-targets (Figure 7C). Thus, most robust AID off-target DSBs, SHMs and translocations occur within intragenic SEs, where we find ConvT that includes sense gene transcription and antisense transcription emanating from the SEs. In such AID off-target regions, antisense eRNA transcription generally occurs at lower levels than sense transcription (Figures 2 and 4). Thus, most genic sense transcription likely proceeds unimpaired to generate full length mRNAs with only a small fraction encountering antisense transcription, consistent with ability of cells to generate products of these genes (Storb, 2014). Prior yeast studies showed that, within convergently transcribed sequences, Pol II elongation complexes proceeding in opposite directions cannot bypass each other, and that consequential Pol II collisions lead to stalling or stopping (Hobson et al., 2012). We propose that such Pol II stalling due to convergent transcription leads to AID recruitment and further downstream events similar to those implicated in specialized Ig gene targets (Figure 7C; Pavri et al., 2010; Basu et al., 2011). Beyond AID recruitment, convergent transcription could also generate ssDNA substrates for AID. Thus, following Pol II collisions, RNA exosome or other RNase activities could remove nascent transcripts (Basu et al., 2011; Pefanis et al., 2014; Andersson et al., 2014) to provide local ssDNA targets (Figure 7C).
Implications of AID Off-Target Activity for AID On-Target Ig Gene Activity
AID activity generally occurs at much higher levels on specialized Ig gene targets than on off-targets (Liu and Schatz, 2009; Yamane et al., 2011; Chiarle et al., 2011; Klein et al., 2011). Whether or not the ConvT mechanism we propose for off-targets can be applied to on-targets remains to be determined. In CSR-activated B cells, we observed ConvT within the very 5′ Sμ region (Figure S1H). However, the transcription profile of core S regions cannot be obtained due to poor mappability of repetitive S regions (Pavri et al., 2010). Clearly, S regions evolved specialized structural features that facilitate AID recruitment and access to the ssDNA substrates (Alt et al., 2013). However, mechanisms by which AID specifically targets Ig variable region exons for SHM in GCs may be more relevant. In this regard, a long-standing paradox involves that fact that SHM of variable region exons occurs only in GC B cells and not in CSR-activated B cells, even though the variable region exons are transcribed in both (Liu and Schatz, 2009). Our preliminary analyses reveal potentially higher relative levels of antisense to sense transcription on the downstream edge of the KI V(D)J (VB1-8) exon in GC versus naive or CSR activated B cells (Figure S1H). However, as we cannot map transcription within the main body of the KI VB1-8 due to many highly related unexpressed, upstream VHJ558 sequences, final testing of this potential mechanism for specific AID targeting of V(D)J exons will require additional mouse models that eliminate sequence redundancies.
Role of SE Transcription in Genome Instability and Cancer
SEs are important for establishment of cell lineage and expression of cell lineage-specific genes (Whyte et al., 2013; Hnisz et al., 2013). Correspondingly, SEs are associated frequently with genes highly expressed in activated B cells (Table S3). Many of the 51 genes that we have shown to have SEs that are AID off-targets are B cell-specific genes and a notably high proportion (25%) are known oncogenes (e.g. Figure S2B). In this regard, many human B cell lymphomas contain translocations or mutations of oncogenes that are initiated by off-target AID activity (Alt et al., 2013; Kuppers and Dalla Favera, 2001. Reminiscent of the AID off-targeting pattern in mouse CSR-activated and GC B cells, human B cell oncogene translocation sites often occur downstream of TSSs (Migliazza et al., 1995; Pasqualucci et al., 2001; Shen et al., 1998). Indeed, we have analyzed SEs in human tonsil B cells (enriched in GC B cells) and now found that many oncogene translocations in human B cell lymphoma, including those in c-myc, Pax5, Bcl6, Bcl2, Pim1, Ocab, Lcp, and Bcl7a, occur in regions downstream of TSSs where SEs overlap with gene bodies (Figure S6C). Thus, beyond contributing to de-regulated oncogene expression (Chapuy et al., 2013), our findings suggest that SEs may target oncogenes for translocations in B cell lymphoma. Finally, AID also has been implicated in genomic instability and translocations in cells beyond those of the immune system (e.g. Lin et al., 2009; Marusawa et al., 2011). Our MEF studies suggest ConvT from SEs could play a role in such settings.
Experimental Procedures
B Cell Purification
Splenic naïve B cells were purified from VHB1-8 heavy chain knock-in mice as described (Cato et al., 2011). Naïve B cells were activated with αCD40 plus IL4 for 60 hours to generate CSR-activated B cells. VHB1-8 knock-in mice were immunized with 5 × 10⁸ sheep red blood cells (SRBCs) for 9 days. Splenic GC B cells were purified as described (Cato et al., 2011). (See Supplementary Methods for details.)
GRO-Seq and ChIP-Seq
GRO-Seq (Core et al., 2008) and H3K27Ac ChIP-Seq (Chapuy et al., 2013) were performed as described. Three biological replicates of each mouse B cell type were performed. Two biological replicates of mouse MEF experiments and one biological replicate of Ramos experiments were performed.
AID Off-targets
HTGTS was performed with αCD40 plus IL4 or RP105 activated ATM deficient CSR-activated B cells as described (Hu et al., 2014) and also with a new HTGTS method (Frock et al., in press). AID off-target coordinates were retrieved via a new HTGTS pipeline (Frock et al., in press). (See Supplementary Methods for details.)
Data Analysis
GRO-Seq and ChIP-Seq data sets were aligned using Bowtie software (Langmead and Salzberg, 2012) to mouse genome build mm9/NCBI37 or human genome build hg19/NCBI37. Uniquely mapped, non-redundant sequence reads were retained. We used Homer software (Heinz et al., 2010) to de novo identify transcripts from both strands of the genome in the context of the GRO-Seq data, and considered broad sense/antisense overlap regions (>100bp) as ConvT regions. We used the MACS1.4 software (Zhang et al., 2008) to identify regions of ChIP-Seq enrichment over background with a P value threshold of 10−5. We used ROSE software to identify SEs (Whyte et al., 2013). (See Supplementary Methods for details.)
Supplementary Material
Supplementary Figure 1: Transcriptional profiles of three different B cell types. Related to Figure 1.
(A) General B cell purification Approach. See text for details. (B) Representative FACS plots of naïve, CSR-activated and GC B cells. Upper panels: At Day 2.5 after activation, about 25% VHB1-8 B cells switched to IgG1. Lower Panels: FACS staining of total splenocytes and purified GC B cells for B220 versus PNA. GC B cells are the B220+PNAhi population. (C). Western blot of AID protein in purified WT, AID-/- GC B cells and ex vivo αCD40 plus IL4 activated B cells. Histone H3 was blotted as a loading control. The anti-AID antibody used has been described (Chaudhuri et al., 2003) and anti-histone H3 antibody was from Abcam (ab1791). (D). SHM of the JH4 intron in the purified WT and AID-/- purified GC B cells performed as described previously (Jolly et al., 1997). (E) Correlation among different GRO-Seq replicates done on the same cell type. GRO-Seq signals per 10kb bin along the mouse genome were plotted for the three independent replicates of each cell type. The Pearson Correlation Coefficient (r) among the replicates was calculated and indicated on the figures. (F) Aggregate patterns of gene transcription profiles (metagene profile) at 1kb region on either side of TSSs. Antisense transcription is indicated in blue (bottom) and sense transcription is indicated in red (top). (G) Gene Ontology (GO) enrichment analysis of genes showing increased expression in GC B cells compared to naïve B cells (left), and GO enrichment analysis of genes showing increased expression in ex vivo CSR-activated B cells compared to in naïve B cells (right). False Discovery Rate (FDR) is -log10 converted and represented by a bar to show the significance of enrichment in different GO concepts. (H) GRO-Seq profiles of VHB1-8 preassembled V(D)J exon and the downstream Cμ region in the three cell types analyzed. The V(D)J exon, Iμ and Cμ are indicated by solid bars. Complementarity determining regions (CDRs) are shown by yellow bars inside of V(D)J exon, which contains WRCH (W=A/T, R=A/G and H=A/C/T) “SHM” hotspots. Predominant motifs (TGGG and AGCT) are highlighted for S region DNA. The unmappable core Sμ region is indicated by two vertical dashed lines. The Y-axis indicates the GRO-Seq read counts normalized to reads per million reads. Reads aligned to annotated gene sense and antisense strands are displayed in blue and red. The profiles of core Sμ region and V(D)J exon were incomplete because of the low mappability.
Supplementary Figure 2: HTGTS, GRO-Seq and H3K27Ac profiles of several AID off-targets. Related to Figure 2.
Translocation junctions from ATM-/- CSR-activated B cell HTGTS data are indicated in the HTGTS row (top), except for Myc which was the DSB bait site for HTGTS cloning. GRO-Seq determined gene sense and antisense transcription is displayed in blue and red, respectively in the middle panel. Convergent transcription (“ConvT”) is shown as green bars at the bottom of the GRO-Seq panel with the darkest shades corresponding to highest levels of convergent transcription as calculated by the geometric means of antisense and sense transcription reads (see Fig. 2A). The H3K27Ac ChIP-Seq profile is shown in orange, and Super-Enhancers (SEs) are shown below it in the bottom panel. (A). This set of panels shows 7 newly identified AID off-targets. (B). This panel shows AID off-targets whose human orthologs are oncogenes (see text for details). Panel C shows an example of a Class 4 gene (see text for details). Panel D is an example of a novel AID hotspot gene identified by the independent pipeline for SE-associated recurrent AID dependent HTGTS hotspots (see text and Supplementary methods for more details).
Supplementary Figure 3: AID off-targets associated with convergent transcription. Related to Figure 3.
(A) Random sampling in transcription regions. Random sampling of regions corresponding in size to those of AID off-target regions in three highest deciles (with respect to transcription levels) of transcribed genes revealed that the numbers of regions associated with convergent transcription in each sampling was substantially lower than that of regions containing AID off-targets. Random-sampling results are displayed in violin plots. The dashed line indicates the observed number of AID off-target regions associated with convergent transcription. (B) Venn diagram showing the overlap of convergent transcription regions among the three B cell types analyzed. (C) Convergent transcription levels of AID off-target associated convergent transcription regions and other non-AID off target associated convergent transcription regions are plotted. AID off-target associated convergent transcription regions had a significantly higher level of convergent transcription (Mann-Whitney U-test, p value <0.0001). (D) Sequencing Depth affects convergent transcription identification. The 306 million total mappable-reads from CSR-activated B cells were pooled and then randomly sampled. Random fractions of sequences at different sequencing depth were subjected to convergent transcription identification and AID off-target association analysis. The total convergent transcription region length continued increased with deeper sequencing depth (blue line). The numbers of AID off-targets associated convergent transcription reached saturation at about 120 millions mappable reads. The sequencing depth of our previously published GRO-Seq dataset (Chiarle et al., 2011) is indicated in the figure that as shown was not sufficient to identify the convergent transcription correlation with AID off-targets.
Supplementary Figure 4: AID off-targets located at SE-gene overlap. Related to Figure 4.
(A) Identification SEs with ROSE. All enhancers were ranked by their level of H3K27Ac ChIP-Seq reads. Enhancers with values above 15755 were considered SEs (See Supplementary Method for details). (B) HTGTS translocation junction numbers and H3K27Ac read density are plotted for individual AID off-targets. Spearman's rank correlation coefficient and two-tailed p value are indicated. (C) Observed versus Expected HTGTS translocation frequency in αCD40 plus IL4 activated and RP105 activated ATM deficient B cells. The filtered HTGTS junctions (See Supplementary Methods) were grouped into three different genomic regions, typical enhancer, super-enhancer and promoter. Typical and super enhancers were defined by using H3K27Ac ChIP-Seq peaks and promoters were defined at +/- 1kb from the annotated TSSs. Areas that overlap multiple regions (e.g. super-enhancers that cover promoter regions) were assigned to both categories. Expected values were estimated based on relative sizes of the three regions. The ratio of observed event versus the expected event was calculated for each category. (D) The overlap between SE-associated recurrent translocation regions identified by an independent pipeline (See Supplementary Methods for details) and AID off-target sites identified with previously described pipeline (Frock et al., in press; Hu et al., 2014; Chiarle et al., 2011). Among the 41 SE-associated recurrent translocation regions identified, 34 were identified as AID off-targets by the other pipeline and 7 were novel and all correlated with convergent transcription (Table S2).
Supplementary Figure 5: AID off-targets in GC B cells. Related to Figure 6.
(A) Venn diagram showing the overlap of SEs between CSR-activated and GC B cells. (B) Random sampling in highly transcribed gene regions revealed by GRO-Seq in GC B cells. The randomly sampling was done as described in the legend to Supplementary Figure 3A. The numbers of gene regions with convergent transcription in each random sampling was normalized to number of genes in Group A, B and C that convergently transcribed region (Figure. 6A). The normalized values (termed “random sampling index”) are displayed in violin plots. The closer a random sampling index is to 1, the more likely it is random. (C) GRO-Seq, ConvT, H3K27Ac and SE profiles of gene regions in highly mutated Group A genes. Regions that are around the annotated TSS are shown. Regions included in prior mutation analyses (Liu et al., 2008) are marked as black bar in the “SHM” row, and regions of AS/S convergent transcription (ConvT) are labeled below as green bars (See legend to Figure 2 for other details).
Supplementary Figure 6: Profiles of AID targets in MEFs, a Ramos Human B cell lymphoma line, Human B cell lymphoma translocations. Related to Figure 7.
(A) GRO-Seq and ConvT profiles of exampled AID off-targets in MEF cells. AID off-target Regions are shown. AID off-target information was retrieved from Qian et al., in press. (See legend to Figure 2 for other details). (B) GRO-Seq and ConvT profiles of exampled AID off-targets in Ramos cell lines. AID off-target regions are shown. AID off-target information was retrieved from Qian et al., in press. (See legend to Figure 2 for other details). (C) Human B cell lymphoma translocation junctions often occur in Human Tonsil Cell SE-Gene overlap regions. Translocation junction information was retrieved form TICdb database (Novo et al., 2007). SE location information of human tonsil was retrieved from Chapuy et al., 2012. NHL: non-Hodgkin lymphoma; CLL: chronic lymphocytic leukaemia; BL: Burkitt lymphoma; MALT: mucosa-associated lymphoid tissue lymphoma. Asterisks indicate oncogenes that were implicated as AID off-targets in human lymphomas (Kuppers and Dalla-Favera, 2001, Gostissa et al., 2011; Robbiani and Nussenzweig, 2013). Labeling is as in Figure 2A.
Highlights.
-AID off-target activity is associated with sense/antisense convergent transcription
-AID off-targeting occurs within intragenic SEs in mouse and human B lineage cells
-Strongly convergently transcribed intragenic SEs are predominant AID off-targets
-Ectopically-expressed AID in fibroblasts targets convergently transcribed SEs.
Acknowledgments
F.W.A was supported by NIH grants R01AI077595 and P01CA109901 and is an investigator of the Howard Hughes Medical Institute. X.S.L was supported by NIH grant 1R01GM099409. A.F and J.E.B. were supported by a Leukemia & Lymphoma Society SCOR, the National Science Foundation, and NIH grants 1R01 CA176745-01 and P01 CA109901. M.C.N. was supported by NIH grants AI072529 and AI037526 and is an investigator of the Howard Hughes Medical Institute. K.K. and R.C. were supported by the intramural research program of NIAMS, NIH. F.L.M. is a Lymphoma Research Foundation postdoctoral fellow and was a Cancer Research Institute postdoctoral fellow. J.Z. is supported by a Robertson Foundation/Cancer Research Institute Irvington Fellowship. ZD was supported by the National Science Foundation of China grant NSFC 31329003. The authors thank Drs. Yi Zhang and Li Shen for assistance with DNA sequencing and Dr. David Schatz (Yale University) for providing primers for GC SHM targets.
Footnotes
Author Contributions: F.L.M., Z.D., A.F., J.B., X.S.L. and F.W.A. designed the study. F.L.M, C.A and C.R.W. purified B cells and performed GRO-Seq. Z.D. analyzed GRO-Seq data. F.L.M., A.F. and C.A performed H3K27Ac ChIP-Seq and Z.D. and A.F. analyzed ChIP-Seq data. J.H. performed HTGTS and J.H. and R.M analyzed HTGTS data. Q.W and M.C.N prepared MEFs and supplied the AID off-target and SE list for MEFs. K.K. and R.C. supplied the AID off-target and SE list for Ramos cells and shared their AID off-target list for CSR-activated B cells. D.N. advised on statistical analysis and various aspects of data analysis. F.L.M, Z.D., and A.F. and F.W.A. designed figures. F.W.A and F.L.M. drafted the manuscript, and F.L. M., Z.D, A.F., J.B., X.S.L and F.W.A. polished the manuscript.
Accession Number: The Gene Expression Omnibus databank accession number for all deep sequencing data reported in this paper is GSE62296.
References
- Adelman K, Lis JT. Promoter-proximal pausing of RNA polymerase II: emerging roles in metazoans. Nature reviews Genetics. 2012;13:720–731. doi: 10.1038/nrg3293. [DOI] [PMC free article] [PubMed] [Google Scholar]
- Alt FW, Zhang Y, Meng FL, Guo C, Schwer B. Mechanisms of programmed DNA lesions and genomic instability in the immune system. Cell. 2013;152:417–429. doi: 10.1016/j.cell.2013.01.007. [DOI] [PMC free article] [PubMed] [Google Scholar]
- Andersson R, Gebhard C, Miguel-Escalada I, Hoof I, Bornholdt J, Boyd M, Chen Y, Zhao X, Schmidl C, Suzuki T, et al. An atlas of active enhancers across human cell types and tissues. Nature. 2014;507:455–461. doi: 10.1038/nature12787. [DOI] [PMC free article] [PubMed] [Google Scholar]
- Basso K, Dalla-Favera R. BCL6: master regulator of the germinal center reaction and key oncogene in B cell lymphomagenesis. Advances in immunology. 2010;105:193–210. doi: 10.1016/S0065-2776(10)05007-8. [DOI] [PubMed] [Google Scholar]
- Basu U, Meng FL, Keim C, Grinstein V, Pefanis E, Eccleston J, Zhang T, Myers D, Wasserman CR, Wesemann DR, et al. The RNA exosome targets the AID cytidine deaminase to both strands of transcribed duplex DNA substrates. Cell. 2011;144:353–363. doi: 10.1016/j.cell.2011.01.001. [DOI] [PMC free article] [PubMed] [Google Scholar]
- Brodeur PH, Riblet R. The immunoglobulin heavy chain variable region (Igh-V) locus in the mouse. I. One hundred Igh-V genes comprise seven families of homologous genes. European journal of immunology. 1984;14:922–930. doi: 10.1002/eji.1830141012. [DOI] [PubMed] [Google Scholar]
- Cato MH, Yau IW, Rickert RC. Magnetic-based purification of untouched mouse germinal center B cells for ex vivo manipulation and biochemical analysis. Nature protocols. 2011;6:953–960. doi: 10.1038/nprot.2011.344. [DOI] [PMC free article] [PubMed] [Google Scholar]
- Chapuy B, McKeown MR, Lin CY, Monti S, Roemer MG, Qi J, Rahl PB, Sun HH, Yeda KT, Doench JG, et al. Discovery and characterization of super-enhancer-associated dependencies in diffuse large B cell lymphoma. Cancer cell. 2013;24:777–790. doi: 10.1016/j.ccr.2013.11.003. [DOI] [PMC free article] [PubMed] [Google Scholar]
- Chiarle R, Zhang Y, Frock RL, Lewis SM, Molinie B, Ho YJ, Myers DR, Choi VW, Compagno M, Malkin DJ, et al. Genome-wide translocation sequencing reveals mechanisms of chromosome breaks and rearrangements in B cells. Cell. 2011;147:107–119. doi: 10.1016/j.cell.2011.07.049. [DOI] [PMC free article] [PubMed] [Google Scholar]
- Core LJ, Waterfall JJ, Lis JT. Nascent RNA sequencing reveals widespread pausing and divergent initiation at human promoters. Science. 2008;322:1845–1848. doi: 10.1126/science.1162228. [DOI] [PMC free article] [PubMed] [Google Scholar]
- Creyghton MP, Cheng AW, Welstead GG, Kooistra T, Carey BW, Steine EJ, Hanna J, Lodato MA, Frampton GM, Sharp PA, et al. Histone H3K27Ac separates active from poised enhancers and predicts developmental state. Proceedings of the National Academy of Sciences of the United States of America. 2010;107:21931–21936. doi: 10.1073/pnas.1016071107. [DOI] [PMC free article] [PubMed] [Google Scholar]
- Delmore JE, Issa GC, Lemieux ME, Rahl PB, Shi J, Jacobs HM, Kastritis E, Gilpatrick T, Paranal RM, Qi J, et al. BET bromodomain inhibition as a therapeutic strategy to target c-Myc. Cell. 2011;146:904–917. doi: 10.1016/j.cell.2011.08.017. [DOI] [PMC free article] [PubMed] [Google Scholar]
- Di Noia JM, Neuberger MS. Molecular mechanisms of antibody somatic hypermutation. Annual review of biochemistry. 2007;76:1–22. doi: 10.1146/annurev.biochem.76.061705.090740. [DOI] [PubMed] [Google Scholar]
- Duke JL, Liu M, Yaari G, Khalil AM, Tomayko MM, Shlomchik MJ, Schatz DG, Kleinstein SH. Multiple transcription factor binding sites predict AID targeting in non-Ig genes. Journal of immunology. 2013;190:3878–3888. doi: 10.4049/jimmunol.1202547. [DOI] [PMC free article] [PubMed] [Google Scholar]
- Frock RL, Hu J, Meyers RM, Ho YJ, Kii E, Alt FW. Genome-wide detection of specific and non-specific DNA DSB activities of custom nucleases in human cells. Nature Biotechnology. doi: 10.1038/nbt.3101. In press. [DOI] [PMC free article] [PubMed] [Google Scholar]
- Gostissa M, Yan CT, Bianco JM, Cogne M, Pinaud E, Alt FW. Long-range oncogenic activation of Igh-c-myc translocations by the Igh 3′ regulatory region. Nature. 2009;462:803–807. doi: 10.1038/nature08633. [DOI] [PMC free article] [PubMed] [Google Scholar]
- Gullerova M, Proudfoot NJ. Convergent transcription induces transcriptional gene silencing in fission yeast and mammalian cells. Nature structural & molecular biology. 2012;19:1193–1201. doi: 10.1038/nsmb.2392. [DOI] [PMC free article] [PubMed] [Google Scholar]
- Heinz S, Benner C, Spann N, Bertolino E, Lin YC, Laslo P, Cheng JX, Murre C, Singh H, Glass CK. Simple combinations of lineage-determining transcription factors prime cis-regulatory elements required for macrophage and B cell identities. Molecular cell. 2010;38:576–589. doi: 10.1016/j.molcel.2010.05.004. [DOI] [PMC free article] [PubMed] [Google Scholar]
- Hnisz D, Abraham BJ, Lee TI, Lau A, Saint-Andre V, Sigova AA, Hoke HA, Young RA. Super-enhancers in the control of cell identity and disease. Cell. 2013;155:934–947. doi: 10.1016/j.cell.2013.09.053. [DOI] [PMC free article] [PubMed] [Google Scholar]
- Hobson DJ, Wei W, Steinmetz LM, Svejstrup JQ. RNA polymerase II collision interrupts convergent transcription. Molecular cell. 2012;48:365–374. doi: 10.1016/j.molcel.2012.08.027. [DOI] [PMC free article] [PubMed] [Google Scholar]
- Hu J, Tepsuporn S, Meyers RM, Gostissa M, Alt FW. Proceedings of the National Academy of Sciences of the United States of America. 2014. Developmental propagation of V(D)J recombination-associated DNA breaks and translocations in mature B cells via dicentric chromosomes. [DOI] [PMC free article] [PubMed] [Google Scholar]
- Jacquier A. The complex eukaryotic transcriptome: unexpected pervasive transcription and novel small RNAs. Nature reviews Genetics. 2009;10:833–844. doi: 10.1038/nrg2683. [DOI] [PubMed] [Google Scholar]
- Kieffer-Kwon KR, Tang Z, Mathe E, Qian J, Sung MH, Li G, Resch W, Baek S, Pruett N, Grontved L, et al. Interactome maps of mouse gene regulatory domains reveal basic principles of transcriptional regulation. Cell. 2013;155:1507–1520. doi: 10.1016/j.cell.2013.11.039. [DOI] [PMC free article] [PubMed] [Google Scholar]
- Klein IA, Resch W, Jankovic M, Oliveira T, Yamane A, Nakahashi H, Di Virgilio M, Bothmer A, Nussenzweig A, Robbiani DF, et al. Translocation-capture sequencing reveals the extent and nature of chromosomal rearrangements in B lymphocytes. Cell. 2011;147:95–106. doi: 10.1016/j.cell.2011.07.048. [DOI] [PMC free article] [PubMed] [Google Scholar]
- Kuppers R, Dalla-Favera R. Mechanisms of chromosomal translocations in B cell lymphomas. Oncogene. 2001;20:5580–5594. doi: 10.1038/sj.onc.1204640. [DOI] [PubMed] [Google Scholar]
- Lam MT, Li W, Rosenfeld MG, Glass CK. Enhancer RNAs and regulated transcriptional programs. Trends in biochemical sciences. 2014;39:170–182. doi: 10.1016/j.tibs.2014.02.007. [DOI] [PMC free article] [PubMed] [Google Scholar]
- Langmead B, Salzberg SL. Fast gapped-read alignment with Bowtie 2. Nature methods. 2012;9:357–359. doi: 10.1038/nmeth.1923. [DOI] [PMC free article] [PubMed] [Google Scholar]
- Levine M, Cattoglio C, Tjian R. Looping back to leap forward: transcription enters a new era. Cell. 2014;157:13–25. doi: 10.1016/j.cell.2014.02.009. [DOI] [PMC free article] [PubMed] [Google Scholar]
- Lin C, Yang L, Tanasa B, Hutt K, Ju BG, Ohgi K, Zhang J, Rose DW, Fu XD, Glass CK, et al. Nuclear receptor-induced chromosomal proximity and DNA breaks underlie specific translocations in cancer. Cell. 2009;139:1069–1083. doi: 10.1016/j.cell.2009.11.030. [DOI] [PMC free article] [PubMed] [Google Scholar]
- Liu M, Duke JL, Richter DJ, Vinuesa CG, Goodnow CC, Kleinstein SH, Schatz DG. Two levels of protection for the B cell genome during somatic hypermutation. Nature. 2008;451:841–845. doi: 10.1038/nature06547. [DOI] [PubMed] [Google Scholar]
- Liu M, Schatz DG. Balancing AID and DNA repair during somatic hypermutation. Trends in immunology. 2009;30:173–181. doi: 10.1016/j.it.2009.01.007. [DOI] [PubMed] [Google Scholar]
- Liu YJ, Mason DY, Johnson GD, Abbot S, Gregory CD, Hardie DL, Gordon J, MacLennan IC. Germinal center cells express bcl-2 protein after activation by signals which prevent their entry into apoptosis. European journal of immunology. 1991;21:1905–1910. doi: 10.1002/eji.1830210819. [DOI] [PubMed] [Google Scholar]
- Loven J, Hoke HA, Lin CY, Lau A, Orlando DA, Vakoc CR, Bradner JE, Lee TI, Young RA. Selective inhibition of tumor oncogenes by disruption of super-enhancers. Cell. 2013;153:320–334. doi: 10.1016/j.cell.2013.03.036. [DOI] [PMC free article] [PubMed] [Google Scholar]
- Marusawa H, Takai A, Chiba T. Role of activation-induced cytidine deaminase in inflammation-associated cancer development. Advances in immunology. 2011;111:109–141. doi: 10.1016/B978-0-12-385991-4.00003-9. [DOI] [PubMed] [Google Scholar]
- Matthews AJ, Zheng S, DiMenna LJ, Chaudhuri J. Regulation of immunoglobulin class-switch recombination: choreography of noncoding transcription, targeted DNA deamination, and long-range DNA repair. Advances in immunology. 2014;122:1–57. doi: 10.1016/B978-0-12-800267-4.00001-8. [DOI] [PMC free article] [PubMed] [Google Scholar]
- Migliazza A, Martinotti S, Chen W, Fusco C, Ye BH, Knowles DM, Offit K, Chaganti RS, Dalla-Favera R. Frequent somatic hypermutation of the 5′ noncoding region of the BCL6 gene in B-cell lymphoma. Proceedings of the National Academy of Sciences of the United States of America. 1995;92:12520–12524. doi: 10.1073/pnas.92.26.12520. [DOI] [PMC free article] [PubMed] [Google Scholar]
- Muramatsu M, Kinoshita K, Fagarasan S, Yamada S, Shinkai Y, Honjo T. Class switch recombination and hypermutation require activation-induced cytidine deaminase (AID), a potential RNA editing enzyme. Cell. 2000;102:553–563. doi: 10.1016/s0092-8674(00)00078-7. [DOI] [PubMed] [Google Scholar]
- Natoli G, Andrau JC. Noncoding transcription at enhancers: general principles and functional models. Annual review of genetics. 2012;46:1–19. doi: 10.1146/annurev-genet-110711-155459. [DOI] [PubMed] [Google Scholar]
- Parker SC, Stitzel ML, Taylor DL, Orozco JM, Erdos MR, Akiyama JA, van Bueren KL, Chines PS, Narisu N, Program NCS, et al. Chromatin stretch enhancer states drive cell-specific gene regulation and harbor human disease risk variants. Proceedings of the National Academy of Sciences of the United States of America. 2013;110:17921–17926. doi: 10.1073/pnas.1317023110. [DOI] [PMC free article] [PubMed] [Google Scholar]
- Pasqualucci L, Neumeister P, Goossens T, Nanjangud G, Chaganti RS, Kuppers R, Dalla-Favera R. Hypermutation of multiple proto-oncogenes in B-cell diffuse large-cell lymphomas. Nature. 2001;412:341–346. doi: 10.1038/35085588. [DOI] [PubMed] [Google Scholar]
- Pavri R, Gazumyan A, Jankovic M, Di Virgilio M, Klein I, Ansarah-Sobrinho C, Resch W, Yamane A, Reina San-Martin B, Barreto V, et al. Activation-induced cytidine deaminase targets DNA at sites of RNA polymerase II stalling by interaction with Spt5. Cell. 2010;143:122–133. doi: 10.1016/j.cell.2010.09.017. [DOI] [PMC free article] [PubMed] [Google Scholar]
- Pefanis E, Wang J, Rothschild G, Lim J, Chao J, Rabadan R, Economides AN, Basu U. Noncoding RNA transcription targets AID to divergently transcribed loci in B cells. Nature. 2014;514:389–393. doi: 10.1038/nature13580. [DOI] [PMC free article] [PubMed] [Google Scholar]
- Qian J, Wang Q, Dose M, Pruett N, Kieffer-Kwon K, Resch W, Liang G, Tang Z, Mathé E, Benner C, et al. B cell super-enhancers and regulatory clusters recruit AID tumorigenic activity. Cell. 2014 doi: 10.1016/j.cell.2014.11.013. In press. [DOI] [PMC free article] [PubMed] [Google Scholar]
- Rajagopal D, Maul RW, Ghosh A, Chakraborty T, Khamlichi AA, Sen R, Gearhart PJ. Immunoglobulin switch mu sequence causes RNA polymerase II accumulation and reduces dA hypermutation. The Journal of experimental medicine. 2009;206:1237–1244. doi: 10.1084/jem.20082514. [DOI] [PMC free article] [PubMed] [Google Scholar]
- Richter K, Brar S, Ray M, Pisitkun P, Bolland S, Verkoczy L, Diaz M. Speckled-like pattern in the germinal center (SLIP-GC), a nuclear GTPase expressed in activation-induced deaminase-expressing lymphomas and germinal center B cells. The Journal of biological chemistry. 2009;284:30652–30661. doi: 10.1074/jbc.M109.014506. [DOI] [PMC free article] [PubMed] [Google Scholar]
- Shen HM, Peters A, Baron B, Zhu X, Storb U. Mutation of BCL-6 gene in normal B cells by the process of somatic hypermutation of Ig genes. Science. 1998;280:1750–1752. doi: 10.1126/science.280.5370.1750. [DOI] [PubMed] [Google Scholar]
- Storb U. Why does somatic hypermutation by AID require transcription of its target genes? Advances in immunology. 2014;122:253–277. doi: 10.1016/B978-0-12-800267-4.00007-9. [DOI] [PubMed] [Google Scholar]
- Sonoda E, Pewzner-Jung Y, Schwers S, Taki S, Jung S, Eilat D, Rajewsky K. B cell development under the condition of allelic inclusion. Immunity. 1997;6:225–233. doi: 10.1016/s1074-7613(00)80325-8. [DOI] [PubMed] [Google Scholar]
- Victora GD, Nussenzweig MC. Germinal centers. Annual review of immunology. 2012;30:429–457. doi: 10.1146/annurev-immunol-020711-075032. [DOI] [PubMed] [Google Scholar]
- Wang D, Garcia-Bassets I, Benner C, Li W, Su X, Zhou Y, Qiu J, Liu W, Kaikkonen MU, Ohgi KA, et al. Reprogramming transcription by distinct classes of enhancers functionally defined by eRNA. Nature. 2011;474:390–394. doi: 10.1038/nature10006. [DOI] [PMC free article] [PubMed] [Google Scholar]
- Wang L, Wuerffel R, Feldman S, Khamlichi AA, Kenter AL. S region sequence, RNA polymerase II, and histone modifications create chromatin accessibility during class switch recombination. The Journal of experimental medicine. 2009;206:1817–1830. doi: 10.1084/jem.20081678. [DOI] [PMC free article] [PubMed] [Google Scholar]
- Ward DF, Murray NE. Convergent transcription in bacteriophage lambda: interference with gene expression. Journal of molecular biology. 1979;133:249–266. doi: 10.1016/0022-2836(79)90533-3. [DOI] [PubMed] [Google Scholar]
- Whyte WA, Orlando DA, Hnisz D, Abraham BJ, Lin CY, Kagey MH, Rahl PB, Lee TI, Young RA. Master transcription factors and mediator establish super-enhancers at key cell identity genes. Cell. 2013;153:307–319. doi: 10.1016/j.cell.2013.03.035. [DOI] [PMC free article] [PubMed] [Google Scholar]
- Wu X, Sharp PA. Divergent transcription: a driving force for new gene origination? Cell. 2013;155:990–996. doi: 10.1016/j.cell.2013.10.048. [DOI] [PMC free article] [PubMed] [Google Scholar]
- Yamane A, Resch W, Kuo N, Kuchen S, Li Z, Sun HW, Robbiani DF, McBride K, Nussenzweig MC, Casellas R. Deep-sequencing identification of the genomic targets of the cytidine deaminase AID and its cofactor RPA in B lymphocytes. Nature immunology. 2011;12:62–69. doi: 10.1038/ni.1964. [DOI] [PMC free article] [PubMed] [Google Scholar]
- Zhang Y, Liu T, Meyer CA, Eeckhoute J, Johnson DS, Bernstein BE, Nusbaum C, Myers RM, Brown M, Li W, et al. Model-based analysis of ChIP-Seq (MACS) Genome biology. 2008;9:R137. doi: 10.1186/gb-2008-9-9-r137. [DOI] [PMC free article] [PubMed] [Google Scholar]
- Zhang Y, McCord RP, Ho YJ, Lajoie BR, Hildebrand DG, Simon AC, Becker MS, Alt FW, Dekker J. Spatial organization of the mouse genome and its role in recurrent chromosomal translocations. Cell. 2012;148:908–921. doi: 10.1016/j.cell.2012.02.002. [DOI] [PMC free article] [PubMed] [Google Scholar]
Associated Data
This section collects any data citations, data availability statements, or supplementary materials included in this article.
Supplementary Materials
Supplementary Figure 1: Transcriptional profiles of three different B cell types. Related to Figure 1.
(A) General B cell purification Approach. See text for details. (B) Representative FACS plots of naïve, CSR-activated and GC B cells. Upper panels: At Day 2.5 after activation, about 25% VHB1-8 B cells switched to IgG1. Lower Panels: FACS staining of total splenocytes and purified GC B cells for B220 versus PNA. GC B cells are the B220+PNAhi population. (C). Western blot of AID protein in purified WT, AID-/- GC B cells and ex vivo αCD40 plus IL4 activated B cells. Histone H3 was blotted as a loading control. The anti-AID antibody used has been described (Chaudhuri et al., 2003) and anti-histone H3 antibody was from Abcam (ab1791). (D). SHM of the JH4 intron in the purified WT and AID-/- purified GC B cells performed as described previously (Jolly et al., 1997). (E) Correlation among different GRO-Seq replicates done on the same cell type. GRO-Seq signals per 10kb bin along the mouse genome were plotted for the three independent replicates of each cell type. The Pearson Correlation Coefficient (r) among the replicates was calculated and indicated on the figures. (F) Aggregate patterns of gene transcription profiles (metagene profile) at 1kb region on either side of TSSs. Antisense transcription is indicated in blue (bottom) and sense transcription is indicated in red (top). (G) Gene Ontology (GO) enrichment analysis of genes showing increased expression in GC B cells compared to naïve B cells (left), and GO enrichment analysis of genes showing increased expression in ex vivo CSR-activated B cells compared to in naïve B cells (right). False Discovery Rate (FDR) is -log10 converted and represented by a bar to show the significance of enrichment in different GO concepts. (H) GRO-Seq profiles of VHB1-8 preassembled V(D)J exon and the downstream Cμ region in the three cell types analyzed. The V(D)J exon, Iμ and Cμ are indicated by solid bars. Complementarity determining regions (CDRs) are shown by yellow bars inside of V(D)J exon, which contains WRCH (W=A/T, R=A/G and H=A/C/T) “SHM” hotspots. Predominant motifs (TGGG and AGCT) are highlighted for S region DNA. The unmappable core Sμ region is indicated by two vertical dashed lines. The Y-axis indicates the GRO-Seq read counts normalized to reads per million reads. Reads aligned to annotated gene sense and antisense strands are displayed in blue and red. The profiles of core Sμ region and V(D)J exon were incomplete because of the low mappability.
Supplementary Figure 2: HTGTS, GRO-Seq and H3K27Ac profiles of several AID off-targets. Related to Figure 2.
Translocation junctions from ATM-/- CSR-activated B cell HTGTS data are indicated in the HTGTS row (top), except for Myc which was the DSB bait site for HTGTS cloning. GRO-Seq determined gene sense and antisense transcription is displayed in blue and red, respectively in the middle panel. Convergent transcription (“ConvT”) is shown as green bars at the bottom of the GRO-Seq panel with the darkest shades corresponding to highest levels of convergent transcription as calculated by the geometric means of antisense and sense transcription reads (see Fig. 2A). The H3K27Ac ChIP-Seq profile is shown in orange, and Super-Enhancers (SEs) are shown below it in the bottom panel. (A). This set of panels shows 7 newly identified AID off-targets. (B). This panel shows AID off-targets whose human orthologs are oncogenes (see text for details). Panel C shows an example of a Class 4 gene (see text for details). Panel D is an example of a novel AID hotspot gene identified by the independent pipeline for SE-associated recurrent AID dependent HTGTS hotspots (see text and Supplementary methods for more details).
Supplementary Figure 3: AID off-targets associated with convergent transcription. Related to Figure 3.
(A) Random sampling in transcription regions. Random sampling of regions corresponding in size to those of AID off-target regions in three highest deciles (with respect to transcription levels) of transcribed genes revealed that the numbers of regions associated with convergent transcription in each sampling was substantially lower than that of regions containing AID off-targets. Random-sampling results are displayed in violin plots. The dashed line indicates the observed number of AID off-target regions associated with convergent transcription. (B) Venn diagram showing the overlap of convergent transcription regions among the three B cell types analyzed. (C) Convergent transcription levels of AID off-target associated convergent transcription regions and other non-AID off target associated convergent transcription regions are plotted. AID off-target associated convergent transcription regions had a significantly higher level of convergent transcription (Mann-Whitney U-test, p value <0.0001). (D) Sequencing Depth affects convergent transcription identification. The 306 million total mappable-reads from CSR-activated B cells were pooled and then randomly sampled. Random fractions of sequences at different sequencing depth were subjected to convergent transcription identification and AID off-target association analysis. The total convergent transcription region length continued increased with deeper sequencing depth (blue line). The numbers of AID off-targets associated convergent transcription reached saturation at about 120 millions mappable reads. The sequencing depth of our previously published GRO-Seq dataset (Chiarle et al., 2011) is indicated in the figure that as shown was not sufficient to identify the convergent transcription correlation with AID off-targets.
Supplementary Figure 4: AID off-targets located at SE-gene overlap. Related to Figure 4.
(A) Identification SEs with ROSE. All enhancers were ranked by their level of H3K27Ac ChIP-Seq reads. Enhancers with values above 15755 were considered SEs (See Supplementary Method for details). (B) HTGTS translocation junction numbers and H3K27Ac read density are plotted for individual AID off-targets. Spearman's rank correlation coefficient and two-tailed p value are indicated. (C) Observed versus Expected HTGTS translocation frequency in αCD40 plus IL4 activated and RP105 activated ATM deficient B cells. The filtered HTGTS junctions (See Supplementary Methods) were grouped into three different genomic regions, typical enhancer, super-enhancer and promoter. Typical and super enhancers were defined by using H3K27Ac ChIP-Seq peaks and promoters were defined at +/- 1kb from the annotated TSSs. Areas that overlap multiple regions (e.g. super-enhancers that cover promoter regions) were assigned to both categories. Expected values were estimated based on relative sizes of the three regions. The ratio of observed event versus the expected event was calculated for each category. (D) The overlap between SE-associated recurrent translocation regions identified by an independent pipeline (See Supplementary Methods for details) and AID off-target sites identified with previously described pipeline (Frock et al., in press; Hu et al., 2014; Chiarle et al., 2011). Among the 41 SE-associated recurrent translocation regions identified, 34 were identified as AID off-targets by the other pipeline and 7 were novel and all correlated with convergent transcription (Table S2).
Supplementary Figure 5: AID off-targets in GC B cells. Related to Figure 6.
(A) Venn diagram showing the overlap of SEs between CSR-activated and GC B cells. (B) Random sampling in highly transcribed gene regions revealed by GRO-Seq in GC B cells. The randomly sampling was done as described in the legend to Supplementary Figure 3A. The numbers of gene regions with convergent transcription in each random sampling was normalized to number of genes in Group A, B and C that convergently transcribed region (Figure. 6A). The normalized values (termed “random sampling index”) are displayed in violin plots. The closer a random sampling index is to 1, the more likely it is random. (C) GRO-Seq, ConvT, H3K27Ac and SE profiles of gene regions in highly mutated Group A genes. Regions that are around the annotated TSS are shown. Regions included in prior mutation analyses (Liu et al., 2008) are marked as black bar in the “SHM” row, and regions of AS/S convergent transcription (ConvT) are labeled below as green bars (See legend to Figure 2 for other details).
Supplementary Figure 6: Profiles of AID targets in MEFs, a Ramos Human B cell lymphoma line, Human B cell lymphoma translocations. Related to Figure 7.
(A) GRO-Seq and ConvT profiles of exampled AID off-targets in MEF cells. AID off-target Regions are shown. AID off-target information was retrieved from Qian et al., in press. (See legend to Figure 2 for other details). (B) GRO-Seq and ConvT profiles of exampled AID off-targets in Ramos cell lines. AID off-target regions are shown. AID off-target information was retrieved from Qian et al., in press. (See legend to Figure 2 for other details). (C) Human B cell lymphoma translocation junctions often occur in Human Tonsil Cell SE-Gene overlap regions. Translocation junction information was retrieved form TICdb database (Novo et al., 2007). SE location information of human tonsil was retrieved from Chapuy et al., 2012. NHL: non-Hodgkin lymphoma; CLL: chronic lymphocytic leukaemia; BL: Burkitt lymphoma; MALT: mucosa-associated lymphoid tissue lymphoma. Asterisks indicate oncogenes that were implicated as AID off-targets in human lymphomas (Kuppers and Dalla-Favera, 2001, Gostissa et al., 2011; Robbiani and Nussenzweig, 2013). Labeling is as in Figure 2A.