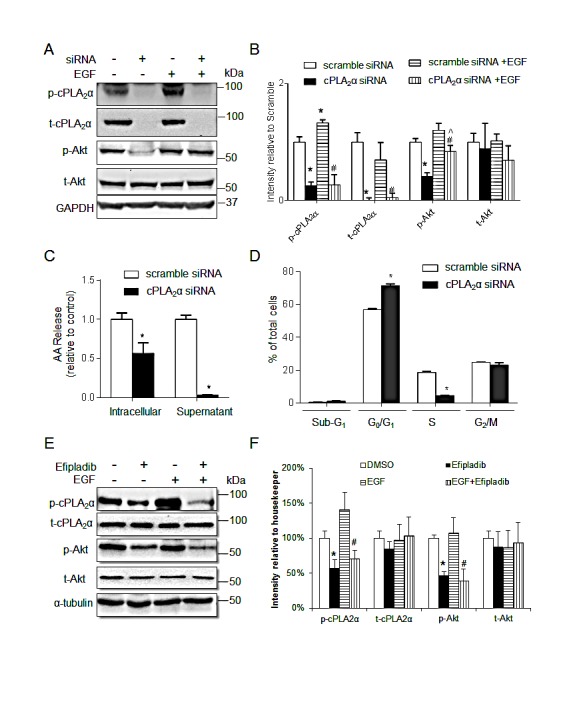
Figure 2. Silence of cPLAα decreases EGF-stimulated p-AKT and cell proliferation in HT-29 cells.

(A) immunoblot and (B) quantification of cPLA2α and AKT in cells transfected with cPLA2α siRNA or scramble control (10 nM for 72 h) with or without EGF treatment (20 ng/mL, 30 min). *P <0.05 vs. cells transfected with scramble control without EGF; #P <0.05 vs. cells transfected with scramble control with EGF. ^P <0.05 cPLA2α siRNA vs. cPLA2α siRNA+EGF. (C) Arachidonic acid concentration in the intracellular and supernatant compartments measured by Mass Spectrometry. *P <0.05 vs. cells transfected with scramble control. (D) DNA content analysis by PI-Flow cytometry. *P <0.05 vs. cells transfected with scramble control.; (E) Immunoblot of HT-29 cells treated with 25 μM Efipladib for 72 h and/or 20 ng/mL EGF for 30 min before harvesting. (F) Densitometry quantification. *P <0.05 vs. DMSO, #P <0.05 vs. DMSO+EGF, n=3. All data expressed as Mean ± SD.
