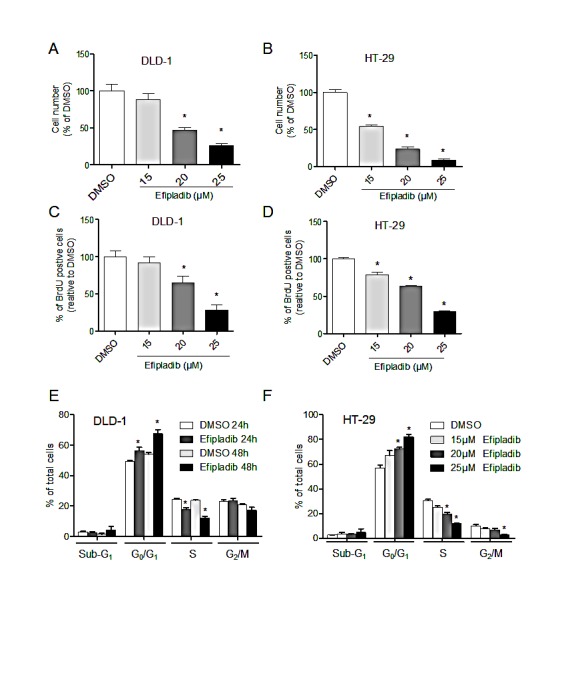
Figure 3. Pharmacological blockade of cPLAα by Efipladib results in decreased cell proliferation.

DLD-1 (A) or HT-29 cells (B) were plated in 96-well plates and treated with vehicle control (DMSO) or Efipladib for 72 h. The viable cell number was determined by the MTS assay. DLD-1 (C) or HT-29 (D) cells were plated in 6-well plates and treated with control (DMSO) or Efipladib for 72 h. BrdU was added for 3 h prior to harvesting. BrdU incorporation was determined by immunocytochemistry. Percentage of BrdU positive cells was determined as the average of 10 high-power fields (X40) per sample. *P <0.05 vs. vehicle-treated control, n=3. (E) DLD-1 cells were treated with Efipladib at 25 μM for 1 or 2 days, followed by staining with PI and subsequent analysis with flow cytometry. *P<0.05 vs. vehicle-treated control, n=3. (F) HT-29 cells were treated with Efipladib at indicated doses for 3 days, followed by PI-staining and DNA content analysis. *P<0.05 vs. vehicle-treated control, n=3. All data expressed as Mean ± SD.
