

Abstract
Background
Roughly half of U.S. adults do not receive recommended booster vaccinations, but protective antibody levels are rarely measured in adults. Demographic factors, vaccination history, and responses to other vaccinations could help identify at-risk individuals. We sought to characterize rates of seroconversion and determine associations of humoral responses to multiple vaccinations in healthy adults.
Methods
Humoral responses toward measles, mumps, tetanus toxoid, pertussis, hepatitis B surface antigen, and anthrax protective antigen were measured by ELISA in post-immunization samples from 1,465 healthy U.S. military members. We examined the effects of demographic and clinical factors on immunization responses, as well as assessed correlations between vaccination responses.
Results
Subsets of boosted adults did not have seroprotective levels of antibodies toward measles (10.4%), mumps (9.4%), pertussis (4.7%), hepatitis B (8.6%) or protective antigen (14.4%) detected. Half-lives of antibody responses were generally long (>30 years). Measles and mumps antibody levels were correlated (r=0.31, p<0.001), but not associated with select demographic features or vaccination history. Measles and mumps antibody levels also correlated with tetanus antibody response (r=0.11, p<0.001).
Conclusions
Vaccination responses are predominantly robust and vaccine specific. However, a small but significant portion of the vaccinated adult population may not have quantitative seroprotective antibody to common vaccine-preventable infections.
Keywords: Anthrax Vaccine Adsorbed, measles, mumps, tetanus, hepatitis B, pertussis
1. Introduction
Current United States (U.S.) vaccination practice calls for administration of standardized sets of vaccinations to populations defined by age and in some cases, sex, with the assumption that essentially everyone will respond by generating protective and long-lived antibody titers [1]. Most vaccinations are given during childhood, and follow-up antibody titers are rarely assessed. This vaccination approach generates herd immunity, affords general disease control, and protects most children from vaccine-preventable disease. However, this approach does not consider primary vaccine failure, in which an adult may not develop protective immunity even with booster vaccination; secondary vaccine failure, where antibody titers decline with time; nor the failure of many adults to receive recommended boosters. The recent resurgence of pertussis has demonstrated that waning vaccine-induced immunity allows endemic infections in adults, endangering potentially susceptible children [2, 3].
In the U.S., most people are vaccinated against measles, mumps, tetanus, pertussis and, since 1991, hepatitis B as children (Supplementary Table 1). Current recommendations for adult boosters include doses of tetanus toxoid with diphtheria (Td or Tdap) every 10 years, and most recently, a single booster of acellular pertussis [4], but non-influenza vaccine coverage in civilian adults is only 40–60% [5]. In contrast, upon enlistment military personnel are generally given MMR if not already immune, Td/Tdap boosters, the standard hepatitis B vaccination series, and anthrax vaccine adsorbed (AVA) if deemed at risk [6].
Primary vaccine failure rates vary greatly. Primary MMR failure rates in children against both measles and mumps are 2–7% [7]. Hepatitis B vaccination in adolescents or adults has a primary failure rate of 2–10% for two or three doses [8, 9]. Acellular pertussis vaccinations have fairly high primary failure rates of 11–29%; in addition, antibody is short-lived [2, 10]. AVA and tetanus vaccinations both have very low primary failure rates (<3%) [11, 12]; although, antibody titers generated in response to AVA wane rapidly [13, 14]. Primary vaccine failure is thought to be vaccine-specific and may be primarily controlled by select variations in genes encoding HLA proteins, pattern recognition receptors, or cytokines [1, 7, 15–18]. However, other genetic associations with vaccination response, including polymorphisms in cytokines and cytokine receptors, sex, or environmental factors such as stress, obesity, and smoking may influence the individual response to multiple vaccinations [19–25]. To our knowledge, only two studies to date have compared concurrent vaccination responses to multiple vaccine antigens within a given individual, and both used pediatric cohorts [7, 26].
Expecting that vaccine responses would be similar for vaccines that induce antibody generation via comparable mechanisms, we hypothesized that adult vaccination response to protein vaccines containing aluminum adjuvant (tetanus toxoid vaccines, pertussis vaccines, hepatitis B, and AVA, see Supplementary Table 1) would be strongly correlated, and that responses to live attenuated viral preparations (measles, mumps) would be strongly correlated. We measured antibody titers against measles, mumps, tetanus toxoid, whole pertussis, protective antigen (PA, from AVA), and hepatitis B surface antigen (HBs) and determined protective seroprevalence, examined the impact of vaccination history or demographics on antibody levels, and evaluated the extent to which antibodies directed toward components of different vaccines were correlated.
2. Materials and Methods
2.1. Human subjects
Military personnel (n=1465) who had been immunized at least 3 times with AVA provided informed written consent and vaccination history, sex, age, and race information. Institutional Review Board approval was obtained from the Oklahoma Medical Research Foundation, Walter Reed Army (after August 2011, Walter Reed National Military) Medical Center Vaccine Healthcare Centers (VHC) Network/Allergy-Immunology and Womack Army Medical Center, Fort Bragg Regional VHC. Peripheral blood was collected; plasma was isolated, aliquoted, and stored at ≤−20°C until testing. Descriptions of all potential measles, mumps, tetanus, pertussis, anthrax, and hepatitis B vaccinations an individual in this cohort may have received are found in Supplementary Table 1. Detailed vaccination history (Table 1) was available for AVA or hepatitis B vaccination for 100% of individuals tested for PA or HBs antibody, respectively. Of those tested for measles, mumps, tetanus, and pertussis antibody levels, 75.5% (1019/1350), 74.1% (1000/1350), 85.9% (1159/1350), and 0.4% (6/1350) had detailed vaccination histories for the respective vaccine. Acellular pertussis vaccines were introduced in the 1990’s. Only 1.8% (24/1350) of this cohort was less than 1 year old in 1990, suggesting the vast majority received at least one dose of whole-cell pertussis vaccination.
Table 1.
Cohort Vaccination History and Response
| Measles n = 1350 |
Mumps n = 1350 |
Tetanus n = 1350 |
Pertussis n = 1350 |
AVA n = 1465 |
HBs n = 931 |
|
|---|---|---|---|---|---|---|
| Age at Last Vaccination (Years) | ||||||
| Average (SD) | 23.1 (6.4) | 23.2 (6.5) | 25.6 (7.4) | n/a | 28.4 (7.2) | 26.0 (6.1) |
| Median | 21.1 | 21.2 | 23.3 | n/a | 26.6 | 24.6 |
| Range | 0.2–52.7 | 0.2–52.7 | 15.1–56.6 | n/a | 16.2–60.8 | 12.5–54.8 |
| Years Since Last Vaccination | ||||||
| Average (SD) | 6.9 (4.6) | 6.8 (4.5) | 4.1 (2.5) | n/a | 1.4 (1.3) | 4.4 (3.7) |
| Median | 5.5 | 5.4 | 3.7 | n/a | 0.8 | 3.2 |
| Range | 0.0–29.4 | 0.0–29.4 | 0.0–16.5 | n/a | 0.0–10.4 | 0–22.4 |
| Military-Recorded Vaccinations | ||||||
| Average (SD) | 1.2 (0.6) | 1.2 (0.5) | 1.5 (0.8) | n/a | 4.8 (1.7) | 3.2 (0.5) |
| Median | 1 | 1 | 1 | n/a | 4 | 3 |
| Range | 1–10 | 1–8 | 1–10 | n/a | 3–12 | 3–7 |
|
| ||||||
| Response | IU/mL | Index | IU/mL | IU/mL | μg/mL | IU/L |
|
| ||||||
| Average (SD) | 0.60 (0.71) | 3.6 (3.7) | 3.1 (2.9) | 75.0 (75.3) | 100.0 (219.2) | 109.1 (165.2) |
| Median | 0.43 | 2.4 | 2.2 | 50.5 | 32.0 | 42.4 |
| Range | 0.01–8.4 | 0.1–37.6 | 0.1–23.4 | 0.38– 759.2 | 0.01– 3084 | 3.0–838.6 |
| % positivea | 89.6 | 87.9 | 100 | 95.3 | 23.8 | 91.4 |
| % equivocala | 0 | 2.7 | 0 | 0 | 61.8 | 0 |
Cutoffs for positive are: measles, 0.2 IU/ml; mumps, 1.1 (index, 0.9–1.1 = equivocal); tetanus, 0.1 IU/mL; pertussis, 10 IU/mL; AVA, 97.3 μg/mL (5.4–97.3 μg/mL = equivocal); HBs, 10 IU/L
2.2. Anthrax protective antigen and hepatitis B surface antigen ELISAs
Ninety-six-well microtiter plates (Corning, Lowell, MA) were coated with 1 μg/well of recombinant PA (List Biological Laboratories, Campbell, CA) or 0.02 μg/well recombinant HBs (Cell Sciences, Canton, MA). Diluted plasma was added, followed by anti-human IgG conjugate (Jackson ImmunoResearch, West Grove, PA) and para-nitrophenylphosphate substrate (Sigma-Aldrich, St. Louis, MO), with washing between steps. The optical density (OD) was detected using a Dynex MRX II microplate reader (Dynex Technologies, Chantilly, VA). Concentration of PA and HBs antibodies were calculated from standard curves of the reference sera AVR801 (BEI Resources, Manassas, VA) [27] and WHO international standard 07/164 (NIBSC, Potters Down, UK), respectively. Greater than 10 IU/L of anti-HBs is defined as positive or protected, and a good response is defined as 100 IU/L [8, 28]. Non-human primate studies estimate the level of anti-PA IgG that predicts 80% survival in the year following a 3 dose priming series varies from 5.4–97.3 μg/mL depending on the time since last vaccination [29]. Therefore, individuals with anti-PA IgG < 5.4 μg/mL, 5.4–97.3 μg/mL, and >97.3 μg/mL are considered negative, equivocal, and positive, respectively.
2.3. Measles, mumps, rubella, tetanus, and pertussis ELISAs
IgG commercial ELISAs were performed according to manufacturer protocols (measles, mumps, and rubella: Bio-Rad Laboratories, Redmond, WA; tetanus: MP Biomedicals, Philadelphia, PA; pertussis: Genway Biotech, San Diego, CA). Absorbance was read at 405 nm (measles, mumps, and rubella) or 450 nm (tetanus) against the reagent blank using a Dynex MRX II microplate reader (Dynex Technologies, Chantilly, VA), and index values or antibody concentrations were determined based on a standard curve. Per manufacturer directions, mumps and rubella index values of >1.1, 0.9–1.1, and <0.9 were considered positive, equivocal, and negative for protective levels of antibody. Greater than 0.2 IU/mL of anti-measles and greater than 0.1 IU/mL anti-tetanus were considered protected [30]. Concentration of measles and pertussis antibodies were calculated from standard curves of the WHO international standards 97/648 and 06/140 (NIBSC), respectively. Individuals of greater than 10 IU/mL anti-pertussis were considered positive [28, 31]. Individuals with optical densities outside the range of the standard curve were tested again at a higher dilution. A subset of equivocal values was run again with repeatable results.
2.4. Statistical analysis
Analyses included correlation analyses (Spearman), comparison of the medians (Mann- Whitney U), and tests of proportion (Fisher’s Exact test). Non-normal data were log transformed prior to analysis. For tests of proportion, equivocal values were included within the positive group. Analysis of predictors of vaccination response was performed for each vaccination independently and included sex, race, age at last vaccination, number of vaccinations, and time since last vaccination. Age at last vaccination is approximate and was calculated from age at sample draw. Where years post vaccination served as the predictor variable (Figure 2), log-transformed data was fitted with a linear regression. Half-life values were computed using the following equation: , where b0 is the y-intercept and b1 is the slope. A stepwise multiple regression (stepAIC, MASS package, R) was used to estimate the effect of significant variables on the log10 values of anti-PA. Estimated beta parameters are listed in Supplementary Table 2, as well as their standard errors.
Figure 2. Longevity of antibody response.
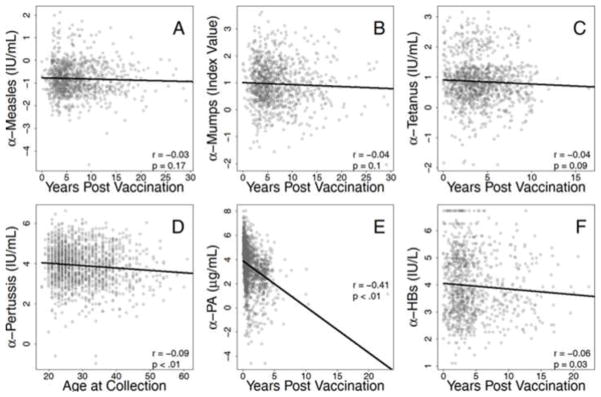
Responses to multiple antigens were determined by ELISA and tested for associations with time since most recent vaccinations. Antibody responses to measles (A), mumps (B), and tetanus (C) were not correlated with time since most recent vaccination. Plasma antibody concentration specific for pertussis (D), PA (E), and HBs (F) were all negatively associated with time since last vaccination. Spearman correlation coefficients and p values are shown for each comparison. Regression models were estimated with log-transformed data then back-transformed for presentation of raw data.
3. Results
3.1. The majority of boosted adults generate protective immunity against measles, mumps, tetanus, pertussis, hepatitis B, and PA
ELISA assays were used to assess plasma levels of antibodies against the antigens PA, measles, mumps, tetanus toxoid, pertussis, and HBs in vaccinated U.S. military personnel (total n=1465; Supplementary Figure 1, Table 1). As expected based on previous studies [7, 32, 33], these vaccines produced high levels of protection. Only 10.4% (140/1350) of samples were negative for measles antibodies (Figure 1A). Similarly, 9.4% (127/1350) of samples were negative for mumps antibodies (Figure 1B). Small percentages of samples were equivocal for mumps (2.7%, 37/1350) antibodies. Notably, individuals who did not have confirmed measles vaccination history were at increased risk of being seronegative [14.2% versus 9.1%; Fisher’s exact p=0.01, OR 1.65 (95% C.I. 1.13–2.40)]. Every tested sample (1350/1350) had protective titers of tetanus toxoid antibodies (data not shown), consistent with previous results showing that three doses of tetanus toxoid-containing vaccine protects virtually 100% of individuals from tetanus [12, 34]. Notably, more individuals than expected possessed protective levels of anti-pertussis (Figure 1C, 1286/1350, 95.3%) in this young, healthy cohort.
Figure 1. Responder frequency of measles, mumps, and AVA vaccination.

A cohort of 1465 individuals was tested for antibodies directed toward PA by ELISA. Of these, 1350 were tested for antibodies to measles virus, mumps virus, tetanus toxoid, and pertussis, and 931 were tested for antibodies to hepatitis B surface antigen (HBs) by ELISA. Shown is the percentage of individuals that were negative, positive, or equivocal for protective levels of antibody directed toward measles (A), mumps (B), pertussis (C), PA (D), PA (E), and HBs (F). Cutoffs for positive are 0.2 IU/mL for measles, 1.1 (Index Value) for mumps (0.9–1.1 = equivocal), 10 IU/mL for pertussis, 5.4 μg/mL for PA (5.4–97.3 μg/mL = equivocal), and 10 IU/L for HBs. All samples were considered fully protected by tetanus antibody level as defined by a cutoff IU/mL value of above 0.01.
Ubiquitous hepatitis B vaccination was adopted relatively recently in the U.S., and AVA is administered almost exclusively to U.S. military personnel. Therefore, only individuals known to have received full priming doses of hepatitis B (n=931) and AVA (n=1465) vaccinations were tested for antibodies to HBs and PA, respectively. Similar to previous studies [8, 9], 8.6% (80/931) of samples had less than the protective level of 10 IU/L anti-HBs (Figure 1E). As in previous studies [13, 14], measurable anti-PA was observed in the majority of individuals (Figure 1D), and the median concentration of PA IgG in all tested samples was 32.0 μg/mL. The exact level of anti-PA IgG required to protect humans against spore challenge is unknown; however, non-human primate studies estimate the level of anti-PA IgG that predicts 80% survival 0–6 months following completion of 3 priming doses varies from 5.4–97.3 μg/mL depending on the time since last vaccination [29]. If anti-PA levels can be confidently extrapolated from this primate study, only 23.8% of can be considered fully protected (>97.3 μg/mL anti-PA IgG). Importantly, this antibody level does not take into consideration other potential immune aspects of protection.
3.2. Humoral responses to tetanus toxoid, pertussis, PA, and HBs are associated with vaccination history
To determine the relative effect of vaccination schedule on vaccination failure, age at last vaccination and number of recorded vaccinations were analyzed for correlations with antibody response (Table 2). Vaccination history had no effect on measles index values or mumps index values. Tetanus antibody levels showed a weak positive correlation with age at last vaccination (r=0.05, p=0.045) and number of recorded tetanus vaccinations (r=0.08, p=0.008) (Table 2); however, these correlations were not independent, as age at last vaccination and number of recorded tetanus vaccinations were also correlated (r=0.40, p<0.001). Pertussis vaccination was not analyzed for these correlations due to low numbers of individuals with detailed vaccination history. Age at last vaccination and number of vaccinations were loosely correlated with the levels of antibodies against HBs (Table 2; r=−0.08, p=0.01 and r=0.09, p=0.005, respectively), but age at last vaccination and number of vaccinations were not correlated with each other. Finally, consistent with earlier reports [13, 14] number of vaccinations (r=0.39, p<0.001) was strongly associated with anti-PA levels (Table 2).
Table 2.
Associations of vaccination history factors and humoral responses
| Measles IU/mL | Mumps Index | Tetanus IU/mL | Pertussis IU/mL | Anthrax μg/mL | HBs IU/L | |
|---|---|---|---|---|---|---|
| Age at Last Vaccination (Years)a | r = 0.02 | r = 0.03 | r = 0.05* | n/a | r = 0.08** | r = − 0.08* |
| Military-recorded Vaccinationsa | r = 0.03 | r = 0.03 | r = 0.08** | n/a | r = 0.39*** | r = 0.09** |
| Years Since Last Vaccinationa | r = − 0.03 | r = − 0.04 | r = − 0.04 | r = − 0.09**,b | r = − 0.41** | r = − 0.06* |
r values are calculated with Spearman’s correlation.
p<0.05,
p<0.01,
p<0.001
Age at sample collection was used as an approximation of years since last vaccination
To characterize the longevity of antibody responses to multiple vaccinations, time since most recent vaccination was analyzed to determine correlation with antibody response (Table 2), half-life of antibody levels (Table 3), and the estimated time of protection elicited by last vaccination (Table 3). Measles, mumps, and tetanus antibody levels were long-lived, demonstrating no association with years since last vaccination (Figure 2A–C). Pertussis (r=−0.09, p<0.01), PA (r=−0.41, p<0.01), and HBs (r=−0.06, p=0.03) antibody levels were modestly associated with time since last vaccination (Figure 2D–F). Similar to previous studies [30], the half-lives of measles and mumps antibody was estimated to be over 90 years (Table 3). Surprisingly, tetanus and hepatitis B antibody half-lives were over 30 years. The estimated half-life of each antibody response as well the estimated time required for antibody levels to decline to non-protective levels after vaccination (range: 6–240 years after last vaccination) are presented in Table 3.
Table 3.
Antibody longevity
| Measles IU/mL | Mumps Index | Tetanus IU/mL | Pertussis IU/mL | Anthrax μg/mL | HBs IU/L | |
|---|---|---|---|---|---|---|
| Half-life (years) | 123.4 | 93.4 | 51.6 | 76.1a | 1.8 | 33.2 |
| Years to decline to seronegativeb | 150.3 | 150.4 | 236.6 | 164.5a | 5.8 | 84.0 |
Age at sample collection was used as an approximation of years since last vaccination
Cutoffs for seronegative are: measles, 0.2 IU/mL; mumps, 0.9 index; tetanus, 0.1 IU/mL; pertussis, 10 IU/mL; AVA, 5.4 μg/mL; HBs, 10 IU/L
3.3. Humoral responses to PA are associated with race
Previous studies, including those of influenza, tetanus, hepatitis B, human immunodeficiency virus, and anthrax vaccination have shown that age, race, and gender can influence vaccination response [8, 9, 11, 14, 35–38]. Therefore, we determined the effects of sex and race on humoral responses to measles, mumps, tetanus, pertussis, AVA, and hepatitis B vaccinations (Table 4). Among all study participants, 88.9% (1303/1465) were male, and 68.0% (996/1465) were European-American (EA).
Table 4.
Associations of demographic factors and humoral responses
| Measles IU/mL | Mumps Index | Tetanus IU/mL | Pertussis IU/mL | Anthrax μg/mL | HBs IU/L | |
|---|---|---|---|---|---|---|
| Sexa | M: 0.43 (0.28–0.67) | M: 2.36 (1.47–4.15) | M: 2.22 (1.53–3.22) | M: 52.5 (28.3–96.8) | M: 34.5 (11.3–93.0) | M: 42.4 (21.4–122) |
| F: 0.43 (0.26–0.64) | F: 2.53* (1.76–4.79) | F: 2.42 (1.60–3.19) | F: 39.9* (19.2–89.4) | F: 18.6*** (8.3–43.1) | F: 45.5 (21.4–145) | |
| Race/Ancestrya | AA: 0.43 (0.28–0.77) | AA: 2.60 (1.64–19.5) | AA: 2.31 (1.53–3.16) | AA: 51.5 (29.9–95.1) | AA: 22.1 (9.6–48.5) | AA: 44.40 (20.3–160) |
| EA: 0.43 (0.28–0.64) | EA: 2.24 (1.43–4.15) | EA: 2.21 (1.51–3.18) | EA: 49.5 (26.6–96.8) | EA: 35.8*** (11.1–97.0) | EA: 42.40 (21.4–122) |
Abbreviations: AA, African American; EA, European American
Median antibody values are compared by Mann-Whitney U.
p<0.05,
p<0.001. Parenthetical numbers are 25–75 percentiles.
The responses to measles, mumps, tetanus, and hepatitis B vaccination were mildly affected or unaffected by sex and race (Table 4). Males were more likely than females to be seronegative against mumps [10.0% versus 4.2%; OR 2.5 (95% C.I. 1.1–5.9); Fisher’s exact p=0.02], and males had lower median mumps antibody index values than females (2.36 versus 2.53, p<0.05 by Mann-Whitney U, Table 4). Interestingly, females had lower levels of pertussis antibody than males (39.9 IU/mL versus 52.5, p<0.05 by Mann-Whitney U), and were more likely to be seronegative [9.8% versus 4.1%; Fisher’s exact p=0.006, OR 2.5 (95% C.I. 1.4–4.7)]. Neither the rates of seropositivity nor levels of measles, tetanus, and HBs antibodies were affected by tested demographic factors. Together, these data suggest that measles, mumps, tetanus, pertussis, and hepatitis B vaccines elicit robust responses regardless of the race of the vaccinee, but sex may affect vaccination response.
In contrast, both sex and race initially appeared to influence the response to AVA (Table 4). Males were more likely to have a high (>97.3 μg/mL) PA antibody concentration [25.0% versus 14.2%; OR 2.0 (95% C.I. 1.3–3.1); Fisher’s exact p=0.002] and had higher median levels of anti-PA than females (34.5 versus 18.6, p<0.001 by Mann-Whitney U). Median anti-PA responses were lower in African Americans (AA) than in EA (22.1 versus 35.8 μg/mL anti-PA, p=0.0001), and AA were less likely to have a high (>97.3 μg/mL) PA antibody concentration [13.7% versus 25.7%; OR 0.46 (95% C.I. 0.29–0.71); Fisher’s exact p<0.001]. These results are consistent with previous results from our laboratory and others showing that EA individuals have an increased antibody response to AVA relative to AA individuals [11, 14]. Since multiple vaccination history and demographic variables were associated with PA antibody levels, we performed multiple regression including the variables age, time post vaccination, number of vaccinations, sex, and race (Supplementary Table 2). In this multiple regression analysis, only time post vaccination, number of vaccinations, and race remained significantly associated with PA antibody levels. When controlling for time post-vaccination and number of vaccinations, the expected level of anti-PA in EA individuals was 9.5 μg/mL higher than that in AA individuals (30.9 μg/mL vs. 21.9 μg/mL; p<0.01). In contrast to the other vaccinations tested, these results suggest the AVA response is substantially affected by race.
3.4. Vaccine responses to measles, mumps, and tetanus are correlated
A small number of studies have suggested correlations between responses to multiple immunogens within a primary vaccination in children [7, 26]. We therefore first determined if responders to one vaccine were more likely to respond to another vaccination compared to non-responders. Individuals who did not demonstrate seroconversion against measles were more likely to not seroconvert against mumps than those who were seropositive for measles antibodies [OR 4.5 (95% C.I. 2.9–6.9); Fisher’s Exact p<0.001]. Next, we analyzed whether the antibody levels for different vaccinations were associated. The strongest correlation between vaccination responses was found between measles and mumps antibody levels (Figure 3A, Spearman r=0.31, p<0.001). Associations were also found between tetanus and measles (Figure 3B, r=0.11, p<0.001) and tetanus mumps antibody levels (Figure 3C, r=0.11, p<0.001). Loose correlations were observed between mumps and PA antibody levels (Figure 3D, r=−0.10, p<0.001) and pertussis and PA antibody levels (Figure 3E, r=0.07, p=0.01), although these are unlikely to be biologically relevant. Interestingly, individuals seronegative for pertussis were more likely to be seronegative for PA [<5.4 μg/ml; OR 3.9 (95% C.I. 2.2–7.1); Fisher’s Exact p<0.001].
Figure 3. Mumps, measles, and tetanus antibody responses are all positively correlated.

Antibody responses to multiple antigens were tested for associations. Shown are comparisons between antibody levels specific for measles and mumps (A), measles and tetanus (B), mumps and tetanus (C), mumps and PA (D), pertussis and PA (E), and rubella and measles. Spearman correlation coefficients and p values are shown for each comparison, along with linear regression lines for ease of visualization. HBs antibody was not correlated with measles, mumps, or tetanus antibody levels (all Spearman r<0.06, all p>0.1). All variables are log10 transformed. Each symbol represents a single plasma sample.
To ensure individuals seronegative for measles or mumps had in fact received MMR, samples that were negative for antibodies against measles (n=52), mumps (n=106), or both (n=21), as well as a group of individuals positive for both (n=80), were tested for rubella antibodies, another component of the vaccine. An overall seronegativity rate for rubella was 4.2% (11/259, data not shown). No difference was found in the rate of rubella seronegativity between any of these groups (Fisher’s exact test, all p>0.05). Interestingly, rubella index values had a trend toward correlation with measles index values (Figure 3F, r=0.11, p=0.07).
4. Discussion
The development of vaccines has dramatically altered modern health by reducing morbidity and mortality of many infections, and vaccination remains the most powerful weapon available against many pathogens [39]. However, vaccination in the U.S. is uncommon in adults; roughly 50% of adults do not receive recommended boosters, perhaps due to a misconception that childhood immunization induces lifelong immunity [5]. The ability to identify low responders and adapt vaccinations to elicit better responses in these individuals could both protect susceptible individuals and minimize available reservoirs of communicable disease. As a first step toward this goal, we characterized the humoral responses to six vaccinations in a large cohort of healthy adult individuals and assessed whether vaccine responses could be predicted by vaccination history, demographic factors, or responses to other vaccines.
Seropositivity rates for measles and mumps were moderately lower than expected with documented booster vaccinations [7, 32, 33], and this observation was not explained by vaccination history or demographic factors. The general population is less likely than this military cohort to receive the MMR booster, and the prevalence of measles infection is increasing [40]. In January–April of 2014, 129 cases of measles were reported in the U.S.; California reported the highest number of reported cases since 1995 and a full 19% (11/58) of these occurred in vaccinated individuals [41]. These findings underscore the need for understanding factors that dampen vaccine responses. Furthermore, administration of measles and mumps booster vaccinations in adulthood may need to be emphasized and adults may need closer monitoring for this humoral immunity. This approach was recently taken for pertussis, where a steady increase in pertussis cases lead to a vaccination program targeted at 11–18-year-olds, resulting in a steep decrease in the incidence of pertussis in this age group [42]. Interesting, the vast majority of our cohort was seropositive for pertussis antibody. This may be due to the age of the cohort; the overwhelming majority of individuals was born in the 1980’s or before, and would have received the whole-cell pertussis vaccination, known to induce longer-lived immunity [2, 10].
With the exception of PA antibody levels, number of vaccinations and years since last vaccination, age at last vaccination, and race were not strongly predictive of antibody response to a given vaccination (Tables 2 & 4). Indeed, half-life values for all antibody responses but PA were over 30 years. Notably, the half-life of tetanus and hepatitis B antibody was slightly longer than previously reported, while measles and mumps antibody half-lives were slightly shorter [30]. Females appeared to respond better than males to mumps, yet worse than males to pertussis. These data are in contrast to many studies that have found that females, in general, respond better to vaccinations [8, 9, 38]. The effect of race is more varied in the literature, with African Americans responding better or worse than other ethnic groups depending on the vaccine [30–32]. While there may have been insufficient power to find a population effect of sex or race for most vaccinations due to the small numbers of females and non-EA individuals in our cohort, our finding that increasing age loosely correlates with poorer response to hepatitis B vaccination agrees with earlier reports [8]. The minor associations of vaccination history and demographics with vaccination response, as well as the longevity of most antibody responses (Table 3), suggest that in general, receiving the recommended number of vaccinations generates a long-lived and protective response regardless of race, sex, and age in this younger, healthy cohort.
Responses to vaccinations are generally assumed to be both immunization- and antigen-specific, with the exception of immunocompromised individuals. Immunizations given together are not though to affect each other. Indeed, in a study of four individuals vaccinated with vaccinia, only vaccinia antibodies were shown to increase; baseline levels of responses to multiple vaccinations were not analyzed for correlations [30]. However, our data demonstrate an association between measles and mumps antibody index levels, the first description of such a predictive correlation between measles and mumps response in adults. Furthermore, our results provide the first evidence, to our knowledge, that the tetanus vaccine response is correlated with responses to measles and mumps vaccination.
Several potential reasons could explain why responses to different vaccinations could be correlated. First, vaccination responses could be affected by environmental factors at the time of vaccination, such as the physiologic stress level and overall health status of an individual at the time of vaccination. In this cohort, measles and mumps were given at the same time (as MMR) in 96% of subjects, and 68% of the last recorded tetanus vaccinations in this cohort were given on the same day as a measles and/or mumps vaccine, strongly supporting the possibility that the environment of an individual may have a broad effect on vaccine response. Second, vaccination responses may be influenced by genetic variations that influence overall immunity. As opposed to HLA alleles, which have been associated with skewed presentation of antigens and therefore responsiveness to individual vaccinations [17, 18, 43–45], genes that are virus- or inflammation-specific could theoretically affect more than one vaccine response. Associations between non-HLA genes and vaccine responses have only just begun to be explored [19, 46], but confirmation of non-HLA genetic associations may allow for improved individualization of vaccinations. Finally, an individual could have similar responses to vaccines with similar formulations. This is unlikely to explain the observed correlations, as the tetanus vaccine is remarkably different from live-attenuated MMR and we saw no correlations between the alum- and protein- containing tetanus, hepatitis B, and AVA vaccines.
Ultimately, these results suggest that certain factors which affect vaccine responses may be more general than previously thought. Certain gene polymorphisms or expression levels and environmental factors may impact whether a vaccinee is a high or low responder and potentially the duration of immunity. Discriminating high versus low responders may enable future personalized medicine guidelines that allow less frequent immunization for protected individuals and the potential to suggest boosters for those that are not.
Supplementary Material
1350 individuals were tested for antibodies to measles virus (A), mumps virus (B), tetanus toxoid (C), and whole pertussis (D); 1465 individuals were tested for PA antibody levels (E); and 931 individuals were tested for antibody directed toward hepatitis B surface antigen (F). Shown are the log10 transformed antibody levels as calculated against standard curves, along with means and standard deviations. Each symbol indicates a single individual; dashed lines indicate the cutoff value for seropositivity or protection for each test. For PA (E), the range of equivocal values in indicated by two dashed lines.
Highlights.
Measles and mumps seropositivity rates are lower than expected in boosted adults
Vaccination history and demographics are associated with AVA response
Vaccination history is loosely associated with tetanus and HBs response
Gender is loosely associated with mumps and pertussis response
Antibody levels to measles, mumps, and tetanus are correlated
Acknowledgments
This work was supported by the National Institute of Allergy and Infectious Disease (NIAID) [U19AI062629] and [T32AI007633] and the National Institute of General Medical Sciences [P30GM103510, U54GM104938], as well as the OMRF J. Donald and Patricia Capra Fellowship and the OMRF Lou C. Kerr Chair in Biomedical Research.
We thank the participants of this study, the Walter Reed National Military Medical Center Military Vaccine Agency-Vaccine Healthcare Centers Network/Allergy-Immunology Research Team (particularly Kaureen L. Langlie, RN, Connie L. Lohsl, RN, Laurie L. Duran, APRN, Jeannette F. Williams, FNP) and the regional Vaccine Healthcare Center Fort Bragg Research Team (particularly, Nora L. Rachels, Nancy C. Blacker, FNP, Bruce M. McClenathan, MD). We thank J. Donald Capra, MD, and Julie Robertson, PhD for scientific and manuscript input and editing, Dustin Fife for statistical analysis, and Clayton Nelson, Linda Ash, Emily McKee, and Jennifer Muther for technical assistance.
The opinions and assertions contained herein are private views of the authors and are not to be construed as official or as reflecting the official views of the Department of Defense, Department of the Army, National Institutes of Health (NIH), or other government agencies.
Local protocol development and management was supported by Walter Reed National Military Medical Center Vaccine Healthcare Centers Network/Allergy-Immunology Department and Womack Army Medical Center, Fort Bragg Regional VHC. Human anti-AVA reference serum (AVR801, NR-719) was obtained through the National Institutes of Health Biodefense and Emerging Infections Research Repository, NIAID, NIH.
Abbreviations
- MMR
measles, mumps, and rubella vaccine
- Td/Tdap
tetanus vaccines
- HBs
hepatitis B surface antigen
- AVA
Anthrax vaccine adsorbed
- PA
protective antigen
- AA
African Americans
- EA
European Americans
- OD
optical density
- SD
standard deviations
Footnotes
Conflict of interest statement
S.R. Crowe is now affiliated with PharmAthene, Inc; however, her work with this study was only completed during her time at OMRF. All other authors declare that there are no conflicts of interest.
References
- 1.Poland GA, Ovsyannikova IG, Jacobson RM. Personalized vaccines: the emerging field of vaccinomics. Expert Opin Biol Ther. 2008;8:1659–67. doi: 10.1517/14712598.8.11.1659. [DOI] [PMC free article] [PubMed] [Google Scholar]
- 2.Shapiro ED. Acellular vaccines and resurgence of pertussis. JAMA. 2012;308:2149–50. doi: 10.1001/jama.2012.65031. [DOI] [PubMed] [Google Scholar]
- 3.Cherry JD. The epidemiology of pertussis: a comparison of the epidemiology of the disease pertussis with the epidemiology of Bordetella pertussis infection. Pediatrics. 2005;115:1422–7. doi: 10.1542/peds.2004-2648. [DOI] [PubMed] [Google Scholar]
- 4.Centers for Disease C and Prevention. Advisory Committee on Immunization Practices (ACIP) recommended immunization schedules for persons aged 0 through 18 years and adults aged 19 years and older--United States, 2013. Morbidity and mortality weekly report Surveillance summaries. 2013;62 (Suppl 1):1. [Google Scholar]
- 5.Centers for Disease C and Prevention. Noninfluenza vaccination coverage among adults - United States, 2011. MMWR Morb Mortal Wkly Rep. 2013;62:66–72. [PMC free article] [PubMed] [Google Scholar]
- 6.Grabenstein JD, Pittman PR, Greenwood JT, Engler RJ. Immunization to protect the US Armed Forces: heritage, current practice, and prospects. Epidemiol Rev. 2006;28:3–26. doi: 10.1093/epirev/mxj003. [DOI] [PubMed] [Google Scholar]
- 7.St Sauver JL, Jacobson RM, Vierkant RA, Jacobsen SJ, Green EM, Schaid DJ, et al. Correlations between measles, mumps, and rubella serum antibody levels in Olmsted County school children. Vaccine. 2001;19:1363–8. doi: 10.1016/s0264-410x(00)00376-5. [DOI] [PubMed] [Google Scholar]
- 8.Westmoreland D, Player V, Heap DC, Hammond A. Immunization against hepatitis B--what can we expect? Results of a survey of antibody response to immunization in persons ‘at risk’ of occupational exposure to hepatitis B. Epidemiology and infection. 1990;104:499–509. doi: 10.1017/s0950268800047506. [DOI] [PMC free article] [PubMed] [Google Scholar]
- 9.Heron LG, Chant KG, Jalaludin BB. A novel hepatitis B vaccination regimen for adolescents: two doses 12 months apart. Vaccine. 2002;20:3472–6. doi: 10.1016/s0264-410x(02)00346-8. [DOI] [PubMed] [Google Scholar]
- 10.Cherry JD. Why do pertussis vaccines fail? Pediatrics. 2012;129:968–70. doi: 10.1542/peds.2011-2594. [DOI] [PubMed] [Google Scholar]
- 11.Marano N, Plikaytis BD, Martin SW, Rose C, Semenova VA, Martin SK, et al. Effects of a reduced dose schedule and intramuscular administration of anthrax vaccine adsorbed on immunogenicity and safety at 7 months: a randomized trial. JAMA. 2008;300:1532–43. doi: 10.1001/jama.300.13.1532. [DOI] [PubMed] [Google Scholar]
- 12.Tetanus vaccine. Wkly Epidemiol Rec. 2006;81:198–208. [PubMed] [Google Scholar]
- 13.Crowe SR, Ash LL, Engler RJ, Ballard JD, Harley JB, Farris AD, et al. Select human anthrax protective antigen epitope-specific antibodies provide protection from lethal toxin challenge. Journal of Infectious Diseases. 2010;202:251–60. doi: 10.1086/653495. [DOI] [PMC free article] [PubMed] [Google Scholar]
- 14.Crowe SR, Garman L, Engler RJ, Farris AD, Ballard JD, Harley JB, et al. Anthrax vaccination induced anti-lethal factor IgG: Fine specificity and neutralizing capacity. Vaccine. 2011;29:3670–8. doi: 10.1016/j.vaccine.2011.03.011. [DOI] [PMC free article] [PubMed] [Google Scholar]
- 15.Jacobson RM, Poland GA. The genetic basis for measles vaccine failure. Acta Paediatr Suppl. 2004;93:43–6. doi: 10.1111/j.1651-2227.2004.tb03055.x. discussion 6–7. [DOI] [PubMed] [Google Scholar]
- 16.Ceyhan M, Kanra G, Erdem G, Kanra B. Immunogenicity and efficacy of one dose measles-mumps-rubella (MMR) vaccine at twelve months of age as compared to monovalent measles vaccination at nine months followed by MMR revaccination at fifteen months of age. Vaccine. 2001;19:4473–8. doi: 10.1016/s0264-410x(01)00207-9. [DOI] [PubMed] [Google Scholar]
- 17.Desombere I, Willems A, Leroux-Roels G. Response to hepatitis B vaccine: multiple HLA genes are involved. Tissue Antigens. 1998;51:593–604. doi: 10.1111/j.1399-0039.1998.tb03001.x. [DOI] [PubMed] [Google Scholar]
- 18.Alper CA, Kruskall MS, Marcus-Bagley D, Craven DE, Katz AJ, Brink SJ, et al. Genetic prediction of nonresponse to hepatitis B vaccine. N Engl J Med. 1989;321:708–12. doi: 10.1056/NEJM198909143211103. [DOI] [PubMed] [Google Scholar]
- 19.Kennedy RB, Ovsyannikova IG, Haralambieva IH, O’Byrne MM, Jacobson RM, Pankratz VS, et al. Multigenic control of measles vaccine immunity mediated by polymorphisms in measles receptor, innate pathway, and cytokine genes. Vaccine. 2012;30:2159–67. doi: 10.1016/j.vaccine.2012.01.025. [DOI] [PMC free article] [PubMed] [Google Scholar]
- 20.Lu J, He R, Dong M, Zhang L, Wang X. Immunological dynamics in response to two anthrax vaccines in mice. Sci China C Life Sci. 2008;51:872–8. doi: 10.1007/s11427-008-0119-4. [DOI] [PubMed] [Google Scholar]
- 21.Davila S, Froeling FE, Tan A, Bonnard C, Boland GJ, Snippe H, et al. New genetic associations detected in a host response study to hepatitis B vaccine. Genes Immun. 2010;11:232–8. doi: 10.1038/gene.2010.1. [DOI] [PubMed] [Google Scholar]
- 22.Burns VE, Drayson M, Ring C, Carroll D. Perceived stress and psychological well-being are associated with antibody status after meningitis C conjugate vaccination. Psychosom Med. 2002;64:963–70. doi: 10.1097/01.psy.0000038936.67401.28. [DOI] [PubMed] [Google Scholar]
- 23.Edwards KM, Burns VE, Adkins AE, Carroll D, Drayson M, Ring C. Meningococcal A vaccination response is enhanced by acute stress in men. Psychosom Med. 2008;70:147–51. doi: 10.1097/PSY.0b013e318164232e. [DOI] [PubMed] [Google Scholar]
- 24.Brydon L, Walker C, Wawrzyniak AJ, Chart H, Steptoe A. Dispositional optimism and stress-induced changes in immunity and negative mood. Brain Behav Immun. 2009;23:810–6. doi: 10.1016/j.bbi.2009.02.018. [DOI] [PMC free article] [PubMed] [Google Scholar]
- 25.Hollinger FB. Factors influencing the immune response to hepatitis B vaccine, booster dose guidelines, and vaccine protocol recommendations. The American journal of medicine. 1989;87:36S–40S. doi: 10.1016/0002-9343(89)90530-5. [DOI] [PubMed] [Google Scholar]
- 26.Pebody RG, Gay NJ, Hesketh LM, Vyse A, Morgan-Capner P, Brown DW, et al. Immunogenicity of second dose measles-mumps-rubella (MMR) vaccine and implications for serosurveillance. Vaccine. 2002;20:1134–40. doi: 10.1016/s0264-410x(01)00435-2. [DOI] [PubMed] [Google Scholar]
- 27.Quinn CP, Semenova VA, Elie CM, Romero-Steiner S, Greene C, Li H, et al. Specific, sensitive, and quantitative enzyme-linked immunosorbent assay for human immunoglobulin G antibodies to anthrax toxin protective antigen. Emerg Infect Dis. 2002;8:1103–10. doi: 10.3201/eid0810.020380. [DOI] [PMC free article] [PubMed] [Google Scholar]
- 28.Plotkin SA. Correlates of protection induced by vaccination. Clin Vaccine Immunol. 2010;17:1055–65. doi: 10.1128/CVI.00131-10. [DOI] [PMC free article] [PubMed] [Google Scholar]
- 29.Quinn CP, Sabourin CL, Niemuth NA, Li H, Semenova VA, Rudge TL, et al. A three-dose intramuscular injection schedule of anthrax vaccine adsorbed generates sustained humoral and cellular immune responses to protective antigen and provides long-term protection against inhalation anthrax in rhesus macaques. Clin Vaccine Immunol. 2012;19:1730–45. doi: 10.1128/CVI.00324-12. [DOI] [PMC free article] [PubMed] [Google Scholar]
- 30.Amanna IJ, Carlson NE, Slifka MK. Duration of humoral immunity to common viral and vaccine antigens. N Engl J Med. 2007;357:1903–15. doi: 10.1056/NEJMoa066092. [DOI] [PubMed] [Google Scholar]
- 31.Edelman K, He Q, Makinen J, Sahlberg A, Haanpera M, Schuerman L, et al. Immunity to pertussis 5 years after booster immunization during adolescence. Clin Infect Dis. 2007;44:1271–7. doi: 10.1086/514338. [DOI] [PubMed] [Google Scholar]
- 32.Brunell PA, Weigle K, Murphy MD, Shehab Z, Cobb E. Antibody response following measles-mumps-rubella vaccine under conditions of customary use. JAMA. 1983;250:1409–12. [PubMed] [Google Scholar]
- 33.Hutchins SS, Bellini WJ, Coronado V, Jiles R, Wooten K, Deladisma A. Population immunity to measles in the United States, 1999. J Infect Dis. 2004;189 (Suppl 1):S91–7. doi: 10.1086/377713. [DOI] [PubMed] [Google Scholar]
- 34.Hainz U, Jenewein B, Asch E, Pfeiffer KP, Berger P, Grubeck-Loebenstein B. Insufficient protection for healthy elderly adults by tetanus and TBE vaccines. Vaccine. 2005;23:3232–5. doi: 10.1016/j.vaccine.2005.01.085. [DOI] [PubMed] [Google Scholar]
- 35.Montefiori DC, Metch B, McElrath MJ, Self S, Weinhold KJ, Corey L. Demographic factors that influence the neutralizing antibody response in recipients of recombinant HIV-1 gp120 vaccines. J Infect Dis. 2004;190:1962–9. doi: 10.1086/425518. [DOI] [PubMed] [Google Scholar]
- 36.Gardner EM, Gonzalez EW, Nogusa S, Murasko DM. Age-related changes in the immune response to influenza vaccination in a racially diverse, healthy elderly population. Vaccine. 2006;24:1609–14. doi: 10.1016/j.vaccine.2005.09.058. [DOI] [PubMed] [Google Scholar]
- 37.Christy C, Pichichero ME, Reed GF, Decker MD, Anderson EL, Rennels MB, et al. Effect of gender, race, and parental education on immunogenicity and reported reactogenicity of acellular and whole-cell pertussis vaccines. Pediatrics. 1995;96:584–7. [PubMed] [Google Scholar]
- 38.Engler RJ, Nelson MR, Klote MM, VanRaden MJ, Huang CY, Cox NJ, et al. Half- vs full-dose trivalent inactivated influenza vaccine (2004–2005): age, dose, and sex effects on immune responses. Arch Intern Med. 2008;168:2405–14. doi: 10.1001/archinternmed.2008.513. [DOI] [PubMed] [Google Scholar]
- 39.Phillips AC, Gallagher S, Carroll D, Drayson M. Preliminary evidence that morning vaccination is associated with an enhanced antibody response in men. Psychophysiology. 2008;45:663–6. doi: 10.1111/j.1469-8986.2008.00662.x. [DOI] [PubMed] [Google Scholar]
- 40.Centers for Disease C and Prevention. Measles - United States, 2011. MMWR Morb Mortal Wkly Rep. 2012;61:253–7. [PubMed] [Google Scholar]
- 41.Zipprich J, Hacke JK, Murray EL, Xia D, Harriman K, Glase C, et al. Notes from the field: measles - california, january 1–april 18, 2014. MMWR Morb Mortal Wkly Rep. 2014;63:362–3. [PMC free article] [PubMed] [Google Scholar]
- 42.Skoff TH, Cohn AC, Clark TA, Messonnier NE, Martin SW. Early Impact of the US Tdap vaccination program on pertussis trends. Archives of pediatrics & adolescent medicine. 2012;166:344–9. doi: 10.1001/archpediatrics.2011.1093. [DOI] [PubMed] [Google Scholar]
- 43.Pajewski NM, Parker SD, Poland GA, Ovsyannikova IG, Song W, Zhang K, et al. The role of HLA-DR-DQ haplotypes in variable antibody responses to anthrax vaccine adsorbed. Genes Immun. 2011;12:457–65. doi: 10.1038/gene.2011.15. [DOI] [PMC free article] [PubMed] [Google Scholar]
- 44.Ovsyannikova IG, Jacobson RM, Vierkant RA, Jacobsen SJ, Pankratz VS, Poland GA. Human leukocyte antigen class II alleles and rubella-specific humoral and cell-mediated immunity following measles-mumps-rubella-II vaccination. J Infect Dis. 2005;191:515–9. doi: 10.1086/427558. [DOI] [PubMed] [Google Scholar]
- 45.Li Y, Ni R, Song W, Shao W, Shrestha S, Ahmad S, et al. Clear and independent associations of several HLA-DRB1 alleles with differential antibody responses to hepatitis B vaccination in youth. Hum Genet. 2009;126:685–96. doi: 10.1007/s00439-009-0720-z. [DOI] [PMC free article] [PubMed] [Google Scholar]
- 46.Pan L, Zhang W, Liang Z, Wu X, Zhu X, Li J, et al. Association between polymorphisms of the cytokine and cytokine receptor genes and immune response to hepatitis B vaccination in a Chinese Han population. J Med Virol. 2012;84:26–33. doi: 10.1002/jmv.22251. [DOI] [PubMed] [Google Scholar]
Associated Data
This section collects any data citations, data availability statements, or supplementary materials included in this article.
Supplementary Materials
1350 individuals were tested for antibodies to measles virus (A), mumps virus (B), tetanus toxoid (C), and whole pertussis (D); 1465 individuals were tested for PA antibody levels (E); and 931 individuals were tested for antibody directed toward hepatitis B surface antigen (F). Shown are the log10 transformed antibody levels as calculated against standard curves, along with means and standard deviations. Each symbol indicates a single individual; dashed lines indicate the cutoff value for seropositivity or protection for each test. For PA (E), the range of equivocal values in indicated by two dashed lines.