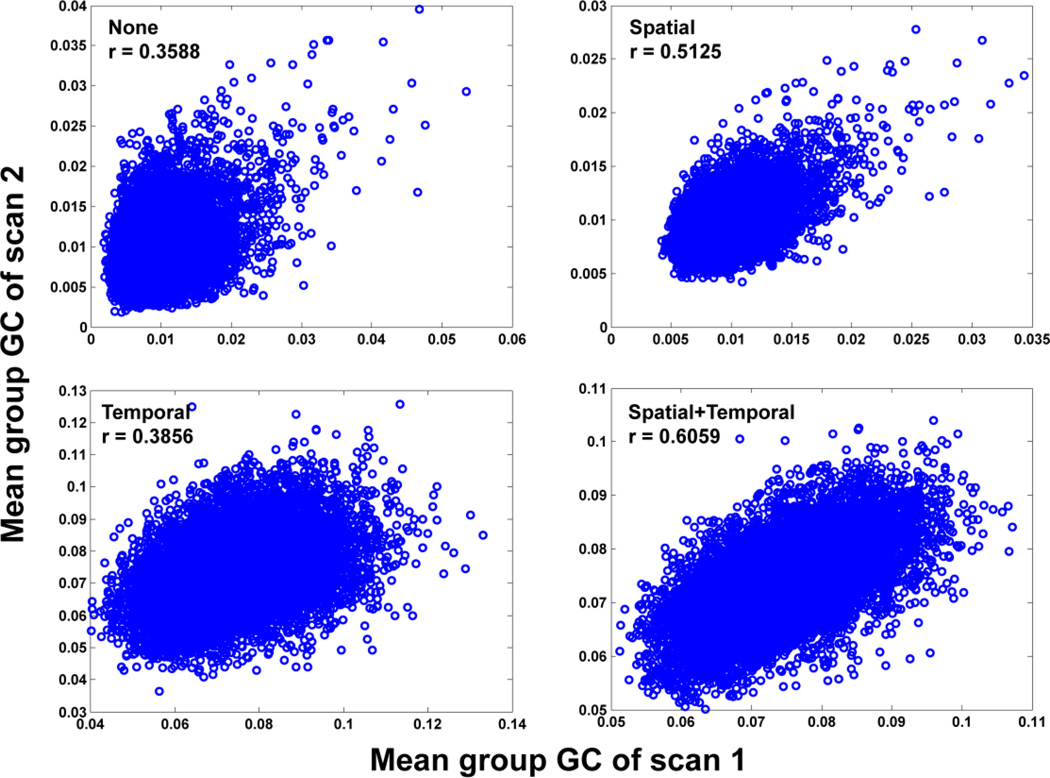
Figure 5.
Correlation between the Granger causality between two series of scans for the same set of subjects. The causality measurements were calculated through different methods: (A) traditional Granger causality, (B) voxel-level Granger causality, (C) average Granger causality, and (D) spatio-temporal Granger causality.

