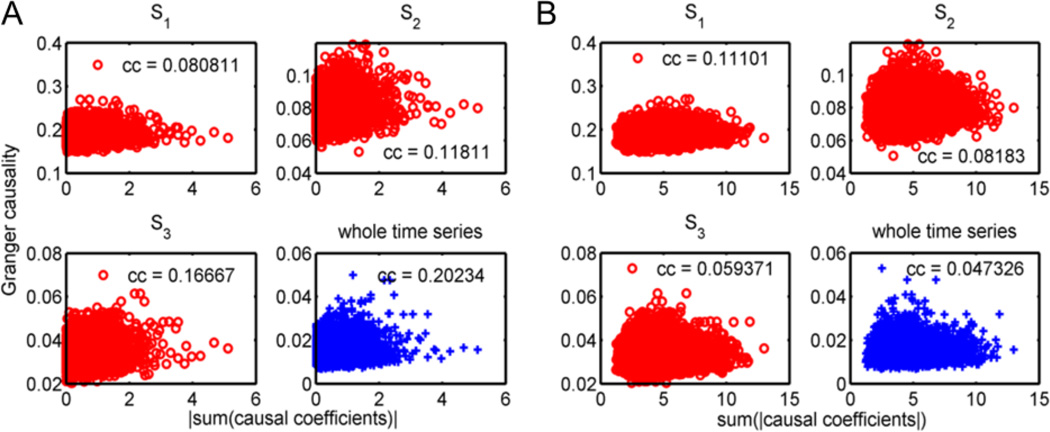
Figure 7.
Granger causality versus the sum of the causal coefficients across time windows. The causal coefficients were estimated for each time window defined by S1 for each subject. The medians of the causality among 198 subjects were established using different change-point sets, including S1, S2, S3, and the whole time series without a change-point (specified as the titles for subplots in the figure). Different change-point sets gave different Granger causality values, since the Granger causality value increased as the time window lengths decreased. (A) Correlation to the absolute value of the median of the sums of the causal coefficients over all time windows. (B) Correlation to the median of the sums of the absolute values of the causal coefficients over all time windows. The p-values for all correlations are below the significant threshold.

