

Abstract
Glycan structure alterations during cancer regulate disease progression and represent clinical biomarkers. The study determined the degree to which changes in glycosyl transferase activities during cancer can be related to aberrant cell-surface tumor associated carbohydrate structures (TACA). To this end, changes in sialyltransferase (sialylT), fucosyltransferase (fucT) and galactosyltransferase (galT) activity were measured in normal and tumor tissue using a miniaturized enzyme activity assay and synthetic glycoconjugates bearing terminal LacNAc Type-I (Galβ1,3GlcNAc), LacNAc Type-II (Galβ1,4GlcNAc), and mucin core-1/Type-III (Galβ1,3GalNAc) structures. These data were related to TACA using tissue microarrays containing 115 breast and 26 colon cancer specimen. The results show that primary human breast and colon tumors, but not adjacent normal tissue, express elevated β1,3 galT and α2,3sialylT activity that can form α2,3sialylated Type-III glycans (Siaα2,3Galβ1,3GalNAc). Prostate tumors did not exhibit such elevated enzymatic activities. α1,3/4fucT activity was higher in breast, but not colon tissue. The enzymology based prediction of enhanced α2,3sialylated Type-III structures in breast tumors was verified using histochemical analysis of tissue sections and tissue microarrays. Here, the binding of two markers that recognize Galβ1,3GalNAc (peanut lectin and mAb A78-G/A7) was elevated in breast tumor, but not normal control, only upon sialidase treatment. These antigens were also upregulated in colon tumors though to a lesser extent. α2,3sialylated Type-III expression correlated inversely with patient HER2 expression and breast metastatic potential. Overall, enzymology measurements of glycoT activity predict glycan structure changes during cancer. High expression of the α2,3sialylated T-antigen O-glycans occur in breast tumors. A transformation from linear core-1 glycan to other epitopes may accompany metastasis.
Keywords: glycosyltransferase, tissue microarray, O-glycans, tumor, breast, carbohydrate
INTRODUCTION
Glycosylation is an important post-translational modification that affects the function of a majority of mammalian proteins [1]. Aberrant glycosylation is associated with cancer [2,3]. Such abnormal glycans mediate the interaction of cancer cells with the endothelium leading to angiogenesis [4] and metastasis [5]. They also facilitate tumor cell-platelet interaction during hematogeneous metastasis [6,7], and enhance tumorigenic potential through signaling pathways [8–10]. In addition to these functional roles, glycans and glycosylated proteins serve as cancer biomarkers, examples being CA-125 (ovarian cancer), CA 15-3 (breast cancer), CA 19-9 (pancreatic cancer) and carcinoembryonic antigen (CEA, colon cancer).
Studies of glycosyltransferases (glycoTs) using both gene expression analysis and enzymatic assays suggest that the glycoTs contributing to the formation of glycan core [11], branching [12] and terminal [13,11] structures may all be altered during cancer. Some of these glycoT modifications control the biosynthesis of carbohydrate antigens, like sialyl Lewis-a (sLea) and sialyl Lewis-X (sLeX) that regulate tumor cell adhesion and metastasis. The terminal enzymes regulating the formation of such glycan structures include the β1,3/4galactosyl transferases (galT), α1,3/4fucosyl transferases (fucT or FT) and α2,3sialyltransferases (sialylT). Indeed, mRNA expression analysis of sialylT and fucT in gastrointestinal carcinoma cell lines reveal the role of these enzymes during sLea and sLeX biosynthesis [14]. Similarly, the mRNA expression of these enzymes and other related genes involved in glycoprotein and proteoglycan synthesis in breast cancer tissue has been widely studied [8,15]. These studies show that the mRNA expression of ST3Gal-I, an enzyme involved in the α2,3sialylation of carbohydrate moieties in glycoprotein and glycosphingolipids, is upregulated. The mRNA levels of ST3Gal-III, another α2,3sialyltransferase, is also upregulated in later stages of breast cancer that are associated with lymph node metastasis [15]. In addition, enzymes regulating O-GlcNAcylation are elevated during breast cancer metastasis [16]. Besides gene expression, enzymatic studies that use colon and breast cancer cell lines also reveal differences in the glycoTs [11]. Limited studies have also been performed to confirm some of these findings in primary colon tumor and normal tissue [17,18]. Overall, a majority of the above studies focus on glycoT gene expression with some of these findings also being confirmed using enzymology.
Glycan structure changes during cancer have been studied using anti-carbohydrate lectins/antibodies and also mass spectrometry. Lectin based strategies have measured glycans in the serum of colon tumor patients [19], and in tumor, blood and urine samples of breast cancer patients [20]. Although such studies demonstrate differences between metastatic and non-metastatic breast cancer, the relatively broad binding specificity of lectins precludes the identification of unique changes in glycans or associated sugar linkages. Mass spectrometry based studies also shed light on structural changes between the serum of normal versus breast cancer patients [21] and also between metastatic and non-metastatic serum samples [22].
Whereas the prior works examine changes in cellular glycosylation by focusing on either enzyme analysis or glycan structure changes alone, a systematic strategy to link the two approaches is absent. To address this limitation, in the current manuscript, we determined the degree to which an analysis of glycoTs in cancer cell lines and primary patient samples can ‘predict’ putative carbohydrate epitopes that may be altered during cancer (Figure 1). Histochemical analysis using lectin and monoclonal antibody staining was performed to ‘validate’ these predictions and to draw relationships between the clinical disease indices and the altered pattern of glycosylation. Using tissue microarrays (TMAs) with 115 breast cancer patient tumors and 26 colon cancer specimen, our data is consistent with previous reports that suggest a marked upregulation of the NeuAcα2,3Galβ1,3GalNAc structure during breast cancer. Elevated levels of this antigen were also observed in selected colon tumor specimen. Among all the clinical indices analyzed, lectin/mAb staining intensity varied inversely with breast cancer metastasis. Together, the data suggest that O-linked glycans with the NeuAcα2,3Galβ1,3GalNAc may form during breast tumorigenesis and the prevalence of these truncated O-linked glycans may be reduced when tumors become metastatic.
Figure 1. Overall Scheme.
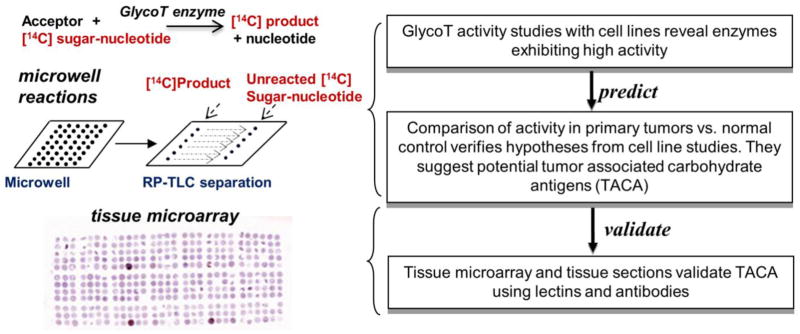
Glycosyltransferase activity assays were performed in miniaturized microwells using cell lysates as source of enzyme activity. Such studies performed using cell lines ‘predict’ activities that may be altered during cancer. These predictions are tested using human patient tumor and normal tissue samples. Glycan structures that were predicted to be altered based on glycoT activity assays are ‘validated’ using lectin and antibody based histochemical analysis of tissue microarrays and sections.
MATERIAL AND METHODS
Cell and tissue lysates for glycosyltransferase activity assays
Breast cancer cell lines ZR-75-1, MCF7, T-47D and DU4475 were cultured according to instructions provided by ATCC (Manassas, VA). Following growth, ~107 cells were pelleted and stored at −80°C.
Thirty four de-identified human frozen tissue specimens were obtained from the Roswell Park Cancer Institute (RPCI) Tissue Bank. These include primary tumors with matching, adjacent non-tumor tissue. These tissue samples were obtained from patients who had surgery at RPCI (Buffalo, NY). Following procurement, tissue samples were subjected to quality control to verify the presence of tumor or normal tissue in the sample, then de-identified, and stored in a −80°C freezer. These 34 tissue specimen represent 6 breast, 6 colon and 5 prostate tumor samples, and matched controls. Patient information was obtained using an honest broker system in a de-identified fashion (Table 1A).
Table 1.
Patient Data
| A. Enzymology assay patient data
| ||||
|---|---|---|---|---|
| Specimen | Sample ID | Cancer | Histology | Pathology Stage |
| Breast | 1 | Breast | Infiltrating duct carcinoma | IIB |
| 2 | Breast | Infiltrating duct mixed with other types of carcinoma | IIB | |
| 3 | Breast | Comedocarcinomanon-infiltrating | 0 | |
| 4 | Breast | Infiltrating duct and lobular carcinoma | IIB | |
| 5 | Breast | Infiltrating duct carcinoma | IIA | |
| 6 | Breast | Infiltrating duct carcinoma | IIIB | |
|
| ||||
| Colon | 1 | Colorectal | Adenocarcinoma | IIA |
| 2 | Colorectal | Adenocarcinoma | IV | |
| 3 | Colorectal | Adenocarcinoma | IIIC | |
| 4 | Colon | Adenocarcinoma | - | |
| 5 | Colon | Serous surface papillary carcinoma | - | |
| 6 | Colon | Adenocarcinoma | IIA | |
|
| ||||
| Prostate | 1 | Prostate | Adenocarcinoma | III |
| 2 | Prostate | Adenocarcinoma | II | |
| 3 | Prostate | Adenocarcinoma | III | |
| 4 | Prostate | Adenocarcinoma | - | |
| 5 | Prostate | Adenocarcinoma | II | |
| B. Breast tumor microarray patient data
| |||||||
|---|---|---|---|---|---|---|---|
| Parameter vs # of patients | |||||||
| Diagnosis Age | # | Tumor size | # | Pathological stage | # | Node stage | # |
| 25–35 | 5 | T1 | 67 | IIA | 47 | N0 | 31 |
| 35–45 | 22 | T2 | 13 | IIB | 45 | N1 | 74 |
| 45–55 | 27 | T3 | 15 | IIIA | 8 | N2 | 3 |
| 55–65 | 33 | T4 | 20 | IIIB | 12 | N3 | 7 |
| 65–75 | 15 | IIIC | 1 | ||||
| 75–95 | 13 | IV | 2 | ||||
|
| |||||||
| Metastatic | # | ER | # | PR | # | HER-2 | # |
| M0 | 113 | Positive | 101 | Positive | 77 | Negative | 90 |
| M1 | 2 | Negative | 13 | Negative | 37 | Weak | 13 |
| Not determined | 1 | Not determined | 1 | Strong | 11 | ||
In preparation for the enzymology assays, cells/tissue were lysed in 0.1M Tris Maleate buffer containing 2% triton-X 100 for 1h at 4°C with gentle rocking. A manual Kontes tissue homogenizer was used to assist with lysis in the case of tumor tissue. Following this, all samples were centrifuged at 17,000–20,000g for 1h at 4 C. The clear fat-free supernatant was collected. Protein concentration was measured using the Coomassie-Bradford assay kit (Thermo-Pierce, Rockford, IL) and this was diluted down to 10mg/mL using lysis buffer. Cell/tissue lysates prepared in this manner were stored at −80°C until use in enzymology assays.
Enzyme activity assays
GlycoT activity measurements were performed in 32 flat-bottom microwells fabricated in a 8×4 pattern on 50×75mm microscope slides using photolithography [23]. Each well had dimensions of 2mm diameter × 360μm depth corresponding to a volume of ~1.1μL. To make these reaction wells, photolithography masks were first generated by sketching the well pattern on computer using AutoCAD (San Rafael, CA) and then these were transferred onto a high resolution plate (Microchrome, San Jose, CA). SU8 2035 photoresist (MicroChem, Newton MA) was then spin-coated onto pre-cleaned microscope slides in two cycles, with a 180μm thick film being deposited in each cycle. Microwell mask placed on this photoresist coated glass slide was exposed to 365nm UV radiation for 90s. The photoresist was then developed using PGMEA (propylene glycol methyl ether acetate) solvent for 3min followed by wash with isopropanol.
All enzymatic assays were performed using 1mg/mL lysate as enzyme source as described previously [24]. Reaction volume was 1.2μL unless mentioned otherwise and this was made up of 1mg/mL cell lysate (final concentration) and reaction buffer (including acceptor and radioactive donor) mentioned below. Synthetic biotinylated acceptors used in this study were from Glycotech (Gaithersburg, MD), and all other synthetic carbohydrates were from previous studies [25,26,23]. These are listed in Supplemental Table S1. 10% glycerol was present in the reaction mixture and studies were performed in chambers with >90% relative humidity in order to minimize evaporation. The galT activity was measured in buffer containing 100mM HEPES (pH 7.0), 7mM ATP, 20mM Mn Acetate, 1mM UDP-Gal, 7.752μM C14 uridine diphospho galactose (UDP-gal, specific activity: 258 mCi/mmol, Perkin Elmer, Watham, MA) and 5mM acceptor. The fucT reaction buffer containing 50mM HEPES buffer (pH 7.5), 5mM MnCl2, 7mM ATP, 3mM NaN3, 4.167μM C14guanosine diphosphate fucose (GDP-Fuc, specific activity: 240 mCi/mmol, American Radiolabeled Chemicals, St. Louis, MO) and 1.5mM acceptor. The sialylT assay buffer contained 100mM sodium cacodylate (pH 6.0), 6.826μM C14-CMP-NeuAc (0.0024μCi total from either Perkin Elmer or American Radiolabel Chemicals) and 0.6mM acceptor. Enzyme assays for tissue samples proceeded under identical conditions as studies with cell lysate, with the exception of sialylT reactions which had 45.45μM C14 CMP-NeuAc. Unless stated otherwise, reactions with breast cancer cell lines proceeded for 3h and patient sample reactions were carried out for 24h.
Upon completion of the reaction, reaction mixtures were blotted onto Silica gel 60 RP-18 reverse phase-TLC plates (EMD-Chemicals) by simply overlaying the plate over the reaction microwells. Water containing 0.2% acetic acid was the mobile phase. After the mobile phase moved 2–5cm on the TLC plates, the plates were dried, wrapped in thin plastic, and exposed overnight to a Super Resolution (SR, Medium) phosphor screen (Perkin Elmer). The screen was imaged using a Cyclone Storage Phosphor System (Perkin Elmer). As described in detail previously [23], such reverse phase separation results in clean delineation of unreacted sugar nucleotide from radioactive product. For all acceptors used in this study, the unreacted sugar nucleotide moves with the mobile phase during the TLC separation step. Radioactive product remains stationary at the initial spot. By utilizing appropriate C-14 radioactivity standards and image analysis software (NIH-Image J, Bethesda, MD), absolute radioactivity of unreacted donor and product was quantified. Such analysis reveals both the overall extent of reaction and the absolute reaction velocity. Product formation is quantified in units of dpm/mg protein, based on the absolute amount of product formed per mg of protein in cell/tissue lysate.
Tissue microarrays (TMAs) for histochemical analysis
Breast and gastrointestinal (GI) cancer tissue microarrays (TMAs) were constructed using patient samples collected at the Roswell Park Cancer Institute (RPCI) between 1995 and 2010 (clinical data summarized in Table 1B). After review and selection of the donor blocks, three 0.6mm core samples were acquired from each patient site (primary with or without metastasis) and assembled into a receiving TMA block. Hematoxylin and eosin stained sections were prepared and reviewed from each TMA block to confirm the presence of invasive tumor. Breast TMAs used for this project represent 115 breast cancer patients whereas the GI TMAs contain 26 patients. In addition, normal breast tissue sections from 15 patients served as control for histochemical analysis.
Immunohistochemical Staining
Prior to histochemical analysis, paraffin embedded samples were dewaxed and rehydrated using water followed by washes with hydrogen peroxide and phosphate buffered saline (PBS). In some cases, the TMAs/tissue sections were treated with 0.05 U/mL of α2,3/6/8/9 Arthrobacterureafaciens neuraminidase in 30mM HEPES buffer containing 1.5mM Ca2+ and 10% fetal bovine serum for 1h at 37°C. In other cases, neuraminidase was absent in the above step. Tissue samples were then further treated with either 4μg/mL mouse IgM monoclonal antibody against the Thomsen-Friedenreich or core-1/Galβ1,3GalNAc/T-antigen (clone A78-G/A7, Abcam, Cambridge, MA)[27] or 50μg/mL HRP conjugated Arachishypogaea/Peanut lectin (PNA-HRP, EY labs, San Mateo, CA) for 1h at 25°C in PBS containing 3% bovine serum albumin (BSA). The anti-T antigen treated slides were additionally washed with PBS and incubated with 0.8μg/ml HRP conjugated Goat Anti-Mouse IgM secondary Ab (Jackson ImmunoResearch, West Grove, PA) for 1h at 25°C in PBS containing 3% BSA. Following a final wash, DAB (3,3′-diaminobenzidine) was applied to both anti-T antigen mAb and PNA-HRP lectin treated slides until color reaction was observed for 1–5 min. The slides were counterstained with hematoxylin after rinsing. Stained TMA and whole sections of normal breast tissue were scanned into digital format using Scanscope® XT (Aperio, Vista, CA).
Stain analysis
Individual, manual scoring of TMA samples was performed using the Spectrum™ Plus web access interface or ImageScope image viewer from Aperio. No automated image analysis method was used for scoring. Intensity was recorded/scored in a semi-quantitative fashion on a scale: 0= no staining, 1 = weak, 2 = moderate, 3 = strong. The percentage of stained cells was also recorded on a scale from 0–100. In cases where a core was missing, a symbol representing ‘not valid score’ was placed. Index score in the scale of 0–300 was obtained for each core by multiplying the intensity score by the percentage of stained cells. At the end, the final score for any patient was determined by averaging the score obtained from valid cores for that individual.
Statistics
Error bars represent standard error mean for ≥3 experiments. Statistical tests were performed using one-way ANOVA followed by the Tukey test for multiple comparisons during cell line studies. P<0.05 was considered to be statistically significant. For the patient tumor samples, Wilcoxon paired test was used to compare the normal and tumor tissue samples. (*=P<0.05 and **=P<0.005). Histological samples stained using lectin and antibody were correlated with patient specific clinical parameters. These parameters include tumor size, number of positive nodes, nodes resected, histological grade, node stage, tumor stage, pathological stage, ER, PR and HER-2 status. Parameters were sorted as categorical, ordinal or interval variables. General linear models (GLM, procglm; SAS, Cary, NC) was used to perform linear regression. P<0.05 was considered to be significant.
RESULTS
We elucidated specific glycan changes based on glycoT enzyme activity measurements made using both cancer cell lines and primary tissue specimens (Figure 1).
GlycoT activity in cell lysates
Enzymology studies were performed in microwells fabricated using BioMEMS technology. Such assays were performed using lysates from breast cancer cell lines, ZR-75-1, MCF7, T-47D and DU4475, as the source of enzyme activity. In all cases, product formation increased linearly with time up to 6h (Supplemental Fig. S1). Thus, conversion data presented in Figure2 are proportional to the overall reaction rate or enzyme activity.
Figure 2. Enzyme activity in breast cancer cell lines.

Product formed was quantified in terms of dpm/mg of protein in cell lysate for four breast cancer cell lines. A. β1,3GalT activity was measured using acceptors with GalNAcα reactive groups. B. β1,4GalT was quantified using acceptors with Galβ1,3(GlcNAcβ1,6)GalNAcα unit. C. β1,3/4GalT activity was measured using GlcNAcβ1,6GalNAcα-sp-biotin, a substrate that can simultaneously measure both enzyme activities. D. ST3/6[Galβ1,3GalNAc] activity was measured using acceptors with the Galβ1,3GalNAc unit. E. ST3/6[Galβ1,4GlcNAc] was quantified using acceptors with LacNAc [Galβ1,4GlcNAcβ] unit. F. α1,3FT[Galβ1,4GlcNAc] activity measured using acceptors with LacNAc unit. G.α1,3FT[sialylLacNAc] was quantified using Neu5Acα2,3Galβ1,4GlcNAcβ-PAA-biotin. Previous studies show thatα1,2FT activity is low in breast cancer cells. H. α1,4FT[Galβ1,3GlcNAc] activity was measured using the acceptor Galβ1,3GlcNAcβ1,3lacβ-Φ-NO2. *indicates P<0.05 with respect to the “No Acceptor” control in the respective cell line. #indicates P<0.05 with respect to all other cell lines.
For galT assays, acceptors that were acted upon by β1,3GalTalone (Fig. 2A), β1,4GalT alone (Fig. 2B) and both β1,3/4GalT (Fig. 2C) were applied. The results show that β1,3GalT activity was high and comparable for all cells except MCF-7, where it was lower (Fig. 2A,2C) Here, the activity of β1,3GalT for both GalNAc -sp-biotin and GlcNAcβ1,6GalNAc -sp-biotin was 50–80% lower for MCF7 compared to other cells. β1,4GalT activity was low or absent in all cell lines (Fig. 2B).
In the case of sialylTs, all cells showed greater activity towards Galβ1,3GalNAc (Type-III) or core-1 type acceptors (Fig. 2D) compared to Galβ1,4GlcNAc (LacNAcType II chains) (Fig. 2E). The former enzyme activity is termed ST3/6[Galβ1,3GalNAc] since sialic acid can attach to either the 3-position of Gal in the Type-III substrate using α2,3sialyTs belonging to the ST3Gal family or the 6-position of GalNAc using the ST6GalNAc enzymes. The latter enzyme activity is similarly termed ST3/6[Galβ1,4GlcNAc] since sialic acid can attach to either the 3 or 6-positon of Gal using either the ST3Gals or ST6Gal-I respectively. Among the cell lines, ST3/6[Galβ1,3GalNAc] activity varied according to: ZR-75-1>MCF7>T-47D>DU4475. With regard to ST3/6[Galβ1,4GlcNAc] activity, only ZR-75-1 prominently sialylated the LacNAc chains with T-47D exhibiting lower activity.
Studies of fucT levels reveal subtle differences between the cell lines. Our previous studies show that α1,2-FT activity is low in breast cancer cells [11]. Also, α1,3-FT[Galβ1,4GlcNAc] activity detected using LacNAc acceptors was ~50% higher in all cell lines compared to DU4475 (Fig. 2F). α1,3-FT[sialylLacNAc] activity detected using sialylated acceptors was low in all cells, with detectable activity only being measured with ZR-75-1 and MCF7 (Fig. 2G). α1,4-FT[Galβ1,3GlcNAc] activity was observed in all cells and it followed a trend similar to ST3[Galβ1,3GalNAc] with enzyme activity varying as: ZR-75-1>MCF7>T-47D>DU4475(Fig. 2H).
Overall the findings summarized in Supplemental Table S2 highlight several glycoTs that are elevated in all breast cancer cell lines including β1,3GalT, ST3[Galβ1,3GalNAc] and α1,3FT[Galβ1,4GlcNAc] activities. They also demonstrate differences in the enzyme profiles among these cells.
Enzyme activity in tumor and normal tissue
In order to determine the degree to which the prominent enzyme activities associated with cell lines in Fig. 2 are unique to tumor compared to normal tissue, enzymatic studies were undertaken with human patient samples (Figure 3). In addition to breast tissue, such studies were undertaken with colon and prostate tissue also in order to determine the degree to which changes in enzyme activity are cancer type specific. Patient population characteristics are provided in Table 1A. As seen, β1,3GalT activity is elevated in tumor of all three cancer types compared to normal tissue (Fig. 3A). Unlike the cell lines, β1,4GalT activity was also elevated in breast tumor, though it was lower compared to β1,3GalT activity (Fig. 3B). In studies that evaluated fucT activity, also, both α1,3FT[Galβ1,4GlcNAc] (Fig. 3C) and α1,4FT[Galβ1,3GlcNAc] (Fig. 3D) was significantly elevated in breast tissue. These enzyme activities did not change in colon and prostate tumor. The α2,3sialylT that acts on both the Galβ1,3GalNAc epitope (Fig. 3E) and Galβ1,4GlcNAc epitope (Fig. 3F) were also higher in breast and colon tumor samples compared to normal tissue. In particular, in agreement with studies with cell lines, ST3[Galβ1,3GalNAc] activity was markedly elevated in breast and colon tumor samples using both Type-III [Galβ1,3GalNAc] (Fig. 3E) and core-2 trisaccharide [Galβ1,3(GlcNAcβ1,6)GalNAc] (Fig. 3G) based acceptors. The use of the latter core-2 based acceptor allows us to attribute the enhanced sialyT activity to ST3[Galβ1,3GalNAc] rather than ST6GalNAcTs.
Figure 3. Enzyme activity in patient tumor versus normal control tissue.

Enzyme activity assays were performed identical to Figure 2 using breast, colon or prostate tumor or normal tissue as enzyme source. Enzyme activities measured include: A. β1,3GalT using GalNAcα-PABA acceptor; B. β1,4GalTusing Galβ1,3(GlcNAcβ1,6)GalNAcα-O-Bn; C. α1,3-FT[Galβ1,4GlcNAcβ] using Galβ1,4GlcNAcβ1,3Galβ1,4GlcNAcβ-O-Bn; D.α1,4-FT[Galβ1,3GlcNAc] activity using Galβ1,3GlcNAcβ1,3lacβ-Φ-NO2; E. ST3/6[Galβ1,3GalNAc] using Galβ1,3GalNAcα-sp-biotin; F. ST3/6[Galβ1,4GlcNAc] using Galβ1,4GlcNAcβ1,3Galβ1,4GlcNAcβ-O-Bn; and G. ST3[Galβ1,3GalNAc] using Galβ1,3(GlcNAcβ1,6)GalNAcα-O-Bn. Data are represented as box plots where the top, middle and bottom of the box represent the upper (Q1), median (Q2) and lower (Q3) quartiles of the observations. The ends of the whiskers represent the maximum or minimum data points within 1.5 times the height of the box, while points indicated by are outliers. Pictorial representation of products formed on top of each panel follow Consortium for Functional Glycomics (CFG) nomenclature. * P<0.05 and **P<0.005 compared to normal tissue.
Overall, the elevated β1,3GalT and ST3[Galβ1,3GalNAc] activity measured in the tissue samples was also noted in the cell lines. Thus, elevated Neu5Acα2,3Galβ1,3GalNAc (sialyl T-antigen) epitope expression may be expected in breast tumor. Significant, but lower levels of this antigen may appear during colon cancer.
Histochemical analysis of tissue sections and tissue microarrays (TMAs)
Histochemical analysis was performed on tissue blocks and TMAs to determine if the sialylated T-antigen was elevated during breast and colon cancer. A description of the patient population is provided in Table 1B. Efforts were also undertaken to determine the topological distribution of this epitope. Since specific antigens and antibodies against the sialyl T-antigen were not available, tissue sections were treated with neuraminidase to expose the underlying Galβ1,3GalNAc antigen/T-antigen. HRP conjugated Peanut/PNA lectin and anti T-antigen mAbA78-G/A7[27] were then applied to recognize the T-antigen.
As expected, breast tumor and normal tissue did not bind either PNA-HRP or the anti T-antigen mAb in the absence of sialidase (Supplemental Fig. S2). These same tissue sections, however, bound both the lectin and the antibody upon treatment with neuraminidase (Figure 4). Here, lectin and mAb binding to tumor was more intense compared to normal tissue present in the same tissue block. Whereas some staining of normal breast tissue was observed in the ductal region, staining of tumor tissue was uniformly intense in all regions. Quantitative analysis of histology data show that whereas 86.7% of breast tumor tissue had moderate or high levels of PNA-HRP staining, this fraction was 13.3% in the case of matched/paired normal controls (Table 2). In the case of anti T-antigen mAb binding, these percentages were 73.3% for tumor versus 0% for normal tissue. When staining of all sialidase -treated tumor samples in the TMA were analyzed, independent of the availability of paired normal tissue, 75.6% and 64.3% of the tumor samples stained with PNA-HRP and anti T-antigen mAb respectively at moderate to high levels. A correlation analysis of PNA-HRP versus anti T-antigen mAb staining revealed a Pearson’s coefficient of correlation of 0.73, and this partially confirms the binding specificity of the reagents (Supplemental Figure S3). Overall, while some staining of both the lectin and mAb to normal breast tissue was observed, this level was markedly higher for tumors as predicted by the enzymology analysis.
Figure 4. Histochemistry images after sialidase treatment.
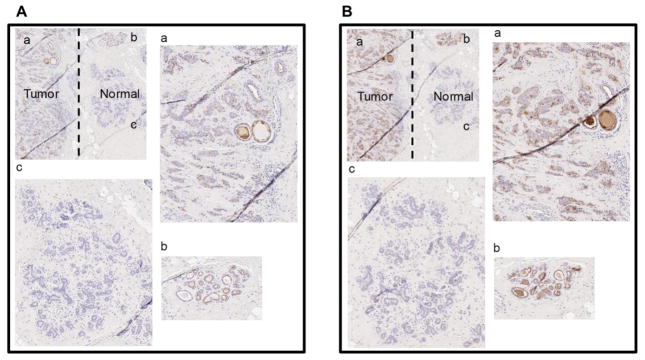
A. Staining with anti T-antigen antibody for breast tumor section with adjacent normal section. The section is labeled as a. Tumor section b. Ductal region in normal section c. Lobular section in normal section. B. Staining with PNA lectin for breast tumor section with adjacent normal section. The section is labeled identical to panel A.
Table 2.
Histochemical analysis of TMA and tissue sectionsa
| Tissue/ TMA | Lowb | Moderate | High | |||
|---|---|---|---|---|---|---|
| Breast | PNA-HRP | Normal |
|
13/15 (86.7%) | 2/15 (13.3%) | 0/15 (0%) |
| Tumor | 2/15 (13.3%) | 3/15 (20%) | 10/15 (66.7%) | |||
| Tumor (All) | 28/115 (24.4%) | 49/115 (42.6%) | 38/115 (33%) | |||
|
|
||||||
| anti T- antigen mAb | Normal |
|
15/15 (100%) | 0/15 (0%) | 0/15 (0%) | |
| Tumor | 4/15 (26.6%) | 2/15 (13.3%) | 9/15 (60%) | |||
| Tumor (All) | 41/115 (35.7%) | 43/115 (37.4%) | 31/115 (27%) | |||
|
| ||||||
| Colon |
PNA- HRP
|
Tumor (All) | 18/26 (69.3%) | 5/26 (19.2%) | 3/26 (11.5%) | |
| anti T- antigen mAb | Tumor (All) | 10/18 (55.6%) | 5/18 (27.8%) | 3/18 (16.6%) | ||
Low: Index scoring = 0–100, Moderate: Index scoring = 101–200, High: Index scoring = 201–300
# of patients stained in that range/ total # of patients
Similar analysis as breast specimens was performed for colon TMAs. Similar to breast tissue, these tissue sections also did not stain with either PNA-HRP or anti T-antigen mAb in the absence of neuraminidase. Upon removing sialic acid using neuraminidase, 30.7% and 44.4% of the colon tumor samples stained with PNA-HRP and anti T-antigen mAb respectively, at moderate to high levels (Table 2, bottom). Supplemental Fig. S4 compares the staining of a colon tumor with its matched normal tissue in the absence and presence of sialidase. In general, as predicted by enzymology studies, antigen staining in colon tissue was less intense compared to breast tissue.
Relating sialyl T-antigen staining to clinical index
Statistical analysis using SAS was performed with breast cancer TMA data to relate the measured lectin and mAb staining to a variety of patient clinical indices: tumor size, number of positive nodes, nodes resected, histological grade, node stage, tumor stage, pathological stage, ER, PR and HER-2 status. Here, the only statistically significant relationship identified related patient HER2 status with PNA-lectin staining (P=0.0324) and anti T-antigen mAb binding (P=0.0074). As seen in Figure 5, patients with strong HER2 levels had low sialyl T-antigen expression, as measured using both the mAb (Fig. 5C) and PNA-HRP (Fig. 5F). On the other hand, HER2 negative patients (Fig. 5A, D) and patients with weak HER2 expression (Fig. 5B, E) displayed high levels of sialyl T-antigen expression.
Figure 5. Pie charts showing relation between T-antigen mAb/PNA staining and HER-2 expression in breast TMAs. A to C.

Pie charts for anti-T antigen mAb staining for patients with negative, weak and strong HER-2 expression, respectively. D to F. Pie charts for PNA lectin staining for patients with negative, weak and strong HER-2 expression, respectively. Results are collated for TMAs that were treated with sialidase. The distribution in the pie chart shows the index score as “Low”: 0–100, “Moderate”: 101–200, “High”: 201–300. Patients with strong HER-2 expression have low T-antigen mAb/PNA-lectin staining.
Since HER2 relates to the aggressiveness of breast cancer, we also determined if a relationship exists between sialyl T-antigen expression and tumor metastatic potential (Supplemental Fig. S5). In such analysis, the expression of the sialyl T-antigen epitope was high in primary tumors, regardless of whether it was non-metastatic (N=0) or metastatic (N>0). Also, sialyl T-antigen expression was lower in metastasized tumors at secondary sites both when the anti-T antigen (Supplemental Fig. 5A) and PNA lectin (Supplemental Fig. 5B)were used to quantify glycan expression. In the case of PNA-lectin, the lower staining observed in the metastatic tumors was statistically significant relative to primary tumors that were non-metastatic (N=0). Together, these data suggest that the sialyl T-antigen expression may be reduced when tumors metastasize. Further, the HER-2 status combined with the sialyl T-antigen score may provide an indication of which tumors will metastasize.
DISCUSSION
The current study systematically evaluated glycoT activities in various breast cancer cell lines, primary tumors and matched normal tissue. This was facilitated by the development of a miniaturized glycoT assay that allowed rapid measurement of enzyme activity even when the amount of available tumor sample was scarce.
Truncated O-glycans in primary tumors
The enzyme analyses demonstrate several prominent differences in the cellular glycoT activity of tumor cells compared to normal tissue. Among these, high levels of β1,3GalT and ST3[Galβ1,3GalNAc] activity were noted in breast tumors and to a lesser extent in colon cancer tissue. The difference in enzyme activity between prostate cancer and normal tissue was less remarkable, and thus this avenue was not pursued further. Moderate amount of α1,3FT activity was also noted in breast but not colon cancer tissue.
Based on the above, we tested the hypothesis that high levels of the sialylated T-antigen structure may accompany oncogenic transformation during breast and also colon cancer. Consistent with this: (i). Galβ1,3GalNAc/T-antigen binding lectin and mAb did not recognize breast and colon tissue blocks. The addition of neuraminidase enhanced binding of these reagents thus confirming the capping of the T-antigen by sialic acid residues. (ii). The binding of these reagents that recognize the T-antigen was more prominent for sialidase treated tumor samples compared to normal controls. In this regard, the presence of the sialylT-antigen at modest or high levels was observedin 67–88% of the breast tumor sections while it varied from 0–13% in the case of normal tissue sections. These data are consistent with the high levels of core-1 β1,3GalT activity measured in tumor compared to normal tissue. (iii). The binding of PNA-HRP or anti T-antigen mAb to neuraminidase treated histological samples was more prominent in the case of breast cancer compared to colon cancer. Thus, distinct glycan structure changes may be expected with different cancers.
Our data are consistent with a body of literature that suggest the existence of truncated O-glycan structures during cancer, including the nakedT-(Galβ1,3GalNAc), Tn- (GalNAc linked to Ser/Thr on peptide backbone) and the sialylated STn antigen [5,28–30]. Some of these studies suggest that the expression of such truncated glycan epitopes may be applied to determine the prognosis of breast patient following chemotherapy [28]. Research performed by several investigators that is significantly related to this work also suggests the overexpression of the sialylated T-antigen during breast cancer [31–33]. In this regard by comparing glycosyltransferase enzyme activity in immortalized mammary epithelial cell line MTSV1-7 to breast cancer cells BT20, MCF-7 and T-47D, Brockhausen et al. (1995) demonstrated the prominent over-expression of the α2,3ST3[Galβ1,3GalNAc] enzyme activity in breast cancer cells compared to normal MTSV1-7 cells. By studying the glycans on MUC1 expressed in MTSV1-7 cells and these breast cancer cells, Lloyd et al. (1996)extend this observation to show that the disialylated core-2 glycoform is formed in MTSV1-7 cells while MUC1 from T-47D contains the simple structures, T-antigen, ST-antigen and Tn-antigens. Follow up work by this group of investigators also shows that α2,3sialyltransferase expression may be functionally important in terms of regulating breast cancer tumorigenesis [34,35]. Similar observations as above were also made by Muller and Hanisch [36], who transfected a soluble MUC1 fusion protein called MFP6 into various breast cancer cell lines including T-47D, MCF-7, MDA 231 and ZR-75-1. These investigators showed that the sialylated T-antigen [Neu5Acα2,3Galβ1,3GalNAc, Galβ1,3[Neu5Acα2,6]GalNAc, plus Neu5Acα2,3Galβ1,3[Neu5Acα2,6]GalNAc] is a prominent epitope in breast cancer cell lines. The percent of O-glycans expressing this epitope varies as T-47D (93%)>MDA 231(38%) >ZR-75-1(32%)>MCF-7(5%). Further, upon comparing O-glycans of secreted versus cell-surface MUC-1 from MCF-7 cells, these investigators show that extended core-2 based oligosaccharides dominate in secreted proteins, whereas truncated NeuAcα2,3Galβ1,3GalNAc type structures appear on 83% of the O-glycans of membrane bound MUC1[37]. While the above studies largely focus on cell lines, a study using patient serum samples also demonstrates that 81% of the O-glycans of serum MUC1 from advanced breast cancer patients contain mono, di and tri-sialylated structures [33]. These authors report that the sialylatedT-antigen/core-1 glycans are the most abundant glycan species and that only 14.3% of the total O-linked glycans bear the Galβ1,3GalNAc epitope without sialylation. The present study also shows that the sialyl T-antigen is prominently over-expressed in breast tumor as compared to the normal tissue obtained from the same individual. Further, this work provides a relatively simple strategy to detect the sialylated T-antigen using mAbs and lectins.
Enzymes forming the sLeX antigen
Besides the glycoTs contributing to the truncation of the O-glycan, our study noted moderate elevation of α1,3-FT, β1,4GalT and ST3[Galβ1,4GlcNAc] activity in breast tumor tissues compared to normal controls. While detailed analysis of the effect of these enzymes on glycan structure was not evaluated in the TMAs, it is possible that these enzymatic changes may support a modest increase in the expression of sialofucosylated Type-II/LacNac structures during breast cancer, particularly in N-glycans. In this regard, only 10.1% of O-glycans from the secreted MUC1 of MCF-7 are reported to have α1,3fucosylated structures [36]. Fucosylated O-glycans were absent in MUC-1 expressed by other breast cell lines studied by these investigators. Expression of the sialyl Lewis-X is also, however, reported to be elevated in advanced breast cancer patient serum glycoproteins that carry trisialylated triantennary N-glycans containing α1,3-linked fucose [21]. Further, the combined expression of α1,3-fucosylated monogalactosylated biantennary (A2F1G1),α1,3-fucosylated monogalactosylated triantennary (A3F1G1) and core fucosylated a galactosyl biantennary (FA2)N-glycans are reported to depend on patient nodal metastasis status [22].
Relation to clinical indices
Attempts were made to relate lectin and mAb staining in the breast tumor samples to patient specific parameters. Such analysis did not reveal a correlation between sialyl T-antigen expression and a variety of parameters related to tumor size or pathology grade. We however noted an inverse relation between sialyl-T antigen expression and tumor metastatic state and HER2 status. In this regard, PNA-lectin staining after neuraminidase treatment, which indicates sialylated T-antigen expression, was lower in metastatic tumor samples compared to non-metastatic primary tumors. These data suggest that while the sialyl T-antigen expression may be expected to be uniformly expressed in all breast tumors, a reduction in this epitope may correlate with metastasis.
In summary, the current study applies miniaturized glycoT assays to predict tumor associated carbohydrate antigens. Using this approach, it demonstrates the high expression of the sialylated T-antigen O-glycan in breast tumor but not normal tissue sections. It also suggests a possible transition from the linear core-1 glycan to other glycan epitopes when tumor cells metastasize. More detailed investigations are needed to identify the precise glycosylation change that accompanies metastasis and also to determine the prevalence of the sialylated T-antigen in serum glycoproteins secreted from breast tumors.
Supplementary Material
Acknowledgments
This work was supported by the National Institutes of Health [grant HL63014 and HL103411].
ABBREVIATIONS
- GlycoT
glycosyltransferase
- Galβ1, 3GalNAc
Type-III or core-1 type acceptors
- Galβ1, 4GlcNAc
Type II or LacNAc type chain
- GalT
galactosyltransferase
- FT or FucT
fucosyltransferase
- SialylT
sialyltransferase
- ST3[Galβ1, 3GalNAc]
α2,3 sialyltransferase acting on Galβ1,3GalNAc
- ST3/6[Galβ1, 4GlcNAc]
α2,3/6 sialyltransferase acting on Galβ1,4GlcNAc
- Bn
Benzyl
- PAA
polyacrylamide
- Φ-NO2
p-nitrophenol
Footnotes
CONFLICT OF INTEREST
We declare that we have no conflict of interest.
References
- 1.Neelamegham S, Liu G. Systems glycobiology: biochemical reaction networks regulating glycan structure and function. Glycobiology. 2011;21(12):1541–1553. doi: 10.1093/glycob/cwr036. [DOI] [PMC free article] [PubMed] [Google Scholar]
- 2.Hakomori S. Tumor-associated carbohydrate antigens defining tumor malignancy: basis for development of anti-cancer vaccines. Adv Exp Med Biol. 2001;491:369–402. doi: 10.1007/978-1-4615-1267-7_24. [DOI] [PubMed] [Google Scholar]
- 3.Yoshimura M, Nishikawa A, Ihara Y, Taniguchi S, Taniguchi N. Suppression of lung metastasis of B16 mouse melanoma by N-acetylglucosaminyltransferase III gene transfection. Proc Natl Acad Sci U S A. 1995;92(19):8754–8758. doi: 10.1073/pnas.92.19.8754. [DOI] [PMC free article] [PubMed] [Google Scholar]
- 4.Tei K, Kawakami-Kimura N, Taguchi O, Kumamoto K, Higashiyama S, Taniguchi N, Toda K, Kawata R, Hisa Y, Kannagi R. Roles of cell adhesion molecules in tumor angiogenesis induced by cotransplantation of cancer and endothelial cells to nude rats. Cancer Res. 2002;62(21):6289–6296. [PubMed] [Google Scholar]
- 5.Itzkowitz SH, Yuan M, Montgomery CK, Kjeldsen T, Takahashi HK, Bigbee WL, Kim YS. Expression of Tn, Sialosyl-Tn, and T Antigens in Human Colon Cancer. Cancer Research. 1989;49(1):197–204. [PubMed] [Google Scholar]
- 6.Kozlowski EO, Pavao MS. Effect of sulfated glycosaminoglycans on tumor invasion and metastasis. Front Biosci. 2011;3:1541–1551. doi: 10.2741/244. [DOI] [PubMed] [Google Scholar]
- 7.Stevenson JL, Varki A, Borsig L. Heparin attenuates metastasis mainly due to inhibition of P- and L-selectin, but non-anticoagulant heparins can have additional effects. Thrombosis Research. 2007;120(Supplement 2)(0):S107–S111. doi: 10.1016/S0049-3848(07)70138-X. [DOI] [PubMed] [Google Scholar]
- 8.Potapenko IO, Haakensen VD, Lüders T, Helland Å, Bukholm I, Sørlie T, Kristensen VN, Lingjærde OC, Børresen-Dale A-L. Glycan gene expression signatures in normal and malignant breast tissue; possible role in diagnosis and progression. Molecular Oncology. 2010;4(2):98–118. doi: 10.1016/j.molonc.2009.12.001. [DOI] [PMC free article] [PubMed] [Google Scholar]
- 9.Wander SA, Hennessy BT, Slingerland JM. Next-generation mTOR inhibitors in clinical oncology: how pathway complexity informs therapeutic strategy. J Clin Invest. 2011;121(4):1231–1241. doi: 10.1172/JCI44145. [DOI] [PMC free article] [PubMed] [Google Scholar]
- 10.Sebolt-Leopold JS, English JM. Mechanisms of drug inhibition of signalling molecules. Nature. 2006;441(7092):457–462. doi: 10.1038/nature04874. [DOI] [PubMed] [Google Scholar]
- 11.Chandrasekaran EV, Xue J, Neelamegham S, Matta KL. The pattern of glycosyl- and sulfotransferase activities in cancer cell lines: a predictor of individual cancer-associated distinct carbohydrate structures for the structural identification of signature glycans. Carbohydr Res. 2006;341(8):983–994. doi: 10.1016/j.carres.2006.02.017. [DOI] [PubMed] [Google Scholar]
- 12.Zhang H, Meng F, Wu S, Kreike B, Sethi S, Chen W, Miller FR, Wu G. Engagement of I-Branching β-1, 6-N-Acetylglucosaminyltransferase 2 in Breast Cancer Metastasis and TGF-β Signaling. Cancer Research. 2011;71(14):4846–4856. doi: 10.1158/0008-5472.CAN-11-0414. [DOI] [PMC free article] [PubMed] [Google Scholar]
- 13.Barthel SR, Wiese GK, Cho J, Opperman MJ, Hays DL, Siddiqui J, Pienta KJ, Furie B, Dimitroff CJ. Alpha 1,3 fucosyltransferases are master regulators of prostate cancer cell trafficking. Proc Natl Acad Sci USA. 2009;106(46):19491–19496. doi: 10.1073/pnas.0906074106. [DOI] [PMC free article] [PubMed] [Google Scholar]
- 14.Carvalho AS, Harduin-Lepers A, Magalhães A, Machado E, Mendes N, Costa LT, Matthiesen R, Almeida R, Costa J, Reis CA. Differential expression of α-2,3-sialyltransferases and α-1,3/4-fucosyltransferases regulates the levels of sialyl Lewis a and sialyl Lewis x in gastrointestinal carcinoma cells. The International Journal of Biochemistry & Cell Biology. 2010;42(1):80–89. doi: 10.1016/j.biocel.2009.09.010. [DOI] [PubMed] [Google Scholar]
- 15.Recchi MA, Hebbar M, Hornez L, Harduin-Lepers A, Peyrat JP, Delannoy P. Multiplex Reverse Transcription Polymerase Chain Reaction Assessment of Sialyltransferase Expression in Human Breast Cancer. Cancer Research. 1998;58(18):4066–4070. [PubMed] [Google Scholar]
- 16.Gu Y, Mi W, Ge Y, Liu H, Fan Q, Han C, Yang J, Han F, Lu X, Yu W. GlcNAcylation Plays an Essential Role in Breast Cancer Metastasis. Cancer Res. 2010;70(15):6344–6351. doi: 10.1158/0008-5472.CAN-09-1887. [DOI] [PubMed] [Google Scholar]
- 17.Seko A, Ohkura T, Kitamura H, Yonezawa S, Sato E, Yamashita K. Quantitative differences in GlcNAc:β1-->3 and GlcNAc:β1-->4 galactosyltransferase activities between human colonic adenocarcinomas and normal colonic mucosa. Cancer Res. 1996;56 (15):3468–3473. [PubMed] [Google Scholar]
- 18.Chandrasekaran E, Xue J, Piskorz C, Locke R, Tóth K, Slocum H, Matta K. Potential tumor markers for human gastric cancer: an elevation of glycan:sulfotransferases and a concomitant loss of α1,2-fucosyltransferase activities. Journal of Cancer Research and Clinical Oncology. 2007;133(9):599–611. doi: 10.1007/s00432-007-0206-0. [DOI] [PubMed] [Google Scholar]
- 19.Park SY, Lee SH, Kawasaki N, Itoh S, Kang K, Hee Ryu S, Hashii N, Kim JM, Kim JY, Hoe Kim J. α1-3/4 fucosylation at Asn 241 of β-haptoglobin is a novel marker for colon cancer: A combinatorial approach for development of glycan biomarkers. International Journal of Cancer. 2012;130(10):2366–2376. doi: 10.1002/ijc.26288. [DOI] [PubMed] [Google Scholar]
- 20.Fry SA, Afrough B, Lomax-Browne HJ, Timms JF, Velentzis LS, Leathem AJC. Lectin microarray profiling of metastatic breast cancers. Glycobiology. 2011;21(8):1060–1070. doi: 10.1093/glycob/cwr045. [DOI] [PubMed] [Google Scholar]
- 21.Abd Hamid UM, Royle L, Saldova R, Radcliffe CM, Harvey DJ, Storr SJ, Pardo M, Antrobus R, Chapman CJ, Zitzmann N, Robertson JF, Dwek RA, Rudd PM. A strategy to reveal potential glycan markers from serum glycoproteins associated with breast cancer progression. Glycobiology. 2008;18(12):1105–1118. doi: 10.1093/glycob/cwn095. [DOI] [PubMed] [Google Scholar]
- 22.Pierce A, Saldova R, Abd Hamid UM, Abrahams JL, McDermott EW, Evoy D, Duffy MJ, Rudd PM. Levels of specific glycans significantly distinguish lymph node-positive from lymph node-negative breast cancer patients. Glycobiology. 2010;20(10):1283–1288. doi: 10.1093/glycob/cwq090. [DOI] [PubMed] [Google Scholar]
- 23.Patil SA, Chandrasekaran EV, Matta KL, Parikh A, Tzanakakis ES, Neelamegham S. Scaling down the size and increasing the throughput of glycosyltransferase assays: Activity changes on stem cell differentiation. Anal Biochem. 2012;425(2):135–144. doi: 10.1016/j.ab.2012.03.009. [DOI] [PMC free article] [PubMed] [Google Scholar]
- 24.Marathe DD, Chandrasekaran EV, Lau JT, Matta KL, Neelamegham S. Systems-level studies of glycosyltransferase gene expression and enzyme activity that are associated with the selectin binding function of human leukocytes. FASEB J. 2008;22(12):4154–4167. doi: 10.1096/fj.07-104257. [DOI] [PMC free article] [PubMed] [Google Scholar]
- 25.Chandrasekaran EV, Xue J, Xia J, Chawda R, Piskorz C, Locke RD, Neelamegham S, Matta KL. Analysis of the specificity of sialyltransferases toward mucin core 2, globo, and related structures. identification of the sialylation sequence and the effects of sulfate, fucose, methyl, and fluoro substituents of the carbohydrate chain in the biosynthesis of selectin and siglec ligands, and novel sialylation by cloned alpha2,3(O)sialyltransferase. Biochemistry. 2005;44(47):15619–15635. doi: 10.1021/bi050246m. [DOI] [PubMed] [Google Scholar]
- 26.Marathe DD, Buffone A, Jr, Chandrasekaran EV, Xue J, Locke RD, Nasirikenari M, Lau JT, Matta KL, Neelamegham S. Fluorinated per-acetylated GalNAc metabolically alters glycan structures on leukocyte PSGL-1 and reduces cell binding to selectins. Blood. 2010;115(6):1303–1312. doi: 10.1182/blood-2009-07-231480. [DOI] [PMC free article] [PubMed] [Google Scholar]
- 27.Karsten U, Butschak G, Cao Y, Goletz S, Hanisch FG. A new monoclonal antibody (A78-G/A7) to the Thomsen-Friedenreich pan-tumor antigen. Hybridoma. 1995;14(1):37–44. doi: 10.1089/hyb.1995.14.37. [DOI] [PubMed] [Google Scholar]
- 28.Miles DW, Happerfield LC, Smith P, Gillibrand R, Bobrow LG, Gregory WM, Rubens RD. Expression of sialyl-Tn predicts the effect of adjuvant chemotherapy in node-positive breast cancer. Br J Cancer. 1994;70(6):1272–1275. doi: 10.1038/bjc.1994.486. [DOI] [PMC free article] [PubMed] [Google Scholar]
- 29.Patani N, Jiang WEN, Mokbel K. Prognostic Utility of Glycosyltransferase Expression in Breast Cancer. Cancer Genomics - Proteomics. 2008;5(6):333–340. [PubMed] [Google Scholar]
- 30.Sewell R, Bäckström M, Dalziel M, Gschmeissner S, Karlsson H, Noll T, Gätgens J, Clausen H, Hansson GC, Burchell J, Taylor-Papadimitriou J. The ST6GalNAc-I Sialyltransferase Localizes throughout the Golgi and Is Responsible for the Synthesis of the Tumor-associated Sialyl-Tn O-Glycan in Human Breast Cancer. Journal of Biological Chemistry. 2006;281(6):3586–3594. doi: 10.1074/jbc.M511826200. [DOI] [PubMed] [Google Scholar]
- 31.Lloyd KO, Burchell J, Kudryashov V, Yin BWT, Taylor-Papadimitriou J. Comparison of O-Linked Carbohydrate Chains in MUC-1 Mucin from Normal Breast Epithelial Cell Lines and Breast Carcinoma Cell Lines. Journal of Biological Chemistry. 1996;271(52):33325–33334. doi: 10.1074/jbc.271.52.33325. [DOI] [PubMed] [Google Scholar]
- 32.Brockhausen I, Yang JM, Burchell J, Whitehouse C, Taylor-Papadimitriou J. Mechanisms Underlying Aberrant Glycosylation of MUC1 Mucin in Breast Cancer Cells. European Journal of Biochemistry. 1995;233(2):607–617. doi: 10.1111/j.1432-1033.1995.607_2.x. [DOI] [PubMed] [Google Scholar]
- 33.Storr SJ, Royle L, Chapman CJ, Hamid UMA, Robertson JF, Murray A, Dwek RA, Rudd PM. The O-linked glycosylation of secretory/shed MUC1 from an advanced breast cancer patient’s serum. Glycobiology. 2008;18(6):456–462. doi: 10.1093/glycob/cwn022. [DOI] [PubMed] [Google Scholar]
- 34.Burchell J, Poulsom R, Hanby A, Whitehouse C, Cooper L, Clausen H, Miles D, Taylor-Papadimitriou J. An α2,3 sialyltransferase (ST3Gal I) is elevated in primary breast carcinomas. Glycobiology. 1999;9(12):1307–1311. doi: 10.1093/glycob/9.12.1307. [DOI] [PubMed] [Google Scholar]
- 35.Picco G, Julien S, Brockhausen I, Beatson R, Antonopoulos A, Haslam S, Mandel U, Dell A, Pinder S, Taylor-Papadimitriou J, Burchell J. Over-expression of ST3Gal-I promotes mammary tumorigenesis. Glycobiology. 2010;20(10):1241–1250. doi: 10.1093/glycob/cwq085. [DOI] [PMC free article] [PubMed] [Google Scholar]
- 36.Muller S, Hanisch FG. Recombinant MUC1 Probe Authentically Reflects Cell-specific O-Glycosylation Profiles of Endogenous Breast Cancer Mucin. J Biol Chem. 2002;277(29):26103–26112. doi: 10.1074/jbc.M202921200. [DOI] [PubMed] [Google Scholar]
- 37.Engelmann K, Kinlough CL, Muller S, Razawi H, Baldus SE, Hughey RP, Hanisch FG. Transmembrane and secreted MUC1 probes show trafficking-dependent changes in O-glycan core profiles. Glycobiology. 2005;15(11):1111–1124. doi: 10.1093/glycob/cwi099. [DOI] [PubMed] [Google Scholar]
Associated Data
This section collects any data citations, data availability statements, or supplementary materials included in this article.