Abstract
A differential equations model is developed for the 2014 Ebola epidemics in Sierra Leone and Liberia. The model describes the dynamic interactions of the susceptible and infected populations of these countries. The model incorporates the principle features of contact tracing, namely, the number of contacts per identified infectious case, the likelihood that a traced contact is infectious, and the efficiency of the contact tracing process. The model is first fitted to current cumulative reported case data in each country. The data fitted simulations are then projected forward in time, with varying parameter regimes corresponding to contact tracing efficiencies. These projections quantify the importance of the identification, isolation, and contact tracing processes for containment of the epidemics.
Keywords: ebola
Introduction
Our objective is to develop a mathematical model of the 2014 Ebola epidemic in West Africa. The model consists of a system of ordinary differential equations for the compartments of the epidemic population. The model incorporates the unique features of the Ebola outbreaks in this region. These features include the rates of transmission to susceptibles from both infectious cases and improperly handled deceased cases, the rates of reporting and isolating these cases, and the rates of recovery and mortality for these cases. The model also incorporates contact tracing2 of reported infectious cases, and analyzes the efficiency of the identification and isolation of these cases, and the efficiency of contact tracing measures.
We apply the model to Sierra Leone and Liberia, first fitting WHO data for each country from outbreak in the spring of 2014 to September 23, 2014. We then simulate forward projections of the epidemic in each of these countries, based on varied efficiencies in identifying, isolating, and contact tracing of infected individuals. Our model predictions indicate that the containment of the epidemic requires a high level of both the general identification and isolation process and the contact tracing process for removing infectious individuals from the susceptible population.
The Model
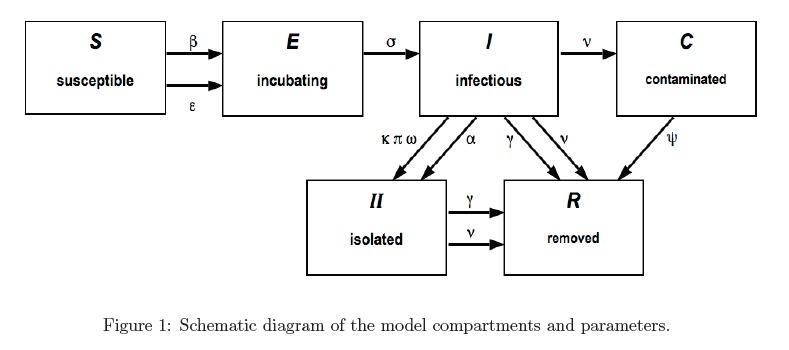
The model, which is of SEIR form1 , 3 , 7 , 8 , 9, incorporates specific features of contact tracing in the current epidemics. The model consists of the populations at time t of susceptibles S(t) (capable of becoming infected), exposed E(t) (incubating infected), I(t) (infectious infected), contaminated deceased C(t) (improperly handled corpses of infected), isolated infectious II(t) (exposed and infectious infected who have been identified and isolated from the susceptible population), and removed R(t) (infectious cases who have recovered or died). The compartments II(t) and R(t) de-couple from the other compartments, and their values can be obtained from S(t), E(t), I(t), C(t). A schematic diagram of the model is shown in figure 1. The system of differential equations for S(t), E(t), I(t), C(t) is


We note that the transmission terms in the S(t) equation are of mass-action form. We assume that the initial conditions and parameters are such that I(t) remains non-negative in a reasonable time-frame. The parameters of the model are given in Table 1.
A major goal of our study is to fit the model to current reported data for Sierra Leone, Liberia, and Guinea. We note that the data available are the cumulative clinical reported cases15
,
16, that is, the suspected cases, probable cases and confirmed cases according to the definitions given in WHO17. Therefore, if we denote by CUM(t) the cumulative reported cases at time  , then at time
  we have:

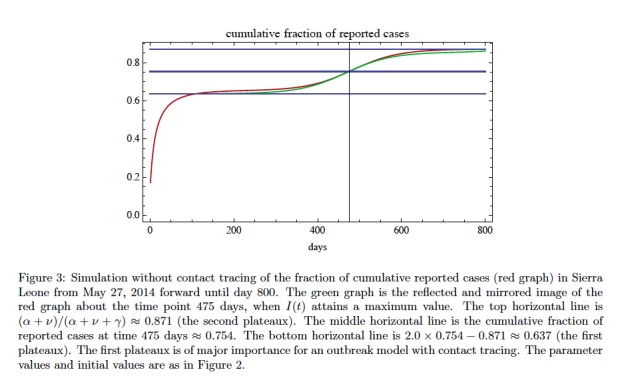
For our model it can be proved that as  the cumulative fraction of reported cases
  converges to
  . Further, after a brief initial time period, the cumulative fraction of reported cases in a gradually increasing function of time with two plateaus mirrored and reflected about the time at which I(t) is maximum (see Figure 3). In general, it is difficult to identify a time-independent probability that a case will be reported, since data are not known for unreported cases. The issue of unreported cases is very important for contact tracing. A major goal of contact tracing is to remove from the epidemic population a sufficient number of infectious cases to contain the epidemic, but only reported cases are contact traced.
Parameters in the Model
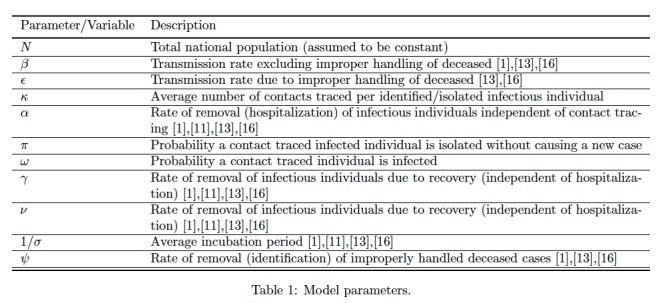
The parameters of the model are given in Table 1. The values of the parameters  and
and  are estimated for the three countries using a least square curve fitting algorithm. In addition, the initial values S(0), E(0), I(0) and C(0) are also estimated using the least squares algorithm. There are many different parameter combinations which fit, thus confidence intervals may not be relevant for our purposes. The goal is to obtain a reasonable visual fit, and then to illustrate general qualitative features of the impact of contact tracing on the epidemic trajectory, along with identifying rough rules of thumb for containing the epidemic based on numerical simulations.
The parameters  and
and  are taken to be values suggested by references in Table 1. The parameter
  is assumed to be a value such that the case mortality rate (outside hospital) is approximately 80%. In fitting the model to the data, we assume that contact tracing does not occur (
 ) during the time period of the data (up until September 23, 2014). The reasons for this assumption are that contact tracing has been insufficient in the three countries, and to reduce the number of parameters to estimate in fitting the data. As stated before, the main goal for incorporating contact tracing is to project forward the impact of effective contact tracing on the future number of cases. The basic reproduction number of the model (1) is given by the following formula: (computed by the next generation method13):

The  values we obtain are similar to the
  values obtained in1
,
3
,
4
,
5
,
12
,
18.
The removal rate of infectious individuals due to contact tracing at time  has the following form:

The probabilities  and
and  can, in principle, be ascertained from records of contact traced cases over an interval of time. We note that the probability
  that a traced contact is infected will depend on the average number of traced contacts
  . The values of
  ,
,  , and
, and  can be updated as health authorities collect data of hospitalized and deceased cases. The parameter
  measures the efficiency of the tracking, monitoring, and removal of contact traced infectious cases for a specific organization and implementation of a contact tracing process. In particular,
  measures how efficiently public health workers remove infected individuals upon symptoms onset, and prevent secondary transmissions. The solution of the model projects the likelihood that an implemented contact tracing process will contain the epidemic, and if not, then the contact tracing process must be enhanced.
The entire contact tracing process is highly dependent on public health resources, and varies greatly in different locations and epidemic stages. For example, in Sénégal the following policy has been implemented:
each identified patient is questioned in order to obtain a complete list of contacts;
the contacts are traced;
each contact is asked to stay at home;
each day, for 21 days, a healthcare worker visits the contacts and verifies whether or not the contacts are showing symptoms.
These protocols are rigorous and have been successful in preventing new cases in Sénégal. On October 17, 2014, the World Health Organization declared the end of the outbreak of the Ebola epidemic in Sénégal (after 42 days with no new cases and with active surveillance demonstrably in place and supported by good diagnostic capacity)19 .
Simulations of the Ebola Epidemic in Sierra Leone
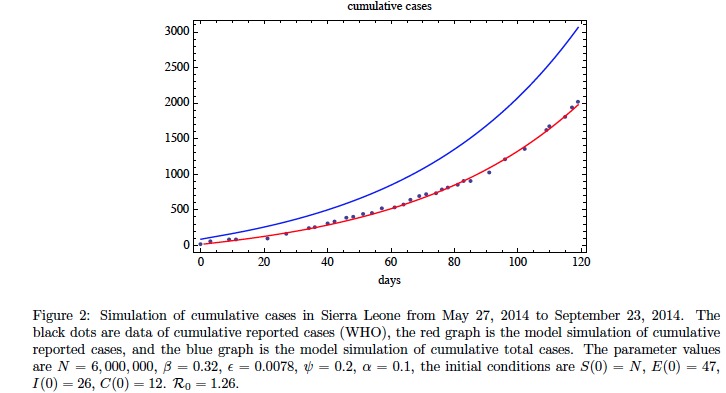
In Figure 2 we fit the model without contact tracing to the cumulative reported case data for Sierra Leone from May 27, 2014 to September 23, 2014 (WHO15
,
16). The fit to data can be accomplished with varying combinations of parameters. Here we have used a least-squares algorithm to obtain a choice of parameters with relatively accurate fit. The parameters obtained in the fit yield a basic reproduction number of  . The simulation yields the following information about the epidemic on September 23, 2014 (day 119): the ratio of exposed cases to infectious cases is
  ; the ratio of improperly handled deceased cases to infectious cases is
  ; and the ratio of cumulative reported cases to cumulative unreported cases is
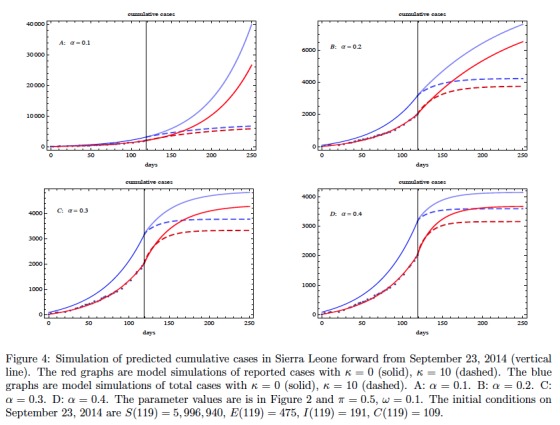
  . These ratios, which are dependent on parameters, are relatively stable at the data end-stage. In Figure 3 we graph the model simulation of the projected fraction of cumulative reported cases as a function of time without contact tracing. The fraction of cumulative reported cases to total cases shows a two phase behavior with a lower value transitioning to an upper value. In Figure 4 we add contact tracing to the model and predict the further evolution of the epidemic in Sierra Leone forward from September 23, 2014. The contact tracing parameters
  and
and  are varied in a sensitivity analysis, while the other contact tracing parameters are held constant. The graphics reveal that a general identification/isolation rate
  is required for containing the epidemic. The number
  of contacts traced per identified case is also important if
  is smaller. After contact tracing begins and for a short time, the reported cases increase as
  increases, but then the epidemic subsides as contact tracing takes effect.
Simulations of the Ebola Epidemic in Liberia
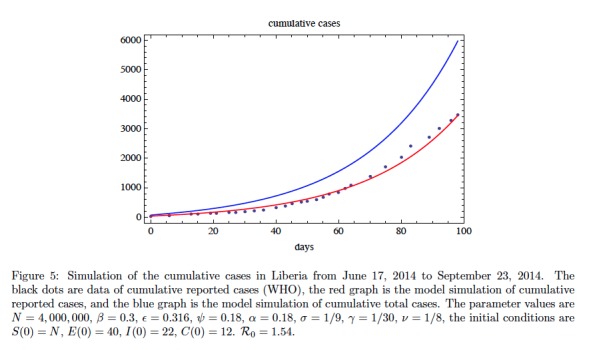
In Figure 5 we fit the model without contact tracing to the cumulative reported case data for Liberia from June 17, 2014 to September 23, 2014 (WHO15
,
16). We have used a least-squares algorithm to obtain a choice of parameters with relatively good fit (other parameter choices will give similar fits). The parameters obtained in the fit yield a basic reproduction number of  . The simulation yields the following information about the epidemic on September 23, 2014 (day 98): the ratio of exposed cases to infectious cases is
  ; the ratio of improperly handled deceased cases to infectious cases is
  ; and the ratio of cumulative reported cases to cumulative unreported cases is
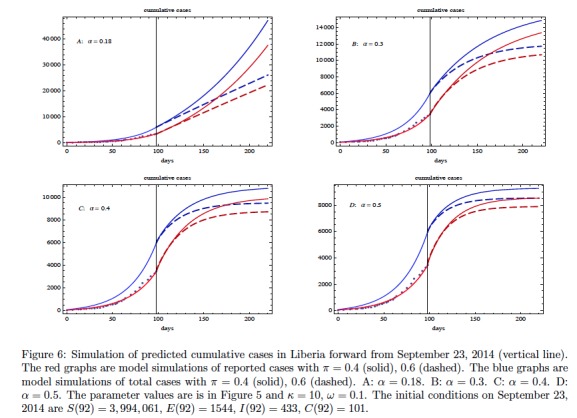
  . These ratios, again depend on parameters, are very stable throughout most of the period of simulation. In Figure 6 we add contact tracing to the model and predict the further evolution of the epidemic in Liberia forward from September 23, 2014. The contact tracing parameters
  and
and  are varied in a sensitivity analysis, while all the other contact tracing parameters are held constant. The graphics again reveal that an identification/isolation rate
  is required for containing the epidemic. The role of
  , as the probability of efficiently tracing and monitoring a contact traced individual is also important for the containment of the epidemic. As in Figure 4, the reported cases increase for a short time as
  increases, but then decrease as contact tracing takes effect.
We could not obtain data for the parameters  and
and  . In principle,
  should depend on the probability of transmission, and some efficiency in the breadth and accuracy of contact tracing. Since, we are not sure of the parameter, we choose an arbitrary probability value of
  which seems reasonable. As
  increases (decreases), contact tracing will have a larger (smaller) impact on the epidemic trajectory. Also,
  is a control parameter describing efficiency of monitoring and removal (if infectious) of traced contacts. We vary this parameter in Fig. 6, to show qualitative effects of varying
  to specific values (
 ). Note that the effect of varying
  and
and  on the dynamics are identical since the terms always appear as a product in the differential equation. Based on numerical simulations, we conclude that if
  and
and  , then the epidemic can be contained after a short window of time.
A Stochastic Version of the Model
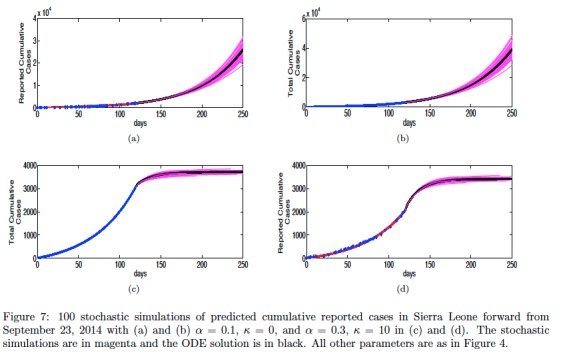
Figure 7 shows 100 stochastic simulations compared with the ODE solution for contact tracing in Sierra Leone with different rates of case hospitalization  and average number of contacts traced
  . The stochastic simulations are generated by simulating a Continuous Time Markov Chain as a continuation of the ODE solution beginning at the last data time point. All other parameters are the same as in Figure 4. The averages of the stochastic model solutions agree with the ODE solutions of Model 1.
Summary and Conclusions
We have developed a model of Ebola epidemics in West Africa that focuses attention on the elements of public health policies for containment of these epidemics. Our simulations for Sierra Leone, Liberia, and Guinea fit the cumulative reported cases for these countries up to September 23, 2014, and project future epidemic levels forward from September 23, 2014 (based on various parameterizations corresponding to these elements). Our projections indicate that the most important elements for containment of the epidemics within a relatively short time span are that
infectious cases (independent of contact tracing) are efficiently reported and isolated, with the average time between the appearance of symptoms and isolation less than 3 days (
 );
);contact traced incubating infected cases are efficiently monitored, with average probability of compliance, with isolation upon appearance of symptoms (such that no new cases are caused by individual), greater than 0.5 (
 ).
).
Also of importance in mitigation of the epidemics is a reduced rate at which infected deceased are improperly handled ( ), a sufficient number of contacts traced per identified infectious individual (
 ). The model allows quantification of the parameters corresponding to public health controls (
 ) for evaluating the impact of public health policies for the evolution of these epidemics.
Funding Statement
The authors are not funded for this work and have declared that no competing interests exist.
Contributor Information
Glenn Webb, Department of Mathematics, Vanderbilt University, Nashville, Tennessee, USA.
Cameron Browne, Department of Mathematics, Vanderbilt University, Nashville, Tennessee, USA.
Xi Huo, Department of Mathematics, Ryerson University, Toronto, Ontario, Canada.
Ousmane Seydi, Ecole Polytechnique de Thiès, Thiès, Sénégal.
Moussa Seydi, Department of Infectious Diseases, Cheikh Anta Diop University, Dakar, Senegal.
Pierre Magal, Université de Bordeaux, Bordeaux, France.
References
- 1.C. L. Althaus, Estimating the reproduction number of Zaire ebolavirus (EBOV) during the 2014 outbreak in West Africa, PLOS Currents Outbreak, September 2, 2014. [DOI] [PMC free article] [PubMed]
- 2.Center for disease control and Prevention, What is contact tracing? Contact tracing can stop the Ebola outbreak in its track. http://www.cdc.gov/vhf/ebola/pdf/contact-tracing.pdf
- 3.G. Chowell, N.W. Hengartner, C. Castillo-Chavez P.W. Fenimore, J.M. Hyman, The basic reproductive number of Ebola and the effects of public health measures: the cases of Congo and Uganda. J. Theoret. Biol., 229 (2004) 119-126. [DOI] [PubMed]
- 4.D. Fisman, E. Khoo, A. Tuite, Early epidemic dynamics of the West African 2014 Ebola outbreak: Estimates derived with a simple two-parameter model. PLOS Currents Outbreak, September 8, 2014. [DOI] [PMC free article] [PubMed]
- 5.M. Gomes, A. Pastore y Piontti, L. Rossi, D. Chao, I. Longini, M. Halloran, A. Vespignani, Assessing the international spreading risk associated with the 2014 West African Ebola outbreak. PLOS Currents Outbreak, September 2, 2014. [DOI] [PMC free article] [PubMed]
- 6.X. Huo, Modeling of contact tracing in epidemic populations structured by disease age, to appear.
- 7.J. Legrand, R.F Grais, P.Y. Boelle, A.J. Valleron, A. Flahault, Understanding the dynamics of Ebola epidemics. Epidemiology and Infection, 135 (4) (2007) 610-621. [DOI] [PMC free article] [PubMed]
- 8.P. Lekone and B. Finkenstadt, Statistical inference in a stochastic epidemic SEIR model with control intervention: Ebola as a case study. Biometrics, 62 (2006) 1170-1177. [DOI] [PubMed]
- 9.M. Meltzer, C. Atkins, S. Santibanez, B. Knust, B. Petersen, E. Ervin, S. Nichol, I. Damon, M. Washington, Estimating the future number of cases in the Ebola epidemic — Liberia and Sierra Leone, 2014–2015. CDC Centers for Disease Control and Prevention, September 26, 2014, 63 1-14. [PubMed]
- 10.H. Nishiura and G. Chowell, Early transmission dynamics of Ebola virus disease (EVD), West Africa, March to August 2014. Eurosurveil., 19 (36) (2014), September 11, 2014. [DOI] [PubMed]
- 11.C. Rivers, E. Lofgren, M. Marathe, S. Eubank, B. Lewis, Modeling the impact of interventions on an epidemic of Ebola in Sierra Leone and Liberia. arXiv:1409.4607v2 [q-bio.PE], September 16, 2014. [DOI] [PMC free article] [PubMed]
- 12.S. Towers, O. Patterson-Lomba, C. Castillo-Chavez, Temporal Variations in the Effective Reproduction Number of the 2014 West Africa Ebola Outbreak. PLOS Currents Outbreaks. 2014 Sep 18. Edition 1. doi: 10.1371/currents.outbreaks.9e4c4294ec8ce1adad283172b1 [DOI] [PMC free article] [PubMed]
- 13.P. van den Driessche and J. Watmough, Reproduction numbers and sub-threshold endemic equilibria for compartmental models of disease transmission. Math. Biosci.,180 (2002) 29-48. [DOI] [PubMed]
- 14.World Health Organization, Ebola Response Roadmap Situation Report 3, 12 September 2014. http://apps.who.int/iris/bitstream/10665/133073/1/roadmapsitrep3eng.pdf?ua$=$1
- 15.World Health Organization, Ebola virus disease, Global Alert and Response (GAR). http://www.who.int/csr/don/archive/disease/ebola/en/
- 16.World Health Organization, Situation reports: Ebola response roadmap, Global Alert and Response (GAR).} http://www.who.int/csr/disease/ebola/situation-reports/en/
- 17.World Health Organization, Case definition recommendations for Ebola or Marburg Virus Diseases. http://www.who.int/csr/resources/publications/ebola/ebola-case-definition-contact-en.pdf?ua=1
- 18.WHO Ebola Response Team, Ebola virus disease in West Africa --The first 9 months of the epidemic and forward projections. N. Engl. J. Med., September 23, 2014. [DOI] [PMC free article] [PubMed]
- 19.World Health Organization, Ebola situation assessment. http://www.who.int/mediacentre/news/ebola/17-october-2014/en/


