

Abstract
Nuclear lamins play important roles in the organization and structure of the nucleus; however, the specific mechanisms linking lamin structure to nuclear functions are poorly defined. We demonstrate that reducing nuclear lamin B1 expression by short hairpin RNA-mediated silencing in cancer cell lines to approximately 50% of normal levels causes a delay in the cell cycle and accumulation of cells in early S phase. The S phase delay appears to be due to the stalling and collapse of replication forks. The double-strand DNA breaks resulting from replication fork collapse were inefficiently repaired, causing persistent DNA damage signaling and the assembly of extensive repair foci on chromatin. The expression of multiple factors involved in DNA replication and repair by both nonhomologous end joining and homologous repair is misregulated when lamin B1 levels are reduced. We further demonstrate that lamin B1 interacts directly with the promoters of some genes associated with DNA damage response and repair, including BRCA1 and RAD51. Taken together, the results suggest that the maintenance of lamin B1 levels is required for DNA replication and repair through regulation of the expression of key factors involved in these essential nuclear functions.
INTRODUCTION
The lamins are type V intermediate-filament proteins found primarily within the nuclei of metazoan cells. The lamins play important roles in providing mechanical support and shape to the nucleus and also participate in various chromatin-associated processes, including DNA replication, polymerase (Pol) II transcription, DNA repair, mitotic-spindle formation, response to oxidative stress, and chromosome positioning (1). However, the exact mechanisms by which lamins are involved in these pathways remain largely unclear. Vertebrate cells express two types of lamins, the A types, lamins A and C (LA and LC), and the B types, lamin B1 (LB1) and lamin B2 (LB2). LA and LC are expressed in developmentally regulated patterns from a single gene, LMNA, by alternative splicing. In contrast, LB1 and LB2 are expressed from two different genes, with at least one B-type lamin being expressed in all cell types throughout development and differentiation (2).
A-type lamins have received the most attention in recent years because of the hundreds of mutations identified in LMNA that cause a spectrum of rare diseases known as laminopathies (3). The altered lamins produced because of these mutations have been shown to affect interactions with lamin-binding proteins, cause telomere dysfunction, disrupt the epigenetic regulation and organization of chromatin, and alter gene expression (4, 5). Accumulation of the unprocessed form of LA, called pre-LA, is also linked to the activation of DNA repair-regulating factors and checkpoint kinases, which possibly contribute to impaired cell cycle progression and replication arrest (6, 7). Pre-LA has also been reported to cause the accumulation of unrepaired DNA because of delayed recruitment of DNA repair proteins to DNA damage sites (8). In contrast to the numerous mutations in A-type lamins, mutations in the B-type lamins are rare. The only known disease involving LB1 is adult-onset autosomal dominant leukodystrophy (ADLD), a progressive demyelinating disease caused by the overexpression of LB1 in neurons because of either gene duplication or a mutation in the LMNB1 promoter (9). Further analyses of ADLD patients' cells have revealed that this overexpression causes the disorganization of inner nuclear membrane proteins and chromatin and the downregulation of myelin gene expression (10). Studies of mouse models made null for LB1 expression or expressing a truncated form of LB1 show defects in organogenesis, especially of the brain (11–13). However, skin keratinocytes, hepatocytes, or embryonic stem cells derived from these mice proliferate normally, have no obvious nuclear abnormalities, and show only minor changes in their transcription profile in comparison to wild-type cells (13, 14). The expression of the B-type lamins in cancer cells has not been extensively explored, although decreases in LB1 expression have been reported in neoplasms of the gastrointestinal tract (15) and in some subtypes of lung cancer (16). In light of these findings and the paucity of LB1 mutations, it appears that the levels of LB1 in the nucleus need to be tightly controlled.
We and others have shown that LB1 expression is reduced during normal replicative senescence in cultured human diploid fibroblasts and in aged mouse and human tissues (17–19). In addition, we demonstrated that transient and almost complete silencing of LB1 expression in various tumor cells causes a delayed response to UV-induced DNA damage repair (DDR) (20). Moreover, this dramatic LB1 silencing in tumor cells rapidly induces cell cycle arrest at G1. However, conflicting findings by several groups on the effects of experimentally induced LB1 depletion or overexpression on cell proliferation and senescence in cultured normal fibroblasts suggest that the mechanisms by which LB1 regulates cell proliferation are complex (17, 18, 21). In order to further investigate the role of LB1 in cell proliferation and DNA repair, we examined the effects of partial downregulation of LB1 protein expression in human osteosarcoma cells. We find that the stable moderate downregulation of LB1 has a profound effect on the regulation of DNA replication and DDR.
MATERIALS AND METHODS
Cell culture and silencing.
The human osteosarcoma U-2-OS (ATCC HTB-96) and colorectal carcinoma HCT116 (ATCC CCL-247) cell lines were cultured in McCoy's 5a medium supplemented with 10% fetal bovine serum (FBS), 100 U/ml penicillin, and 100 μg/ml streptomycin. Cells were maintained at 37°C in a humidified atmosphere and 5% CO2. For silencing of LB1 expression, we used the retrovirus vector pSilencer-HsLMNB1shRNA (shLB1-1) and lentivirus vector TRCN0000029273 obtained from Open Biosystems (shLB1-2). The retrovirus vector pSilencer-Scrambled (Sc) was used as a control (18). For retrovirus and lentivirus production, 20 μg of virus vector and 1 μg of pVSV-G (Clontech) were electroporated into GP2-293 packaging cells (Clontech). Virus-containing culture supernatants were collected 48 h following electroporation. For transduction of U-2-OS, the supernatants containing virus were diluted 3-fold with fresh medium containing 8 μg/ml Polybrene (Sigma-Aldrich) and incubated on the target cells for 24 h. Subsequently, the culture medium was replaced with complete medium containing 3 μg/ml puromycin (Sigma-Aldrich) for selection of virus-transduced cells. Cells at population doubling 3 (PD3) following silencing and selection were used for analysis. PDs were calculated with the equation PD = log(Nh/Ns)/log2, where Nh is the number of harvested cells and Ns is the number of seeded cells (18).
Immunoblotting.
Total cell lysates were prepared by solubilization in Laemmli gel sample buffer (22). The protein concentration of samples was determined with the BCA protein assay (Thermo Scientific). Equal amounts of protein from each sample were separated by SDS-PAGE on 10% gels and transferred to nitrocellulose. The primary antibodies used for immunoblotting were mouse anti-LA/C (5G4), rabbit anti-LB1 (23), mouse anti-LB1/2 (2B2), rabbit anti-MRE11, rabbit anti-NBS1, rabbit anti-HP1, rabbit anti-SUMO1, rabbit anti-Chk1, rabbit anti-p-Chk1 (S417; Cell Signaling), mouse anti-replication protein A2 (anti-RPA2)/RPA32, mouse anti-RAD50, rabbit anti-DNA-dependent protein kinase catalytic subunit (anti-DNA-PKcs), rabbit anti-RAD51, mouse anti-p53 (DO-1), rabbit anti-ATR, rabbit anti-pATR, mouse anti-proliferating cell nuclear antigen anti-(PCNA; PC10), rabbit anti-DDB1, rabbit anti-53BP1, goat anti-Ku80 (Santa Cruz Biotechnology), rabbit anti-pRPA32 (Bethyl Labs), mouse anti-γH2AX (JBW301), mouse anti-BRCA1 (MS110) (Millipore), mouse antiactin (Sigma), and mouse anti-glyceraldehyde 3-phosphate dehydrogenase (anti-GAPDH) (FF26A/F9; BioLegend, Inc.). Secondary antibodies conjugated with horseradish peroxidase (1 mg/ml; KPL) were used at a dilution of 1:50,000, and peroxidase activity was detected with the SuperSignal West Pico chemiluminescence detection kit (Thermo Scientific). Images were quantified with Odyssey Fc (Li-COR Biosciences) software.
Immunofluorescence.
U-2-OS Sc and shLB1 cells at PD3 grown on glass coverslips were fixed in methanol for 10 min at −20°C and then extracted with 0.1% Triton X-100 in phosphate-buffered saline (PBS) for 10 min at 22°C. The primary antibodies used for immunofluorescence were mouse anti-LB1/2, rabbit anti-LB1 (23), mouse anti-γH2AX (JBW301; Millipore), and rabbit anti-53BP1 (Santa Cruz Biotechnology). The secondary antibodies used included goat anti-mouse IgG–Alexa Fluor 488 and goat anti-rabbit IgG–Alexa Fluor 568 (Invitrogen). DNA was stained with 1 ng/ml Hoechst 33258 (Invitrogen). After staining, coverslips were mounted on slides in 20 mM Tris-Cl (pH 9.0) with 50% glycerol and 1% p-phenylenediamine (Sigma-Aldrich). Images were obtained with a Zeiss LSM 510 microscope with oil immersion objective lenses (Plan-Apochromat 63× and 100×, 1.40 numerical aperture [NA]).
BrdU labeling.
Detection of DNA replication was carried out as described previously (18). Cells were incubated with 50 μM bromodeoxyuridine (BrdU; Sigma-Aldrich) in complete medium for 40 min at 37°C. BrdU-labeled DNA was detected with rat anti-BrdU antibody (Sigma-Aldrich), followed by goat anti-rat IgG–Alexa Fluor 488 antibody (Invitrogen) and analyzed by fluorescence-activated cell sorting (FACS; BD LSRFortessa) or with a Zeiss LSM 510 microscope with oil immersion objectives (Plan-Apochromat 63× and 100×, 1.40 NA).
ELISA with an anti-BrdU antibody.
Cells (1 × 10⁶) were cultured in 10-cm dishes incubated for 24 h with 50 μM BrdU for 40 min at 37°C in a humidified atmosphere and 5% CO2. After the incubation period, the BrdU-containing medium was removed and the cells were stained with Vybrant DyeCycle stain (Life Technologies) according to the manufacturer's protocol. The cells were then sorted by FACS (BD FacsAria SORP 5-Laser). Cells from each cell cycle phase were collected and stored on ice. Genomic DNA was purified from cells at different cell cycle phases immediately after sorting with the QIAamp blood kit (Qiagen). BrdU detection was performed with 30 ng of genomic DNA from each sample immobilized per well of a 96-well plate with the mouse BrdU-specific monoclonal antibody (Abcam). The bound anti-BrdU antibody was detected with peroxidase-conjugated goat anti-mouse IgG antibody (Zymed) and o-phenylenediamine (Sigma). The optical density (OD) at 492 nm of reaction products was measured. The percentage of BrdU in each sample was calculated as the ratio of the OD of each BrdU-labeled cell sample to that of DNA isolated from unlabeled cells sorted in the same manner for each cell cycle phase. The experiment was repeated three times, and the enzyme-linked immunosorbent assay (ELISA) was performed in quadruplicate.
ChIP.
Control, Sc, and shLB1 U-2-OS cells were cross-linked in 1% formaldehyde in serum-free medium for 10 min at room temperature, and unreacted formaldehyde was quenched by washing with 125 mM glycine in serum-free medium. Nuclei were isolated by swelling the cells in hypotonic buffer (10 mM HEPES-K+ [pH 7.9], 10 mM KCl, 1.5 mM MgCl2, 0.5 mM DTT, 0.2 mM PMSF, 1× protease inhibitor cocktail [Roche]), followed by cell lysis with the addition of NP-40 to 0.5%. The cytoplasmic and nucleus-enriched fractions were separated by centrifugation at 13,000 × g. For the lamin chromatin immunoprecipitation (ChIP)-quantitative PCR (qPCR) procedure, the nuclear pellet was resuspended in nuclear lysis buffer (50 mM Tris-HCl [pH 8.1], 1.5 mM MgCl2, 10 mM EDTA, 0.5% SDS, 1 mM dithiothreitol [DTT], 1× protease inhibitor cocktail [Roche]). For BrdU ChIP, enriched soluble sheared chromatin was prepared by resuspension of the nuclear pellet in isotonic buffer (50 mM Tris-HCl [pH 7.4], 150 mM NaCl, 1.5 mM MgCl2, 1 mM EDTA, 1 mM DTT, 1× protease inhibitor cocktail [Roche]), solubilization by sonication of the suspension eight times for 15 s each with at least 1 min on ice between pulses, and centrifugation at 13,000 × g for 10 min. The average DNA fragment size was measured as 500 to 1,000 bp by agarose gel electrophoresis. Soluble BrdU-labeled chromatin was denatured by incubation at 95°C for 2 min and chilling on ice for 5 min and then immunoprecipitated with a rat anti-BrdU antibody (Novus Biological). The denaturation had no effect on the amount of precipitated DNA or cross-linking of proteins to BrdU-labeled DNA. For some experiments, the sheared chromatin was precipitated with rabbit anti-LB1 (Abcam ab16048) or mouse anti-LA/C (5G4) antibodies without prior denaturation. Cross-linking was reversed overnight at 65°C in elution buffer (0.1 M NaHCO3, 1% SDS) in the presence of 0.3 M NaCl and 40 μg/ml RNase A. Precipitated proteins that bind BrdU-labeled DNA were analyzed by immunoblotting. In parallel, chromatin was digested at 37°C for 2 h with proteinase K (Sigma) and then extracted with phenol-chloroform. qPCR was used to amplify and analyze precipitated DNA with specific primers. The sequences of the primer used are available upon request.
DNA fiber assays.
The number of replication sites and the processivity of replication were measured by indirect immunofluorescence microscopy of isolated DNA fibers labeled in situ by incorporation of halogenated nucleosides. For labeling with a single nucleoside, Sc and shLB1 U-2-OS cells were incubated with 50 μM BrdU (Sigma-Aldrich) in complete medium for either 40 min or 2 h at 37°C. For labeling with two nucleosides, Sc and shLB1 cells were first incubated with 50 μM 5-chloro-2′-deoxyuridine (CldU) for 40 min at 37°C, washed with PBS, and then treated with 4 mM hydroxyurea (HU) for 4 h at 37°C to induce replication fork stalling. Following HU treatment, the cells were washed three times with PBS and then incubated with 50 μM iododeoxyuridine (IdU) for 40 min at 37°C. DNA fibers were prepared and stained as previously described (24). Briefly, single- or double-labeled cells were trypsinized and resuspended in ice-cold PBS at 2 × 10⁵/ml. The labeled cells were diluted 1:10 with unlabeled cells, and 3 μl of the mixed-cell suspension was mixed with 9 μl of lysis buffer (0.5% SDS in 200 mM Tris-HCl [pH 7.4], 50 mM EDTA) on a glass slide. After 5 min, the slides were tilted gradually at 15 to 30° to spread the DNA fibers and then air dried, fixed in 3:1 methanol-acetic acid, and stored dry in the dark.
Before immunolabeling of the DNA fibers, the slides were dehydrated by overnight incubation in 70% ethanol at 4°C, followed by incubation in ice-cold methanol for 30 min at room temperature and washing in PBS. The DNA was then denatured in 2.5 M HCl for 1 h, and the slides were washed several times in PBS. Nonspecific binding to the slides was blocked by incubation in PBS containing 3% bovine serum albumin and 0.05% Tween 20. The slides were then incubated at room temperature for 1 h with a rat anti-BrdU antibody that specifically detects CldU and a mouse anti-BrdU antibody that detects IdU and does not cross-react with CldU (24). The secondary antibodies used to detect the anti-BrdU antibodies were goat anti-mouse IgG–Alexa Fluor 488 and goat anti-rat IgG–Alexa Fluor 568 (Invitrogen). Images were obtained with a Zeiss LSM 510 Meta confocal microscope with oil immersion objective lenses (Plan-Apochromat 63× and 100×, 1.40 NA).
DSB repair analysis.
Double-strand break (DSB) repair by homologous recombination (HR) or nonhomologous end joining (NHEJ) was analyzed with a vector system based on the reconstitution of an enhanced green fluorescent protein (EGFP)-encoding gene as described previously (25–27). Briefly, Sc or shLB1 cells were electroporated (Gene Pulser Xcell; Bio-Rad) with a plasmid mixture containing 10 μg of the SceI meganuclease expression plasmid (pCMV-I-SceI) and 10 μg of one of the DSB repair substrates (EJ-EGFP or HR-EGFP/3′EGFP) or 10 μg of wild-type EGFP plasmid (to determine transfection efficiency). After 24 h, cellular fluorescence originating from recovered EGFP was quantified by FACS (BD LSRFortessa). The DSB repair frequency was estimated as the fraction of EGFP-positive cells and calibrated to the transfection efficiency, which was determined in parallel. We used the two-tailed Student t test for statistical analysis and evaluation of the significance of differences that were observed between tested cells.
Cell cycle analysis.
For cell cycle analysis, 1 × 10⁶ Sc and shLB1 cells were collected by trypsinization at PD3 following selection, washed once with PBS, and fixed in 100% ethanol. The fixed cells were treated with RNase A and 0.1% Triton X-100 in PBS for 3 h at room temperature and then stained with propidium iodide (PI). The distribution of cells according to cell cycle phase was determined by FACS (BD LSRFortessa). For sorting of live Sc and shLB1 cells, cultures were plated at 2 × 10⁶ cells/10-cm plate and cultured for 24 h. The cells were collected by trypsinization, washed with PBS, and then stained with Vybrant DyeCycle stain (Life Technologies) according to the manufacturer's protocol. Cells at different cell cycle stages were obtained by FACS (BD FACSAria SORP 5-Laser).
Apoptosis assay.
The number of cells in apoptosis was determined with the annexin V apoptosis assay (Clontech, Mountain View, CA) by following the manufacturer's instructions. Cells were counted by FACS following DNA staining with PI.
Clonogenicity assay.
The clonogenicity assay was performed as previously shown (28, 29). Briefly, a total of 3 × 10⁶ cells were seeded per 10-cm2 dish in 10 ml of McCoy's 5a medium supplemented with 10% FBS, 100 U/ml penicillin, and 100 μg/ml streptomycin and maintained at 37°C in a humidified atmosphere and 5% CO2. Sc and shLB1 cells were treated with 2.5 μg/ml bleomycin (BLM) or 10 μM camptothecin (CMPT) for 48 h. Afterwards, cells were washed twice with 1× PBS, harvested, and counted and 5,000 of the surviving cells (Sc or shLB1) were replated per 10-cm2 dish. The assay was terminated at day 10. Colonies were fixed with 95% methanol, stained with 1:5 trypan blue solution, and counted.
Statistical analysis.
We used the two-tailed Student t test for statistical analyses. All of the results presented are the mean values ± the standard deviations from three separate experiments. We considered results significant when the P value was ≤0.05.
Gene expression analysis.
Expression of genes associated with DDR and damage signaling was analyzed with Human DDR and DNA Damage Signaling PCR arrays according to the manufacturer's protocol (SABiosciences, Qiagen). Each experiment was repeated at least twice with parallel cultures and four technical repeats. In addition, analyses of specific genes that were not included in arrays were performed on total cDNA from Sc and shLB1 cells as previously described (18). The primers for gene-specific analysis by quantitative reverse transcription (qRT)-PCR were obtained from Qiagen (QuantiTect primer assay kits). All qRT-PCR and PCR array analyses were carried out with a LightCycler 480 real-time PCR instrument (Roche) with the LightCycler 480 SYBR green master kit (Roche). Relative expression analysis was carried out with the LightCycler 480 real-time PCR software with the gene for GAPDH serving as the reference. Quantitative results are shown as the mean values of four separate experiments. With the Student t test (P value of ≤0.05), a change in the expression of a specific gene was considered significant if the change was greater than 1.7-fold or less than 0.6-fold.
Functional analysis of genes.
The Database for Annotation, Visualization, and Integrated Discovery (DAVID) was used to functionally cluster differentially regulated genes (30, 31). On the basis of the gene ontology annotations obtained, selected gene clusters and pathways (P < 0.05; false-discovery rate [FDR], 0.05) were organized. The heat map for the differentially regulated genes was plotted with MATLAB.
RESULTS
Decrease of LB1 expression slows the progression of cells through S phase.
Previously, we showed that the transient silencing of LB1 expression by ∼80% in human tumor cell lines led to a rapid G1 cell cycle arrest and defective recognition and repair of UVC-induced DNA damage (20). In order to further characterize the role of LB1 in cell cycle regulation and DNA damage responses, we modulated LB1 expression by stably expressing short hairpin RNAs (shRNAs) targeting the LMNB1 transcript in the human osteosarcoma cell line U-2-OS or the human colon cancer cell line HCT116 (18). Similar results were obtained with both cell lines and both shRNAs, excluding the possibility of off-target effects. We focused our attention on cell populations where LB1 levels were reduced by ∼45 to 50%, as determined by immunoblotting (Fig. 1A), since we found that these cells would continue to proliferate. We used the stable expression of a scrambled-sequence shRNA as a control throughout these studies (Fig. 1A, Sc). LB1 silencing did not affect the levels of LA/C or LB2 expression (Fig. 1A). The decrease in LB1 levels after silencing was accompanied by a significant attenuation of cell proliferation and lengthening of the PD time of U-2-OS cells by ∼2.7-fold (Fig. 1B). For all of the following experiments, we used these slowly proliferating shLB1 cells at PD3 following selection. Analyses of the cell populations by FACS revealed an accumulation of shLB1 cells in S phase and a decrease in the G0/G1 and G2 phases (Fig. 1C). In order to more precisely determine the timing of the cell cycle arrest, we labeled cells with BrdU and fractionated the BrdU-labeled populations of G1/S cells into G1, early S, and late S phases. The population of cells in early S phase was significantly greater in shLB1 cells than in Sc cells (>70% versus 50% for U-2-OS and ∼65% versus 50% for HCT116), whereas the population of shLB1 cells in late S was smaller than that of Sc cells (<7% versus 20%) (Fig. 1D). The relative percentage of G1 cells was slightly lower in shLB1cells than in Sc cells (≤23% versus 30%). Taken together, these results suggested that reducing LB1 levels causes a significant slowing of the passage of cells through early S phase.
FIG 1.

Reduction of LB1 levels slows proliferation and DNA replication in U-2-OS and HCT116 cell lines. (A) LB1, LB2, LA, and LC protein levels were measured by immunoblotting at PD3 following silencing and selection. (B) The proliferation rates of shLB1 and Sc cells were compared for 5 days following silencing and selection. Proliferation rates were determined as described in Materials and Methods. U-2-OS: shLB1-1 (n = 9), P = 2.21 × 10⁻⁵; shLB1-2 (n = 3), P = 1.46 × 10⁻⁴. HCT116 (n = 3), P = 1.87 × 10⁻⁵. Error bars represent standard deviations. (C) FACS analysis of the complete cell cycle. U-2-OS: shLB1-1 (n = 5), P = 1.6 × 10⁻³; shLB1-2 (n = 3), P = 2.2 × 10⁻⁴. HCT116 (n = 3), P = 2.2 × 10⁻³. (D) FACS analysis of G1 and S phases in Sc and shLB1 cells. U-2-OS shLB-1 (n = 3): early S, P = 4.8 × 10⁻³, late S, P = 2.3 × 10⁻⁴. shLB-2 (n = 3): early S, P = 2.39 × 10⁻³; late S, P = 4.1 × 10⁻⁴. HCT116 shLB-1 (n = 4): early S, P = 3.72 × 10⁻³; late S, P = 2.75 × 10⁻³. (E) Detection of LB1 (red) and BrdU (green) incorporation into replicating DNA following 40 min of labeling in the nuclei of Sc and shLB1 cells (DNA stained with Hoechst, blue). More than 600 cells of each type were counted, and images of single representative nuclei are shown. U-2-OS: shLB-1 (n = 4), P = 2.3 × 10⁻²; shLB-2 (n = 3), P = 4.7 × 10⁻³. HCT116 shLB-1 (n = 3), P = 2.12 × 10⁻³. (F) Detection of BrdU by ELISA. Sc and shLB1 cells where fractioned according to cell cycle phase by FACS and labeled with BrdU for 40 min. BrdU was detected in isolated genomic DNA by ELISA as described in Materials and Methods. The experiment was repeated five times, and each DNA sample was subjected to ELISA in quadruplicate. U-2-OS shLB-1 (n = 5): all, P = 0.0024; early S, P = 0.00012; late S, P = 0.00048. shLB-2 (n = 3): all, P = 0.0039; early S, P = 0.0023; late S, P = 0.0011. HCT116 shLB1 (n = 3): all, P = 0.0054; early S, P = 0.009; late S, P = 0.0032. Error bars represent standard deviations. The asterisks in panels C to F indicate statistically significant differences.
The accumulation of cells in S phase was further supported by detection of BrdU incorporation by immunofluorescence. After labeling with BrdU for 40 min, the number of shLB1cells incorporating BrdU was increased, indicating a longer S phase, but they had significantly fewer (∼50%) BrdU-positive foci than Sc cells (Fig. 1E). As a more quantitative measure of BrdU incorporation, S phase Sc and shLB1 cells obtained by FACS were labeled with BrdU for 40 min. After extraction of the DNA from each cell population, we performed an ELISA of BrdU incorporation. As expected from the reduced number of BrdU foci in shLB1 cells, the overall incorporation of BrdU was significantly lower in S phase shLB1 cells than in Sc cells (Fig. 1F, all). Further separation of the S phase cell population into early and late S phases demonstrated that most of the BrdU incorporation into shLB1 cells was in the early S population, with much less incorporation into late S phase cells (Fig. 1F, early S and late S). These results suggest that reducing LB1 expression allows cells to enter S phase but slows the progression through early S phase.
LB1 does not interact directly with newly replicated chromatin.
Previously, we showed that B-type lamins are associated with replication foci in mid-to-late S phase by immunofluorescence colocalization of LB1 and BrdU (23). This finding, coupled with the reduced replication we observed in shLB1 cells, suggested that the loss of LB1 may affect the assembly of replication complexes. To test the possibility that LB1 directly interacts with the replication complex, we labeled replicating DNA in Sc and shLB1 cells by incorporation of BrdU for 40 min and performed BrdU ChIP with antibodies specific to BrdU. We then analyzed the immunoprecipitated DNA by qPCR for a set of nine previously characterized early and late S phase origins of replication (Fig. 2A) (32). As expected from the results described in Fig. 1, the immunoprecipitation of BrdU-labeled chromatin was significantly lower in shLB1 cells than in Sc cells. Out of nine origins of replication probed, eight incorporated BrdU significantly less in shLB1 cells than in Sc cells (Fig. 2A), suggesting that most origins of replication are affected by the reduction of LB1 levels.
FIG 2.

Association of lamins with actively replicating chromatin. (A) Analysis of DNA replication at nine origins of replication in Sc and shLB1 cells. After 40 min of labeling with BrdU, DNA was precipitated from a soluble chromatin fraction with specific anti-BrdU antibodies. Input and precipitated DNA samples were analyzed by qPCR. This experiment was repeated three times with four technical repeats of the qPCR analysis. The decrease in the precipitation of eight origins of replication was significant in shLB1 (n = 3, P < 0.003). (B) BrdU ChIP analysis of proteins associated with replicating chromatin. Nonsilenced U-2-OS cells were labeled with BrdU for 40 min. Soluble and insoluble chromatin fractions were prepared from nuclei as described in Materials and Methods. Proteins were analyzed by immunoblotting with specific antibodies. The experiment was repeated five times. (C) Direct interaction of LB1 and LA/C with actively replicating chromatin in Sc and shLB1 cells. Soluble chromatin fractions were immunoprecipitated with specific anti-LB1 or LA/C antibodies. Input and precipitated DNA samples were analyzed with qPCR. This experiment was repeated four times with five technical repeats of qPCR analysis. Error bars represent standard deviations. Asterisks indicate statistically significant differences.
Several studies have suggested that lamins can interact with sites of replication to affect the efficiency of replication; however, a direct biochemical interaction of lamins with sites of replication has not been demonstrated (5, 23, 33). In order to determine if the LB1-dependent decrease in DNA replication was due to a direct interaction of lamins with newly replicating DNA, we performed the BrdU ChIP procedure with nonsilenced cells followed by immunoblotting of the precipitated proteins for the presence of replication factors and lamins. The replication factor PCNA served as a positive control for replicating DNA and was enriched in the BrdU ChIP preparation, whereas the heterochromatin protein HP1, a marker for heterochromatin, was not detected (Fig. 2B). LA and LC were strongly enriched in the BrdU ChIP preparation, but LB1 or LB2 was not. Since LB1 was not enriched with newly replicated chromatin, this suggests that the role of LB1 in replication is not direct.
The association of LA/C but not LB1 with newly replicated chromatin was supported by ChIP analyses of chromatin from Sc and shLB1 cells with specific antibodies to LA/C and LB1 (Fig. 2C). We reexamined the nine replication origin-containing chromatin regions analyzed by BrdU ChIP (Fig. 2A) to determine if they were associated with lamins. Of the nine origins analyzed by qPCR following ChIP with antilamin antibodies, five interacted with LA/C. In contrast, only two, ZFP42 and MMP15, showed measurable binding to LB1, and this binding was significantly less robust than interactions of the same regions with LA/C (Fig. 2C). The silencing of LB1 expression had no significant effect on most of the LA/C-chromatin interactions, with the exception of MMP15, which showed a significant reduction in LA/C interaction in shLB1 cells. Notably, of the two LB1-interacting regions, MMP15 appeared to be more strongly affected by LB1 silencing than ZFP42 did. These results suggest that most origins of replication are not directly associated with LB1, but those that are may have different strengths of interaction with this lamin.
Downregulation of LB1 affects the elongation phase of DNA synthesis and leads to replication fork stalling.
From the previous experiments, we could not determine if the reduction of LB1 affected the initiation of replication or the elongation phase. In order to evaluate the effect of LB1 reduction on the extension of replication forks, we employed DNA fiber analysis (24). Consistent with our immunofluorescence, ELISA, and ChIP results showing reduced BrdU incorporation into shLB1 cells (Fig. 1E and F and 2A), DNA fiber analysis after 40 min of BrdU labeling showed that shLB1 cells incorporated BrdU into much shorter fibers than Sc cells did (Fig. 3A). Increasing the labeling with BrdU to 2 h led to the formation of longer BrdU-containing DNA fibers in both Sc and shLB1 cells; however, the latter were still significantly shorter than the DNA fibers seen after 40 min in control cells. The average length of DNA fibers from shLB1 cells was 2 to 2.4 times shorter than that of fibers extracted from Sc cells after either 40 min or 2 h of labeling with BrdU (Fig. 3B). The shorter fibers in shLB1 cells suggested that the stability of the replication fork might be affected by the decreased LB1 levels. We tested the relative stability of replication forks in Sc and shLB1 cells by labeling replicating DNA with CldU and then adding HU to deplete the nucleotide pool. After the HU was washed out, the ability of replication forks to restart was tested by labeling with IdU (Fig. 3C). In Sc cells, we detected long DNA fibers labeled with both CldU and IdU, indicating that replication forks were able to restart after HU removal. The majority of the DNA fibers prepared from shLB1 cells were 3 to 3.6 times shorter than those prepared from Sc cells and were labeled mainly with CldU with very little incorporation of IdU (Fig. 3C). The majority (75 to 80%) of the replication forks were unable to restart upon the removal of HU from LB1-reduced cells (Fig. 3C). This result suggests that replication forks are unstable in cells with decreased LB1 levels and the failure of shLB1 cells to progress efficiently through S phase is due to problems in maintaining the replication fork, leading to replication fork stalling and collapse.
FIG 3.

Analysis of the elongation phase and replication fork stability. (A, B) Analysis of replication in Sc and shLB1 cells by single-label DNA fiber analysis. Incorporated BrdU was detected in extracted DNA fibers with specific anti-BrdU antibodies following 40 min or 2 h of labeling. Fiber length was measured with 250 fibers analyzed for each cell type (n = 7; 40 min, P = 0.0004; 2 h, P = 0.002). Representative images are shown. (C) Analysis of replication fork stability. Sc and shLB1 cells were incubated with CldU for 40 min; this was followed by the addition of HU and 4 h of incubation to deplete the nucleotide pool and cause replication fork stalling. HU was then removed, and the cells were labeled with CldU for 40 min. DNA fiber extraction and double staining were done as described in Materials and Methods. CldU (red) incorporation represents DNA replication before replication fork stalling was induced. IdU (green) represents recovery of stalled replication forks after HU removal. In each experiment, 300 fibers were analyzed for each cell type and the length of the separated track was measured. U-2-OS shLB1-1 (n = 5), P = 2.74 × 10⁻³; shLB-2 (n = 3), P = 2.53 × 10⁻³; HCT116 shLB-1 (n = 3), P = 2.15 × 10⁻³. Representative images are shown. Asterisks indicate statistically significant differences. (D) Immunoblot analyses of proteins associated with replication in total Sc and shLB1 cell lysates. GAPDH served as a loading control. (E) Analysis of proteins associated with replicating chromatin in U-2-OS cells. Sc and shLB1 cells were incubated with BrdU for 40 min or 2 h. Soluble chromatin fractions were prepared from nuclei as described in Materials and Methods for BrdU ChIP. Proteins were analyzed by immunoblotting following BrdU ChIP.
To test the effect of 50% reduced LB1 levels on the activation and recruitment of replication factors to restart stalled replication forks, we first examined the effects of LB1 silencing on the expression of two known replication and repair factors, PCNA and RPA32. RPA is recruited to stalled replication forks and is necessary to recruit additional repair factors to restart replication (34–37). The total cellular levels of PCNA and RPA32 were not affected by the reduction in LB1; however, the phosphorylation of RPA32 (pRPA32) was decreased (Fig. 3D). In order to determine if the association of these factors with replicating DNA was altered, we carried out BrdU ChIP with Sc and shLB1 cells labeled with BrdU for 2 h to allow sufficient incorporation of BrdU into shLB1 cells since our previous experiments had shown that shLB1 cells have decreased rates of replication. When the proteins bound to equal amounts of BrdU-labeled DNA were compared, the interactions of both PCNA and RPA32 with BrdU-labeled DNA were reduced, consistent with the reduced amount of replication in shLB1 cells and the instability of the replication forks. Notably, the amounts of PCNA and RPA32 present in the soluble material used for immunoprecipitation were not changed by LB1 reduction (Fig. 3E). However, the reduction in phosphorylation of pRPA32 suggests that signaling due to DNA damage at the replication forks is deficient. Taken together, our results suggest that decreased LB1 expression affected the elongation phase of replication, probably by decreasing the stability of the replication fork.
Increased DNA damage and chromosome instability in cells with reduced LB1 levels.
The stalling and collapse of replication forks can lead to an increase in the formation of DSBs if they are not repaired in a timely manner (38–41). DSBs are associated with remodeling of chromatin near the damage sites and the formation of distinct foci containing the DNA damage-signaling proteins phosphorylated histone H2AX (γH2AX) and 53BP1 (42–44) (Fig. 4A). Consistent with the formation of stalled or collapsed replication forks, a significantly greater number of shLB1 cells exhibited larger and more numerous γH2AX- and 53BP1-positive foci than did Sc cells (Fig. 4A to C). These results support the idea that reduced LB1 expression leads to an increase in DSBs because of the stalling and collapse of replication forks.
FIG 4.
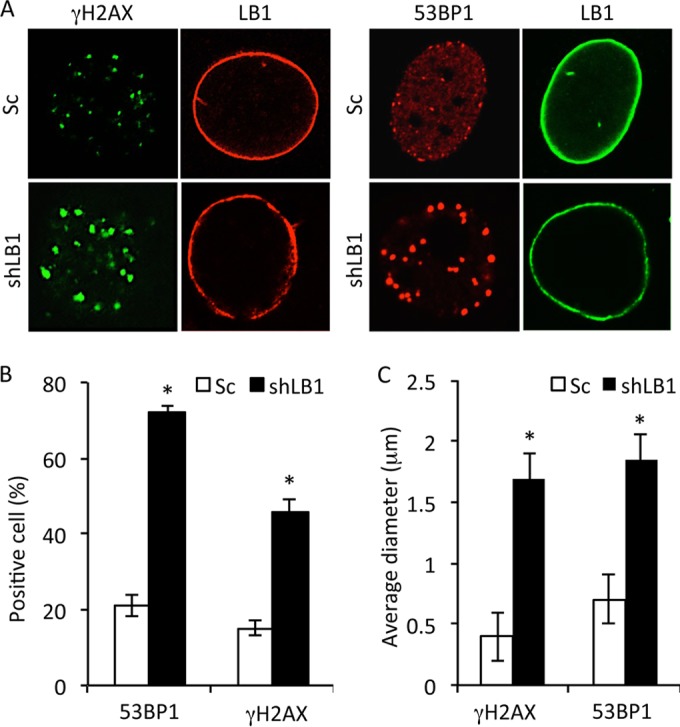
Reduction of LB1 levels leads to accumulation of DNA damage and activation of a persistent DNA damage response. (A) Sc and shLB1 cells were fixed at PD3 and stained with antibodies specific to LB1 (red) and γH2AX (green) or 53BP1 (red) and LB1 (green). Images of single representative nuclei are shown. (B) DNA damage assayed by localization of 53BP1 or γH2AX in the nuclei of Sc and shLB1 cells at PD3. More than 700 nuclei were examined for each protein. (n = 4; 53BP1, P = 0.0018; γH2AX, P = 0.0075). (C) Average sizes of γH2AX and 53BP1 foci in nuclei of Sc and shLB1 cells at PD3. The diameters of the foci were measured with ImageJ software. More than 400 nuclei were examined for each protein, and at least 20 foci/nucleus were measured (n = 4; γH2AX, P = 0.0102; γH2AX, P = 0.0013). Error bars represent standard deviations. Asterisks indicate statistically significant differences.
Changes in the expression of DDR factors and cell cycle regulators in shLB1 cells.
The persistence of DNA damage foci suggested that the ability of shLB1 cells to repair DSBs due to collapsed replication forks may also have been impaired. Deficiencies in repair could be due to the dysregulation of genes encoding factors responsible for the recognition, signaling, and repair of DSBs. Previously, we showed that transient silencing of LB1 expression by >80% caused a significant decrease in the transcription of genes encoding proteins that regulate the activation of nucleotide excision repair (NER) in response to UVC (20). In light of this finding, we analyzed the expression of 161 genes involved in cell cycle, apoptosis, DDR, and various DNA repair pathways by PCR arrays and qRT-PCR of RNA isolated from Sc and shLB1 cells (Fig. 5; see Table S1 in the supplemental material). The mRNA levels of 97 genes were altered by more than 2-fold in shLB1 cells compared to those in Sc cells; 55 genes were upregulated, and 42 genes were downregulated. We examined the levels of several replication and repair factor proteins that were up- or downregulated, including 53BP1, γH2AX, ATR, DNA-PKcs, Ku80, BRCA1, RAD51, MRE11, RAD50, and NBS1, in order to determine if their levels were also altered in shLB1 cells. The level of SUMO1 modification of proteins was also determined, as this posttranslation modification regulates the activity of several DNA repair factors. As expected from the immunofluorescence results demonstrating increases in the size of γH2AX and 53BP1 foci in shLB1 cells (Fig. 4A), the expression and posttranslational modification of 53BP1 and γH2AX also increased following downregulation of LB1 expression (Fig. 6A). Of all the other proteins examined, only BRCA1 showed a large level increase, while ATR, RAD50, and MRE11 showed modest increases in shLB1 cells. In addition, phosphorylation of ATR also increased. In contrast, the expression of DNA-PKcs, NBS1, and RAD51 was dramatically reduced in shLB1 cells, although the expression of a major cofactor of DNA-PKcs, Ku80, was not affected. Additionally, we used an indirect method to assess SUMO1 modifications by the detection of SUMOylated RanGAP1, a major SUMO-modified protein. The levels of SUMOylated RanGAP1 and other high-molecular-weight SUMOylated proteins were reduced in shLB1 cells, suggesting that the SUMO1 modification of DDR factors may also be compromised in shLB1 cells. The reduction of LB1 levels also appeared to activate p53, as evidenced by the increased p53, Chk1, and pChk1 levels. Since many of the factors that we examined are involved in multiple repair pathways, we next determined which of the major DSB repair pathways are compromised in shLB1 cells.
FIG 5.

(A) Color-coded map showing genes differentially regulated in Sc and shLB1 cells. The fold change is absolute with P values of <0.05. (B) Gene ontology analysis of differentially regulated genes in Sc and shLB1 cells showing functional clusters of genes. The functional clusters were obtained with DAVID. Significant clusters (P < 0.05; FDR, <0.05) were plotted with KRONA (78). The number of genes in each cluster is shown. (C) Significant pathways (P < 0.05; FDR, <0.05) were plotted as a pie chart for differentially regulated genes by DAVID and KEGG (79) pathway analysis. The number of genes in each pathway is shown.
FIG 6.

Immunoblotting of DNA damage response- and repair-associated proteins. (A) Sc and shLB1 cells were harvested at PD3 after selection, and total cell lysates were analyzed. GAPDH served as a loading control. (B) Analysis of EGFP expression facilitated by activation of HR or NHEJ as described in Materials and Methods. U-2-OS (n = 6): HR, P = 0.0025; NHEJ, P = 0.0097. HCT116 (n = 3): HR, P = 0.0045; NHEJ, P = 0.01. (C) Detection of apoptosis in Sc and shLB1 cells after treatment with 0.25 μM ST, 5 μg/ml BLM, or 20 μM CMPT. Sc and shLB1 cells were harvested at 24 h after treatment, stained for annexin V/PI, and examined by FACS. U-2-OS shLB1-1 (n = 5): BLM, P = 0.036; CMPT, P = 0.0023. shLB1-2 (n = 3): BLM, P = 0.013; CMPT, P = 0.0076. HCT116 (n = 3): BLM, P = 0.018; CMPT, P = 0.0045. Error bars represent standard deviations. Asterisks indicate statistically significant differences. (D) Clonogenicity assay of Sc and shLB1 cells treated with 2.5 μg/ml BLM or 10 μM CMPT for 48 h. Colonies were counted on day 10. U-2-OS shLB1-1 (n = 6): BLM, P = 0.004; CMPT, P = 0.0013. shLB1-2 (n = 3): BLM, P = 0.008; CMPT, P = 0.005. HCT116 (n = 3): BLM, P = 0.0024; CMPT, P = 0.0089. (E) Formation of DNA repair foci in Sc and shLB1 cells. Cells were treated with 20 μM CMPT for 4 h, fixed, and stained with antibodies to LB1 (green) and MRE11 (red) or pRPA32 (red). Images of single representative nuclei are shown. ct in panel C and Ct in panel D, control.
DSBs in mammalian cells are repaired by HR or NHEJ, depending in part on the position in the cell cycle. To test for possible defects in the HR and NHEJ pathways, we employed a plasmid-based assay that simultaneously measures the efficiency of both HR and NHEJ by reconstitution of a split EGFP gene (25). In shLB1 cells, the activities of both pathways were significantly diminished (Fig. 6B), consistent with the decreased expression of damage repair factors involved in HR, such as pRPA32 (Fig. 3D), RAD51, and NBS1, and those involved in NHEJ, such as DNA-PKcs and NBS1 (Fig. 6A).
The decreased ability of shLB1 cells to repair DNA damage was further assessed by treating Sc and shLB1 cells with CMPT to induce stalling and collapse of replication forks or with BLM to create DSBs (45–48). The failure to repair DSBs in tumor cells results in activation of the intrinsic apoptotic pathway, so we measured the number of apoptotic cells 24 h after drug addition. Sc and shLB1 cells showed similar rates of apoptosis after treatment with staurosporine (ST), which induces apoptosis without DNA damage, indicating that the reduced LB1 levels did not affect the apoptosis execution mechanism (Fig. 6C). shLB1 cells had a significantly higher percentage of apoptotic cells (≥75%) than Sc cells did (∼50%) when treated with BLM, which induces DSBs independently of replication. This confirms the previous assays suggesting that shLB1 cells are deficient in DSB repair. CMPT treatment had a similar effect, with ∼80% apoptotic shLB1 cells compared to ∼20 to 30% apoptosis in Sc cells (Fig. 6C). In addition, shLB1 cells exhibited significantly less clonogenic potential than Sc cells following treatment with either CMPT or BLM (Fig. 6D). The increased sensitivity of shLB1 cells to CMPT suggests that replication forks are less stable and prone to collapse in cells with decreased LB1 levels.
The deficiencies in DSB repair in shLB1 cells were further supported by the localization of the repair factors pRPA32 and the MRN complex (a DNA repair complex formed from MRE11, Rad50, and NBS1) (49) detected by anti-MRE11 antibody (Fig. 6E). In Sc cells, CMPT induced the formation of numerous large MRE-11 and pRPA32 foci within 4 h (Fig. 6E). Although the expression of MRE11 was slightly increased in shLB1 cells (Fig. 6A), the formation of discrete and large MRE-11 foci did not occur following CMPT treatment. A small number of pRPA32 foci were found in Sc cells without CMPT treatment, but they were essentially undetectable in shLB1 cells, consistent with the decreased levels of the modified protein observed by immunoblotting (Fig. 3D). After treatment with CMPT, shLB1 cells formed only a few small foci containing pRPA32, similar in number and size to those seen in untreated Sc cells. The insufficient levels of repair factors in shLB1 cells could explain the observed replication fork stalling and delayed response to the resulting DNA damage.
Defects in the repair of DSBs and the accumulation of damaged DNA lead to chromosome instability (41, 50, 51), resulting in impaired chromosomal segregation during mitosis (52). We detected a significant increase in aneuploidy, the appearance of lagging chromosomes, and the formation of micronuclei in shLB1 compared to those in Sc cells when the cells were continuously passaged for 9 PDs (Fig. 7A and B), supporting the idea that DSB repair is defective in shLB1 cells. Together, these results support the idea that shLB1 cells are deficient in the repair of DSBs because of both replication fork collapse and other sources of DNA damage.
FIG 7.

Reduced LB1 levels cause increased chromosome instability. (A) Aneuploidy in Sc and shLB1 cells was analyzed by FACS of PI-stained cells. U-2-OS (n = 5), P < 0.021; HCT116 (n = 3), P = 0.017. The formation of micronuclei was determined by direct counting of cells stained with antilamin or anti-γH2AX antibodies and Hoechst staining of DNA. U-2-OS (n = 4; number of nuclei examined, >600), P < 0.0101; HCT116 (n = 3; number of nuclei examined, >500), P < 0.022. The appearance of lagging chromosomes was analyzed with the same antibody and DNA stain combination. U-2-OS (n = 5); number of nuclei examined, >800), P < 0.003; HCT116 (n = 3; number of nuclei examined, >600), P < 0.0042. Error bars represent standard deviations. Asterisks mark statistically significant differences. (B) Representative images of nuclei showing micronuclei and lagging chromosomes.
LB1 associates with specific genes.
In human fibroblasts, approximately one-third of the genome is thought to be organized into large sharply demarcated regions called lamina-associated domains (LADs), which are generally gene poor and transcriptionally repressed (53). Since LADs are associated with LB1, we considered the possibility that reduced levels of LB1 could alter LAD organization and therefore gene activity. Using previously published data on gene distribution among the LADs in normal human fibroblasts (54), we attempted to determine if genes that exhibited modified expression in shLB1 cells, including BRCA, PRKDC, and MRE11, might be located in LADs while genes with decreased gene expression, such as RAD51 and NBN, might be excluded from LADs (see Table S2 in the supplemental material). However, we were unable to find any correlation between changes in gene activity after LB1 silencing in U-2-OS cells and the association of those genes with LADs as defined in normal fibroblasts. Instead, we used specific antibodies to LB1 for ChIP-qPCR analyses of promoter regions of DNA repair-associated genes in chromatin isolated from shLB1 and Sc cells (Fig. 8). Previously identified LAD-positive and -negative regions of the human genome served as positive and negative controls (53). We detected strong interactions between LB1 and the promoters of BRCA1, RAD51, NBN, MRE11, PRKDC, and SUMO1 but significantly weaker interactions between LB1 and the BRCA2 and RAD50 gene promoters. We used detection of DDB1 as an additional positive control, since it is enriched in LADs (see Table S2) and its expression is significantly downregulated by either transient or stable silencing of LB1 (20) (see Table S1). Surprisingly, we found that the loss of interaction between LB1 and gene promoters in shLB1 cells was gene specific and not general across the entire group of genes. Specifically, only the promoters of the BRCA1, RAD51, and DDB1 genes showed a loss of LB1 interaction following LB1 silencing. There did not appear to be a direct correlation between mRNA levels and the association of LB1 with specific gene promoters after silencing, since the BRCA1 mRNA levels were increased and the RAD51 and DDB1 mRNA levels were decreased (Table 1). No genes showed a gain of LB1 interaction, and most showed no change. Taken together, these data suggest that gene expression regulation by LB1 is complex and may function through several mechanisms.
FIG 8.

Analyses of LB1 interactions with specific gene promoters by lamin ChIP-qPCR. LB1-associated chromatin from a soluble nuclear chromatin fraction isolated from Sc and shLB1 cells was immunoprecipitated with specific antibodies to LB1. Input and precipitated DNA samples were analyzed by qPCR. The experiment was repeated five times with five technical repeats of qPCR analysis. BRCA1, P = 0.006; RAD51, P = 0.0011; DDB1, P = 0.0003. Error bars represent standard deviations. Asterisks indicate statistically significant differences.
TABLE 1.
Relative expression of genes associated with DDRa
| Gene | Product | Fold change | P value |
|---|---|---|---|
| BRCA1 | Breast cancer 1 | 2.6 | 0.006b |
| RAD51 | RAD51 recombinase | 0.09 | 0.001b |
| RPA2 | Replication protein A | 1.1 | 0.08 |
| H2AX | H2A histone family member X | 2.0 | 0.023b |
| PCNA | Proliferating cell nuclear antigen | 0.77 | 0.056 |
| ATR | Ataxia telangiectasia and Rad3 related | 2.1 | 0.002b |
| DDB1 | Damage-specific DNA binding protein 1 | 0.2 | 0.0021b |
| MRE11A | MRE11 meiotic recombination 11 homolog | 3.4 | 0.042b |
| RAD50 | DNA repair protein RAD50 | 2.2 | 0.009b |
| NBN | NBS1 | 0.4 | 0.0101b |
| PRKDC | DNA-PKcs | 5.0 | 0.007b |
| TP53BP1 | Tumor protein P53 binding protein 1 | 3.075 | 0.003b |
| SUMO1 | Small ubiquitin-like modifier 1 | 0.6 | 0.048b |
| SUMO2 | Small ubiquitin-like modifier 2 | 0.5 | 0.032b |
| SUMO3 | Small ubiquitin-like modifier 3 | 0.3 | 0.012b |
Expression analyses of genes associated with detection and repair of DNA damage in LB1-silenced and control cells. mRNA from Sc and shLB1 U-2-OS cells at PD3 was analyzed by qRT-PCR with the gene for GAPDH as a reference. A change in the expression of a specific gene was considered significant if it was >1.7-fold or <0.6-fold.
Statistically significantly different.
DISCUSSION
In this study, we show that the shRNA-mediated stable reduction of nuclear lamin B1 to approximately one-half of its normal level in human tumor cell lines leads to decreased cell proliferation and deficiencies in DNA synthesis, resulting in the accumulation of cells in early S phase. The S phase delay appears to be due to replication fork stalling and collapse that cannot be repaired because of defective DNA damage detection and repair mechanisms. Cells with decreased LB1 levels have increased sensitivity to DSB-inducing agents such as BLM and CMPT, most likely because of the decreased expression of some key protein required for mediation of the activation of the DNA damage response and the formation of DSB repair complexes. The inability of the cells to mount a timely DNA damage response and repair leads to chromosome instability, resulting in increased aneuploidy and the formation of micronuclei.
Previously, we demonstrated that altering the lamin organization of nuclei assembled in Xenopus egg extracts did not affect the initiation phase of DNA replication but rather interfered with elongation (23, 33, 55). The results presented here confirm a role for B-type lamins in the elongation phase of DNA replication in cells since human tumor cell lines with decreased levels of LB1 accumulate in early S phase with evidence that the elongation of initiated replication forks is impaired. Recently, the depletion of LB1 was shown to cause a prolonged S phase (56) with an increase in cells in mid/late S phase (57). Our previous study on the transient silencing of LB1 expression in tumor cells found early G1 phase arrest when LB1 was reduced by >80% (20). Clearly, these studies suggest an important role for LB1 in the regulation of the cell cycle. The regulation of the elongation phase of DNA synthesis by LB1 does not appear to involve the direct interaction of LB1 with the site of replication since the association of LB1 with newly synthesized chromatin is not significant. Therefore, we propose that LB1 regulates replication indirectly, possibly by affecting the recruitment of replication factors such as PCNA and RPA to the sites of replication initiation. This could be accomplished by LB1 interaction with replication factors away from replication sites or by regulation of the association of replication factors with other proteins. Other studies have also implicated LA/C in the regulation of DNA synthesis. Recently, LA and LC were shown to play a significant role in the restart of replication forks following replicative stress and the recruitment of DNA repair complexes, but a direct interaction between LA/C and newly replicating chromatin was not demonstrated (5). We found that LA/C interacted directly with newly replicated DNA at multiple origins of replication, in contrast to LB1, which interacted only weakly with a minority of origins. These interactions between LA/C and replicating chromatin were not affected by the level of LB1. However, we cannot exclude the possibility that the decreased expression of LB1 affects the interaction between LA/C and replication factors such as PCNA (58), thereby limiting the loading of the factors onto the replication forks.
The stalling of replication forks leads to fork collapse and the generation of DSBs. Under normal conditions, stalled replication forks and the resulting DSBs are rescued by HR during S phase, preventing DNA damage accumulation and chromosome instability (59). In the absence of HR, NHEJ is the main mechanism of DSB repair, operating throughout the cell cycle. Both pathways are significantly impaired in cells with decreased LB1 levels, leading to an accumulation of unrepaired DNA damage and persistent DNA damage signaling. Several repair factors are deregulated in cells with lower LB1 levels, suggesting that LB1 regulates the activity of some key components common to HR and NHEJ. The decrease in HR efficiency can be explained by the inefficient recruitment and phosphorylation of RPA32 on active replication forks (60) and the diminished expression of RAD51, a core protein of HR that is required for homology recognition and mediation of DNA strand invasion during repair (61). We also found a significant depletion of DNA-PKcs, a key regulator of NHEJ responsible for the phosphorylation and activation of multiple repair proteins (62). During replicative stress, several kinases, including ATR and DNA-PKcs, phosphorylate and activate RPA32 for its recruitment to single-stranded DNA (63). Although the expression of RPA32 was not altered in shLB1 cells, activation of the protein by phosphorylation was dramatically decreased, possibly because of the depletion of DNA-PKcs. This inability to activate RPA could inhibit replication fork progression, leading to fork collapse and the accumulation of DSBs.
The initial processing of DSBs in both the HR and NHEJ pathways is mediated primarily by the MRN complex formed from the MRE11, RAD50, and NBS1 proteins (62). The reduction of LB1 levels results in the induction of both RAD50 and MRE11, probably because of the increase in DSBs. However, there is also a large decrease in NBS1, suggesting that the MRN complex cannot assemble properly in cells with decreased LB1 levels. NBS1 is a core protein of the MRN complex facilitating the activation of ATM and ATR, which, in turn, activate RPA32 and other factors required for the repair of stalled replication forks and DSBs. NBS1 is also involved in regulation of the enzymatic activity of MRE11 in DNA end processing (49, 64). Depletion of NBS1 in shLB1 cells might be the main cause of the inability to assemble the MRN complex at DSBs created at collapsed replication forks or by the treatment of these LB1-depleted cells with DSB-inducing drugs. Mutations in the nibrin gene (NBN), which encodes NBS1, cause Nijmegen breakage syndrome (NBS) in humans, which is characterized by chromosomal instability, increased radiation sensitivity, immunodeficiency, and a strong predisposition to lymphoid malignancy (65). The reduced capacity of LB1-silenced cells to form MRN complexes because of the reduction of NBS1 expression is likely to affect both HR and NHEJ, leading to the accumulation of DNA damage and chromosome instability (26). Taken together, these results suggest that the level of LB1 is important for maintenance of the level of key factors involved in DNA replication and DSB repair.
LB1 could act at multiple levels to regulate the expression of factors required for replication and the repair of stalled replication forks and DSBs. Since LB1 has been implicated as a regulator of chromatin structure and gene regulation (1), we determined the mRNA levels of genes involved in the DNA damage response and repair as a measure of their transcription. Of the 158 genes examined, the expression levels of 85 were significantly changed. ChIP analyses demonstrated that LB1 interacts directly with a number of genes associated with DNA damage signaling and repair, including RAD51, NBN, BRCA1 MRE11, PRKDC, and SUMO1. However, reducing the level of LB1 affects LB1-gene interactions and the expression of specific DNA repair genes differently. For example, LB1 interacts with the promoters of RAD51, NBN, BRCA1, and PRKDC. However, the decreased expression of LB1 leads to significantly weaker binding to the RAD51 promoter but not the other three promoters. It should also be noted that the activation of p53 observed with LB1 reduction could lead to decreased RAD51 expression (66). We also showed strong interaction between LB1 and the promoter of DDB1, which encodes a protein required for global genome NER, which is almost completely depleted after LB1 silencing by ∼80% (20). For some genes, such as RAD51 and NBN, both the mRNA and protein levels were significantly decreased. In contrast, both the BRCA1 mRNA and protein levels were strongly induced when LB1 levels were reduced, whereas there was a significant increase in DNA-PKcs mRNA levels but an almost complete loss of protein expression. Thus, our findings suggest that LB1 regulates the expression of genes at multiple levels, as a transcription regulator via direct interaction with gene promoters, as well as a possible regulator of mRNA processing, transport, and stability. Recently, the silencing of LB1 in tumor cells was shown to result in extensive changes in alternative splicing of multiple genes, thereby affecting their expression (56). LB1 may also directly or indirectly regulate the translation or stability of specific proteins, since the DNA-PKcs protein levels were reduced even as the level of PRKDC mRNA was increased after LB1 reduction. A recent study proposed that LA/C interactions with specific gene promoters could affect gene expression and local chromatin modifications (67). Therefore, it is possible that LB1 also acts through a similar mechanism and it is attractive to speculate that the different lamin isoforms may each influence distinct patterns of gene expression by interactions with subsets of promoters. Although LB1 interacts with specific gene promoters, we cannot exclude the possibility that the gene expression changes seen in cells with reduced LB1 levels are due to indirect effects of the increased DNA damage due to collapsed replication forks and persistent chromatin modifications affecting DNA replication and repair and the transcription of various genes.
In human fibroblasts, approximately one-third of the genome is organized into large sharply demarcated regions called LADs that are mainly transcriptionally inactive (53). In addition, normal senescence is associated with the decreased expression of LB1 (18, 19) and it has been recently proposed that this decreased LB1 expression is involved in senescence-associated global and local chromatin changes that impact gene expression (54, 68). In support of this, several studies have shown that the perinuclear positioning of genes and the silencing of chromatin at the nuclear periphery involve complexes of lamins or lamina-associated proteins with transcription repressor proteins and histone deacetylases (69, 70). In addition, the silencing of LB1 expression in tumor cells has been linked to a decrease in RNA Pol II activity (57, 71). In light of these findings, we attempted to correlate published LAD data (54) with the expression changes due to reduced LB1 levels. However, we were unable to find any statistically significant correlations that could explain the observed increases or decreases in gene expression.
Other evidence of defects in DDR due to lamin dysfunction comes from studies of Hutchinson-Gilford progeria syndrome (HGPS) patient cells, which express a truncated and permanently farnesylated form of LA termed progerin (72), and of cells from mice lacking the Zmpste24 protease required for the carboxyl-terminal processing of LA (73, 74). Accumulation of progerin leads to a constitutively activated DNA damage response, as indicated by the constant formation of 53BP1 foci and increased phosphorylation of both CHK1 and H2AX (6, 8, 75). The expression of progerin in HGPS or the accumulation of farnesylated pre-LA in Zmpste24−/− mouse embryo fibroblasts has also been reported to lead to compromised HR and deficient recruitment of repair factors to DNA damage sites following ionizing radiation (5, 6, 8, 75–77). Taken together, these findings and our present studies suggest that the A- and B-type lamins have important roles in the regulation of DNA repair processes. At this stage, we cannot conclude if these are separate mechanisms mediated by each type of lamin or if the perturbation of one lamin network is communicated to the other network through their structural interactions either in the lamina or in the nucleoplasm (71). Our findings suggest that LB1 plays a key role in the regulation of many nuclear processes, including DNA replication, DDR, and possibly V(D)J recombination, not as a direct scaffolding factor but as a direct regulator of a subset of genes involved in these processes. However, additional experiments are required to determine if LB1 acts directly by regulating specific gene transcription or indirectly by defining and regulating larger chromatin domains.
Supplementary Material
ACKNOWLEDGMENTS
R.D.G. was supported by NCI grant R01CA031760 and the Progeria Research Foundation. V.B.-I. was supported by a fellowship from the Gruss-Lipper Foundation. S.L.B. was supported by NIA P01 grant P01AG031862. G.L.O. was supported by a Computational Biology T32 NRSA Research Training Grant and PGFI Excellence in Genome Science.
Footnotes
Supplemental material for this article may be found at http://dx.doi.org/10.1128/MCB.01145-14.
REFERENCES
- 1.Dechat T, Adam SA, Taimen P, Shimi T, Goldman RD. 2010. Nuclear lamins. Cold Spring Harb Perspect Biol 2:a000547. doi: 10.1101/cshperspect.a000547. [DOI] [PMC free article] [PubMed] [Google Scholar]
- 2.Stewart C, Burke B. 1987. Teratocarcinoma stem cells and early mouse embryos contain only a single major lamin polypeptide closely resembling lamin B Cell 51:383–392. [DOI] [PubMed] [Google Scholar]
- 3.Dittmer TA, Misteli T. 2011. The lamin protein family. Genome Biol 12:222. doi: 10.1186/gb-2011-12-5-222. [DOI] [PMC free article] [PubMed] [Google Scholar]
- 4.Shimi T, Butin-Israeli V, Goldman RD. 2012. The functions of the nuclear envelope in mediating the molecular crosstalk between the nucleus and the cytoplasm. Curr Opin Cell Biol 24:71–78. doi: 10.1016/j.ceb.2011.11.007. [DOI] [PMC free article] [PubMed] [Google Scholar]
- 5.Singh M, Hunt CR, Pandita RK, Kumar R, Yang CR, Horikoshi N, Bachoo R, Serag S, Story MD, Shay JW, Powell SN, Gupta A, Jeffery J, Pandita S, Chen BP, Deckbar D, Lobrich M, Yang Q, Khanna KK, Worman HJ, Pandita TK. 2013. Lamin A/C depletion enhances DNA damage-induced stalled replication fork arrest. Mol Cell Biol 33:1210–1222. doi: 10.1128/MCB.01676-12. [DOI] [PMC free article] [PubMed] [Google Scholar]
- 6.Liu Y, Rusinol A, Sinensky M, Wang Y, Zou Y. 2006. DNA damage responses in progeroid syndromes arise from defective maturation of prelamin A. J Cell Sci 119:4644–4649. doi: 10.1242/jcs.03263. [DOI] [PMC free article] [PubMed] [Google Scholar]
- 7.Varela I, Cadinanos J, Pendas AM, Gutierrez-Fernandez A, Folgueras AR, Sanchez LM, Zhou Z, Rodriguez FJ, Stewart CL, Vega JA, Tryggvason K, Freije JM, Lopez-Otin C. 2005. Accelerated ageing in mice deficient in Zmpste24 protease is linked to p53 signalling activation. Nature 437:564–568. doi: 10.1038/nature04019. [DOI] [PubMed] [Google Scholar]
- 8.Liu Y, Wang Y, Rusinol AE, Sinensky MS, Liu J, Shell SM, Zou Y. 2008. Involvement of xeroderma pigmentosum group A (XPA) in progeria arising from defective maturation of prelamin A. FASEB J 22:603–611. doi: 10.1096/fj.07-8598com. [DOI] [PMC free article] [PubMed] [Google Scholar]
- 9.Padiath QS, Saigoh K, Schiffmann R, Asahara H, Yamada T, Koeppen A, Hogan K, Ptacek LJ, Fu YH. 2006. Lamin B1 duplications cause autosomal dominant leukodystrophy. Nat Genet 38:1114–1123. doi: 10.1038/ng1872. [DOI] [PubMed] [Google Scholar]
- 10.Brussino A, Vaula G, Cagnoli C, Panza E, Seri M, Di Gregorio E, Scappaticci S, Camanini S, Daniele D, Bradac GB, Pinessi L, Cavalieri S, Grosso E, Migone N, Brusco A. 2010. A family with autosomal dominant leukodystrophy linked to 5q23.2-q23.3 without lamin B1 mutations. Eur J Neurol 17:541–549. doi: 10.1111/j.1468-1331.2009.02844.x. [DOI] [PubMed] [Google Scholar]
- 11.Coffinier C, Chang SY, Nobumori C, Tu Y, Farber EA, Toth JI, Fong LG, Young SG. 2010. Abnormal development of the cerebral cortex and cerebellum in the setting of lamin B2 deficiency. Proc Natl Acad Sci U S A 107:5076–5081. doi: 10.1073/pnas.0908790107. [DOI] [PMC free article] [PubMed] [Google Scholar]
- 12.Coffinier C, Jung HJ, Nobumori C, Chang S, Tu Y, Barnes RH II, Yoshinaga Y, de Jong PJ, Vergnes L, Reue K, Fong LG, Young SG. 2011. Deficiencies in lamin B1 and lamin B2 cause neurodevelopmental defects and distinct nuclear shape abnormalities in neurons. Mol Biol Cell 22:4683–4693. doi: 10.1091/mbc.E11-06-0504. [DOI] [PMC free article] [PubMed] [Google Scholar]
- 13.Kim Y, Sharov AA, McDole K, Cheng M, Hao H, Fan CM, Gaiano N, Ko MS, Zheng Y. 2011. Mouse B-type lamins are required for proper organogenesis but not by embryonic stem cells. Science 334:1706–1710. doi: 10.1126/science.1211222. [DOI] [PMC free article] [PubMed] [Google Scholar]
- 14.Yang SH, Chang SY, Yin L, Tu Y, Hu Y, Yoshinaga Y, de Jong PJ, Fong LG, Young SG. 2011. An absence of both lamin B1 and lamin B2 in keratinocytes has no effect on cell proliferation or the development of skin and hair. Hum Mol Genet 20:3537–3544. doi: 10.1093/hmg/ddr266. [DOI] [PMC free article] [PubMed] [Google Scholar]
- 15.Moss SF, Krivosheyev V, de Souza A, Chin K, Gaetz HP, Chaudhary N, Worman HJ, Holt PR. 1999. Decreased and aberrant nuclear lamin expression in gastrointestinal tract neoplasms. Gut 45:723–729. doi: 10.1136/gut.45.5.723. [DOI] [PMC free article] [PubMed] [Google Scholar]
- 16.Broers JL, Raymond Y, Rot MK, Kuijpers H, Wagenaar SS, Ramaekers FC. 1993. Nuclear A-type lamins are differentially expressed in human lung cancer subtypes. Am J Pathol 143:211–220. [PMC free article] [PubMed] [Google Scholar]
- 17.Dreesen O, Chojnowski A, Ong PF, Zhao TY, Common JE, Lunny D, Lane EB, Lee SJ, Vardy LA, Stewart CL, Colman A. 2013. Lamin B1 fluctuations have differential effects on cellular proliferation and senescence. J Cell Biol 200:605–617. doi: 10.1083/jcb.201206121. [DOI] [PMC free article] [PubMed] [Google Scholar]
- 18.Shimi T, Butin-Israeli V, Adam SA, Hamanaka RB, Goldman AE, Lucas CA, Shumaker DK, Kosak ST, Chandel NS, Goldman RD. 2011. The role of nuclear lamin B1 in cell proliferation and senescence. Genes Dev 25:2579–2593. doi: 10.1101/gad.179515.111. [DOI] [PMC free article] [PubMed] [Google Scholar]
- 19.Freund A, Laberge RM, Demaria M, Campisi J. 2012. Lamin B1 loss is a senescence-associated biomarker. Mol Biol Cell 23:2066–2075. doi: 10.1091/mbc.E11-10-0884. [DOI] [PMC free article] [PubMed] [Google Scholar]
- 20.Butin-Israeli V, Adam SA, Goldman RD. 2013. Regulation of nucleotide excision repair by nuclear lamin b1. PLoS One 8:e69169. doi: 10.1371/journal.pone.0069169. [DOI] [PMC free article] [PubMed] [Google Scholar]
- 21.Barascu A, Le Chalony C, Pennarun G, Genet D, Imam N, Lopez B, Bertrand P. 2012. Oxidative stress induces an ATM-independent senescence pathway through p38 MAPK-mediated lamin B1 accumulation. EMBO J 31:1080–1094. doi: 10.1038/emboj.2011.492. [DOI] [PMC free article] [PubMed] [Google Scholar]
- 22.Laemmli UK. 1970. Cleavage of structural proteins during the assembly of the head of bacteriophage T4. Nature 227:680–685. doi: 10.1038/227680a0. [DOI] [PubMed] [Google Scholar]
- 23.Moir RD, Montag-Lowy M, Goldman RD. 1994. Dynamic properties of nuclear lamins: lamin B is associated with sites of DNA replication. J Cell Biol 125:1201–1212. doi: 10.1083/jcb.125.6.1201. [DOI] [PMC free article] [PubMed] [Google Scholar]
- 24.Yokochi T, Gilbert DM. 2007. Replication labeling with halogenated thymidine analogs. Curr Protoc Cell Biol Chapter 22:Unit 22.10. doi: 10.1002/0471143030.cb2210s35. [DOI] [PubMed] [Google Scholar]
- 25.Akyüz N, Boehden GS, Susse S, Rimek A, Preuss U, Scheidtmann KH, Wiesmüller L. 2002. DNA substrate dependence of p53-mediated regulation of double-strand break repair. Mol Cell Biol 22:6306–6317. doi: 10.1128/MCB.22.17.6306-6317.2002. [DOI] [PMC free article] [PubMed] [Google Scholar]
- 26.Keimling M, Volcic M, Csernok A, Wieland B, Dork T, Wiesmüller L. 2011. Functional characterization connects individual patient mutations in ataxia telangiectasia mutated (ATM) with dysfunction of specific DNA double-strand break-repair signaling pathways. FASEB J 25:3849–3860. doi: 10.1096/fj.11-185546. [DOI] [PubMed] [Google Scholar]
- 27.Keimling M, Deniz M, Varga D, Stahl A, Schrezenmeier H, Kreienberg R, Hoffmann I, Konig J, Wiesmüller L. 2012. The power of DNA double-strand break (DSB) repair testing to predict breast cancer susceptibility. FASEB J 26:2094–2104. doi: 10.1096/fj.11-200790. [DOI] [PubMed] [Google Scholar]
- 28.Franken NA, Rodermond HM, Stap J, Haveman J, van Bree C. 2006. Clonogenic assay of cells in vitro. Nat Protoc 1:2315–2319. doi: 10.1038/nprot.2006.339. [DOI] [PubMed] [Google Scholar]
- 29.Munshi A, Hobbs M, Meyn RE. 2005. Clonogenic cell survival assay. Methods Mol Med 110:21–28. doi: 10.1385/1-59259-869-2:021. [DOI] [PubMed] [Google Scholar]
- 30.Ashburner M, Ball CA, Blake JA, Botstein D, Butler H, Cherry JM, Davis AP, Dolinski K, Dwight SS, Eppig JT, Harris MA, Hill DP, Issel-Tarver L, Kasarskis A, Lewis S, Matese JC, Richardson JE, Ringwald M, Rubin GM, Sherlock G. 2000. Gene ontology: tool for the unification of biology. The Gene Ontology Consortium. Nat Genet 25:25–29. doi: 10.1038/75556. [DOI] [PMC free article] [PubMed] [Google Scholar]
- 31.Huang DW, Sherman BT, Lempicki RA. 2009. Systematic and integrative analysis of large gene lists using DAVID bioinformatics resources. Nat Protoc 4:44–57. doi: 10.1038/nprot.2008.211. [DOI] [PubMed] [Google Scholar]
- 32.Ryba T, Battaglia D, Pope BD, Hiratani I, Gilbert DM. 2011. Genome-scale analysis of replication timing: from bench to bioinformatics. Nat Protoc 6:870–895. doi: 10.1038/nprot.2011.328. [DOI] [PMC free article] [PubMed] [Google Scholar]
- 33.Spann TP, Moir RD, Goldman AE, Stick R, Goldman RD. 1997. Disruption of nuclear lamin organization alters the distribution of replication factors and inhibits DNA synthesis. J Cell Biol 136:1201–1212. doi: 10.1083/jcb.136.6.1201. [DOI] [PMC free article] [PubMed] [Google Scholar]
- 34.Kanoh Y, Tamai K, Shirahige K. 2006. Different requirements for the association of ATR-ATRIP and 9-1-1 to the stalled replication forks. Gene 377:88–95. doi: 10.1016/j.gene.2006.03.019. [DOI] [PubMed] [Google Scholar]
- 35.Van C, Yan S, Michael WM, Waga S, Cimprich KA. 2010. Continued primer synthesis at stalled replication forks contributes to checkpoint activation. J Cell Biol 189:233–246. doi: 10.1083/jcb.200909105. [DOI] [PMC free article] [PubMed] [Google Scholar]
- 36.MacDougall CA, Byun TS, Van C, Yee MC, Cimprich KA. 2007. The structural determinants of checkpoint activation. Genes Dev 21:898–903. doi: 10.1101/gad.1522607. [DOI] [PMC free article] [PubMed] [Google Scholar]
- 37.Alcasabas AA, Osborn AJ, Bachant J, Hu F, Werler PJ, Bousset K, Furuya K, Diffley JF, Carr AM, Elledge SJ. 2001. Mrc1 transduces signals of DNA replication stress to activate Rad53. Nat Cell Biol 3:958–965. doi: 10.1038/ncb1101-958. [DOI] [PubMed] [Google Scholar]
- 38.Branzei D, Foiani M. 2005. The DNA damage response during DNA replication. Curr Opin Cell Biol 17:568–575. doi: 10.1016/j.ceb.2005.09.003. [DOI] [PubMed] [Google Scholar]
- 39.Branzei D, Foiani M. 2010. Maintaining genome stability at the replication fork. Nat Rev Mol Cell Biol 11:208–219. doi: 10.1038/nrm2852. [DOI] [PubMed] [Google Scholar]
- 40.Nam EA, Cortez D. 2011. ATR signalling: more than meeting at the fork. Biochem J 436:527–536. doi: 10.1042/BJ20102162. [DOI] [PMC free article] [PubMed] [Google Scholar]
- 41.Jones RM, Petermann E. 2012. Replication fork dynamics and the DNA damage response. Biochem J 443:13–26. doi: 10.1042/BJ20112100. [DOI] [PubMed] [Google Scholar]
- 42.FitzGerald JE, Grenon M, Lowndes NF. 2009. 53BP1: function and mechanisms of focal recruitment. Biochem Soc Trans 37:897–904. doi: 10.1042/BST0370897. [DOI] [PubMed] [Google Scholar]
- 43.Cleaver JE. 2011. γH2Ax: biomarker of damage or functional participant in DNA repair “all that glitters is not gold! ” Photochem Photobiol 87:1230–1239. doi: 10.1111/j.1751-1097.2011.00995.x. [DOI] [PubMed] [Google Scholar]
- 44.Lukas J, Lukas C, Bartek J. 2011. More than just a focus: the chromatin response to DNA damage and its role in genome integrity maintenance. Nat Cell Biol 13:1161–1169. doi: 10.1038/ncb2344. [DOI] [PubMed] [Google Scholar]
- 45.Pommier Y. 2006. Topoisomerase I inhibitors: camptothecins and beyond. Nat Rev Cancer 6:789–802. doi: 10.1038/nrc1977. [DOI] [PubMed] [Google Scholar]
- 46.Pommier Y. 2009. DNA topoisomerase I inhibitors: chemistry, biology, and interfacial inhibition. Chem Rev 109:2894–2902. doi: 10.1021/cr900097c. [DOI] [PMC free article] [PubMed] [Google Scholar]
- 47.Lazo JS. 1999. Bleomycin. Cancer Chemother Biol Response Modif 18:39–45. [PubMed] [Google Scholar]
- 48.Povirk LF. 1996. DNA damage and mutagenesis by radiomimetic DNA-cleaving agents: bleomycin, neocarzinostatin and other enediynes. Mutat Res 355:71–89. doi: 10.1016/0027-5107(96)00023-1. [DOI] [PubMed] [Google Scholar]
- 49.Williams GJ, Lees-Miller SP, Tainer JA. 2010. Mre11-Rad50-Nbs1 conformations and the control of sensing, signaling, and effector responses at DNA double-strand breaks. DNA Repair (Amst) 9:1299–1306. doi: 10.1016/j.dnarep.2010.10.001. [DOI] [PMC free article] [PubMed] [Google Scholar]
- 50.Burma S, Chen BP, Chen DJ. 2006. Role of non-homologous end joining (NHEJ) in maintaining genomic integrity. DNA Repair (Amst) 5:1042–1048. doi: 10.1016/j.dnarep.2006.05.026. [DOI] [PubMed] [Google Scholar]
- 51.Pardo B, Gomez-Gonzalez B, Aguilera A. 2009. DNA repair in mammalian cells: DNA double-strand break repair: how to fix a broken relationship. Cell Mol Life Sci 66:1039–1056. doi: 10.1007/s00018-009-8740-3. [DOI] [PMC free article] [PubMed] [Google Scholar]
- 52.Papamichos-Chronakis M, Peterson CL. 2013. Chromatin and the genome integrity network. Nat Rev Genet 14:62–75. doi: 10.1038/nri3604. [DOI] [PMC free article] [PubMed] [Google Scholar]
- 53.Guelen L, Pagie L, Brasset E, Meuleman W, Faza MB, Talhout W, Eussen BH, de Klein A, Wessels L, de Laat W, van Steensel B. 2008. Domain organization of human chromosomes revealed by mapping of nuclear lamina interactions. Nature 453:948–951. doi: 10.1038/nature06947. [DOI] [PubMed] [Google Scholar]
- 54.Shah PP, Donahue G, Otte GL, Capell BC, Nelson DM, Cao K, Aggarwala V, Cruickshanks HA, Rai TS, McBryan T, Gregory BD, Adams PD, Berger SL. 2013. Lamin B1 depletion in senescent cells triggers large-scale changes in gene expression and the chromatin landscape. Genes Dev 27:1787–1799. doi: 10.1101/gad.223834.113. [DOI] [PMC free article] [PubMed] [Google Scholar]
- 55.Moir RD, Spann TP, Herrmann H, Goldman RD. 2000. Disruption of nuclear lamin organization blocks the elongation phase of DNA replication. J Cell Biol 149:1179–1192. doi: 10.1083/jcb.149.6.1179. [DOI] [PMC free article] [PubMed] [Google Scholar]
- 56.Camps J, Wangsa D, Falke M, Brown M, Case CM, Erdos MR, Ried T. 2014. Loss of lamin B1 results in prolongation of S phase and decondensation of chromosome territories. FASEB J 28:3423–3434. doi: 10.1096/fj.14-250456. [DOI] [PMC free article] [PubMed] [Google Scholar]
- 57.Tang CW, Maya-Mendoza A, Martin C, Zeng K, Chen S, Feret D, Wilson SA, Jackson DA. 2008. The integrity of a lamin-B1-dependent nucleoskeleton is a fundamental determinant of RNA synthesis in human cells. J Cell Sci 121:1014–1024. doi: 10.1242/jcs.020982. [DOI] [PubMed] [Google Scholar]
- 58.Shumaker DK, Solimando L, Sengupta K, Shimi T, Adam SA, Grunwald A, Strelkov SV, Aebi U, Cardoso MC, Goldman RD. 2008. The highly conserved nuclear lamin Ig-fold binds to PCNA: its role in DNA replication. J Cell Biol 181:269–280. doi: 10.1083/jcb.200708155. [DOI] [PMC free article] [PubMed] [Google Scholar]
- 59.Moynahan ME, Jasin M. 2010. Mitotic homologous recombination maintains genomic stability and suppresses tumorigenesis. Nat Rev Mol Cell Biol 11:196–207. doi: 10.1038/nrm2851. [DOI] [PMC free article] [PubMed] [Google Scholar]
- 60.Liu JS, Kuo SR, Melendy T. 2006. DNA damage-induced RPA focalization is independent of gamma-H2AX and RPA hyper-phosphorylation. J Cell Biochem 99:1452–1462. doi: 10.1002/jcb.21066. [DOI] [PubMed] [Google Scholar]
- 61.Li X, Heyer WD. 2008. Homologous recombination in DNA repair and DNA damage tolerance. Cell Res 18:99–113. doi: 10.1038/cr.2008.1. [DOI] [PMC free article] [PubMed] [Google Scholar]
- 62.Shrivastav M, De Haro LP, Nickoloff JA. 2008. Regulation of DNA double-strand break repair pathway choice. Cell Res 18:134–147. doi: 10.1038/cr.2007.111. [DOI] [PubMed] [Google Scholar]
- 63.Allen C, Ashley AK, Hromas R, Nickoloff JA. 2011. More forks on the road to replication stress recovery. J Mol Cell Biol 3:4–12. doi: 10.1093/jmcb/mjq049. [DOI] [PMC free article] [PubMed] [Google Scholar]
- 64.Lamarche BJ, Orazio NI, Weitzman MD. 2010. The MRN complex in double-strand break repair and telomere maintenance. FEBS Lett 584:3682–3695. doi: 10.1016/j.febslet.2010.07.029. [DOI] [PMC free article] [PubMed] [Google Scholar]
- 65.Kondratenko I, Paschenko O, Polyakov A, Bologov A. 2007. Nijmegen breakage syndrome. Adv Exp Med Biol 601:61–67. doi: 10.1007/978-0-387-72005-0_6. [DOI] [PubMed] [Google Scholar]
- 66.Arias-Lopez C, Lazaro-Trueba I, Kerr P, Lord CJ, Dexter T, Iravani M, Ashworth A, Silva A. 2006. p53 modulates homologous recombination by transcriptional regulation of the RAD51 gene. EMBO Rep 7:219–224. doi: 10.1038/sj.embor.7400587. [DOI] [PMC free article] [PubMed] [Google Scholar]
- 67.Lund E, Oldenburg AR, Delbarre E, Freberg CT, Duband-Goulet I, Eskeland R, Buendia B, Collas P. 2013. Lamin A/C-promoter interactions specify chromatin state-dependent transcription outcomes. Genome Res 23:1580–1589. doi: 10.1101/gr.159400.113. [DOI] [PMC free article] [PubMed] [Google Scholar]
- 68.Sadaie M, Salama R, Carroll T, Tomimatsu K, Chandra T, Young AR, Narita M, Perez-Mancera PA, Bennett DC, Chong H, Kimura H, Narita M. 2013. Redistribution of the Lamin B1 genomic binding profile affects rearrangement of heterochromatic domains and SAHF formation during senescence. Genes Dev 27:1800–1808. doi: 10.1101/gad.217281.113. [DOI] [PMC free article] [PubMed] [Google Scholar]
- 69.Zullo JM, Demarco IA, Pique-Regi R, Gaffney DJ, Epstein CB, Spooner CJ, Luperchio TR, Bernstein BE, Pritchard JK, Reddy KL, Singh H. 2012. DNA sequence-dependent compartmentalization and silencing of chromatin at the nuclear lamina. Cell 149:1474–1487. doi: 10.1016/j.cell.2012.04.035. [DOI] [PubMed] [Google Scholar]
- 70.Muck JS, Kandasamy K, Englmann A, Gunther M, Zink D. 2012. Perinuclear positioning of the inactive human cystic fibrosis gene depends on CTCF, A-type lamins and an active histone deacetylase. J Cell Biochem 113:2607–2621. doi: 10.1002/jcb.24136. [DOI] [PubMed] [Google Scholar]
- 71.Shimi T, Pfleghaar K, Kojima S, Pack CG, Solovei I, Goldman AE, Adam SA, Shumaker DK, Kinjo M, Cremer T, Goldman RD. 2008. The A- and B-type nuclear lamin networks: microdomains involved in chromatin organization and transcription. Genes Dev 22:3409–3421. doi: 10.1101/gad.1735208. [DOI] [PMC free article] [PubMed] [Google Scholar]
- 72.Eriksson M, Brown WT, Gordon LB, Glynn MW, Singer J, Scott L, Erdos MR, Robbins CM, Moses TY, Berglund P, Dutra A, Pak E, Durkin S, Csoka AB, Boehnke M, Glover TW, Collins FS. 2003. Recurrent de novo point mutations in lamin A cause Hutchinson-Gilford progeria syndrome. Nature 423:293–298. doi: 10.1038/nature01629. [DOI] [PMC free article] [PubMed] [Google Scholar]
- 73.Muralikrishna B, Chaturvedi P, Sinha K, Parnaik VK. 2012. Lamin misexpression upregulates three distinct ubiquitin ligase systems that degrade ATR kinase in HeLa cells. Mol Cell Biochem 365:323–332. doi: 10.1007/s11010-012-1272-4. [DOI] [PubMed] [Google Scholar]
- 74.Musich PR, Zou Y. 2009. Genomic instability and DNA damage responses in progeria arising from defective maturation of prelamin A. Aging (Albany NY) 1:28–37. [DOI] [PMC free article] [PubMed] [Google Scholar]
- 75.Constantinescu D, Csoka AB, Navara CS, Schatten GP. 2010. Defective DSB repair correlates with abnormal nuclear morphology and is improved with FTI treatment in Hutchinson-Gilford progeria syndrome fibroblasts. Exp Cell Res 316:2747–2759. doi: 10.1016/j.yexcr.2010.05.015. [DOI] [PubMed] [Google Scholar]
- 76.Redwood AB, Perkins SM, Vanderwaal RP, Feng Z, Biehl KJ, Gonzalez-Suarez I, Morgado-Palacin L, Shi W, Sage J, Roti-Roti JL, Stewart CL, Zhang J, Gonzalo S. 2011. A dual role for A-type lamins in DNA double-strand break repair. Cell Cycle 10:2549–2560. doi: 10.4161/cc.10.15.16531. [DOI] [PMC free article] [PubMed] [Google Scholar]
- 77.Liu B, Wang J, Chan KM, Tjia WM, Deng W, Guan X, Huang JD, Li KM, Chau PY, Chen DJ, Pei D, Pendas AM, Cadinanos J, Lopez-Otin C, Tse HF, Hutchison C, Chen J, Cao Y, Cheah KS, Tryggvason K, Zhou Z. 2005. Genomic instability in laminopathy-based premature aging. Nat Med 11:780–785. doi: 10.1038/nm1266. [DOI] [PubMed] [Google Scholar]
- 78.Ondov BD, Bergman NH, Phillippy AM. 2011. Interactive metagenomic visualization in a Web browser. BMC Bioinformatics 12:385. doi: 10.1186/1471-2105-12-385. [DOI] [PMC free article] [PubMed] [Google Scholar]
- 79.Kanehisa M. 2002. The KEGG database. Novartis Found Symp 247:91–101. doi: 10.1002/0470857897.ch8. [DOI] [PubMed] [Google Scholar]
Associated Data
This section collects any data citations, data availability statements, or supplementary materials included in this article.