

Abstract
As an observer translates, objects lying at different distances from the observer have differential image motion on the retina (motion parallax). It is well established psychophysically that humans perceive depth rather precisely from motion parallax and that extraretinal signals may be used to correctly perceive the sign of depth (near vs far) when binocular and pictorial depth cues are absent or weak. However, the neural basis for this capacity remains poorly understood. We have shown previously that neurons in the macaque middle temporal (MT) area combine retinal image motion with smooth eye movement command signals to signal depth sign from motion parallax. However, those studies were performed in animals that were required simply to track a visual target, thus precluding direct comparisons between neural activity and behavior. Here, we examine the activity of MT neurons in rhesus monkeys that were trained to discriminate depth sign based on motion parallax, in the absence of binocular disparity and pictorial depth cues. We find that the most sensitive MT neurons approach behavioral sensitivity, whereas the average neuron is twofold to threefold less sensitive than the animal. We also find that MT responses are predictive of perceptual decisions (independent of the visual stimulus), consistent with a role for MT in providing sensory signals for this behavior. Our findings suggest that, in addition to its established roles in processing stereoscopic depth, area MT is well suited to contribute to perception of depth based on motion parallax.
Keywords: decision, depth, macaque, motion parallax, sensitivity
Introduction
When an observer translates through their surroundings, objects that are stationary in the world generally move on the retina, and this image motion depends on the location of an object in three dimensions. For example, when an observer translates laterally while maintaining gaze on a world-fixed point, objects that are nearer than the fixation distance move in one direction on the retina whereas far objects move in the opposite direction (Fig. 1A). In addition, the speed of image motion increases with distance from the plane of fixation. Motion parallax (MP) refers to differences in image motion produced by objects at different depths (Howard and Rogers, 1995). Psychophysical studies have shown that MP is a sufficient cue for depth perception (Rogers and Graham, 1979; Ono et al., 1986; Durgin et al., 1995; Nawrot, 2003; Naji and Freeman, 2004). However, the neural basis of depth perception from MP is much less understood.
Figure 1.
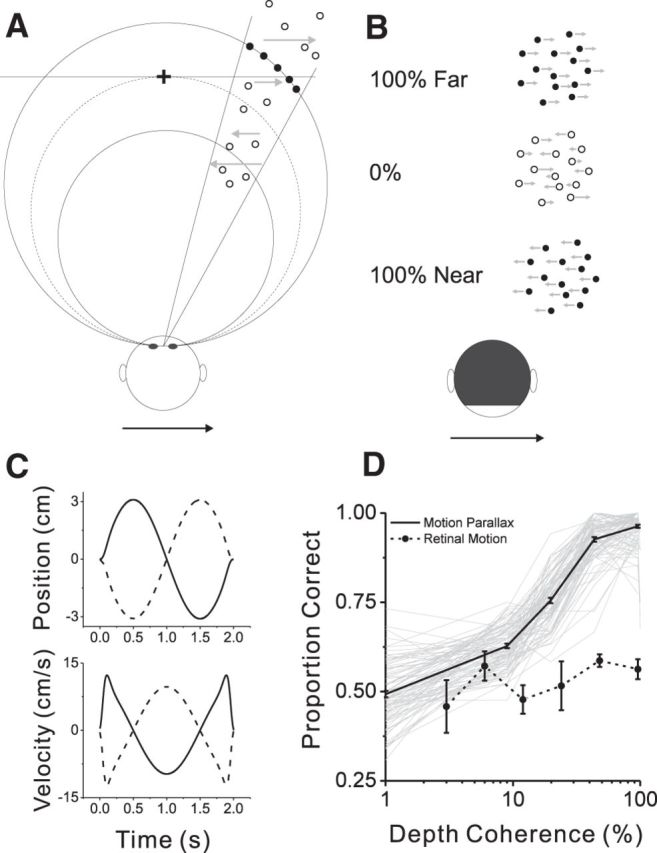
Depth discrimination task and behavioral performance. A, Top-down view illustrating the random-dot stimulus for the discrimination task. For each trial, signal dots (filled circles) were presented at either a near or far depth (solid curves). Depth coherence determines the proportion of signal dots, whereas the remaining noise dots (open circles) were distributed over a range of depths. Filled and open symbols are used here for illustrative purpose only; signal and noise dots were identical in the actual display. B, Three examples of image motion associated with rightward translation of the animal. At 100% depth coherence, all dots move rightward when the depth is far (top row), whereas all dots move leftward when the depth is near (bottom row). At 0% depth coherence, dots move in both directions (middle row). C, Animals were translated sinusoidally along an axis in the frontoparallel plane. The time courses of position (top) and velocity (bottom) of whole-body movement along the axis of translation are shown. D, Psychometric functions are shown for all individual sessions (gray, n = 91), along with the mean (thick black trace). Filled symbols and dashed curve show the mean psychometric function from seven sessions in which the animals were not physically translated and no extraretinal signals were present. Error bars denote SEM.
We showed previously that neurons in the middle temporal (MT) area of macaque monkeys signal depth sign (near vs far) from MP (Nadler et al., 2008). In those experiments, stereoscopic and pictorial depth cues were eliminated, such that the visual stimuli were depth-sign ambiguous, and extraretinal signals were required to specify depth. Additional experiments revealed that the critical extraretinal signal is a smooth eye movement command signal, not a vestibular signal (Nadler et al., 2009), consistent with conclusions from human psychophysics (Nawrot, 2003; Naji and Freeman, 2004; Nawrot and Joyce, 2006; Nawrot and Stroyan, 2009).
However, the existence of neurons that code depth sign from MP does not necessarily imply that these signals are used by the brain to perceive depth. There could be other reasons why smooth eye movement command signals modulate responses of MT neurons. For example, these signals could reflect mechanisms of compensation for retinal slip induced by eye movements (Wallach, 1987). Therefore, it remains unclear whether MT neurons are involved in perceiving depth from MP. As a first step toward establishing functional links between MT responses and depth perception based on MP, we address the following questions. Are MT neurons sufficiently sensitive to account for behavioral performance? Are neural responses predictive of perceptual decisions on a trial-by-trial basis? Addressing these questions has been instrumental previously in linking MT activity to perception of motion and stereoscopic depth structure (Britten et al., 1992; Celebrini and Newsome, 1994; Dodd et al., 2001; Uka and DeAngelis, 2004; Liu and Newsome, 2005).
We measured responses of MT neurons while animals judged the depth sign of a monocular random-dot stimulus based on MP. We found that the best neurons had sensitivity on par with behavior and that MT responses were correlated with perceptual decisions across trials. In addition to its established roles in perception of motion and depth from binocular disparity, our results suggest that area MT is also involved in the perception of depth from MP.
Materials and Methods
Subjects and surgery
Two male monkeys (Macaca mulatta, 8–12 kg) participated in these experiments. Standard aseptic surgical procedures under gas anesthesia were performed to implant a head-restraint device. A Delrin (DuPont) ring was attached to the skull using a combination of dental acrylic cement, bone screws, and titanium inverted T-bolts (for details, see Gu et al., 2006). To monitor eye movements using the magnetic search coil technique, a scleral coil was implanted under the conjunctiva of one eye.
After 6–12 months of training on the depth-discrimination task (described below), a recording grid made of Delrin was affixed inside the ring using dental acrylic. The grid (2 × 4 × 0.5 cm) contains a dense array of holes spaced 0.8 mm apart. Under anesthesia and using sterile technique, small burr holes (∼0.5 mm diameter) were drilled vertically through the recording grid to allow the penetration of microelectrodes into the brain via a transdural guide tube. All surgical procedures and experimental protocols were approved by University Committee on Animal Resources at the University of Rochester.
Experimental apparatus
In each experimental session, animals were seated in a custom-built primate chair that was secured to a six degree-of-freedom motion platform (MOOG 6DOF2000E). The motion platform was used to generate passive body translation along an axis in the frontoparallel plane, and the trajectory of the platform was controlled in real time at 60 Hz over a dedicated Ethernet link (for detailed information, see Gu et al., 2006). A field coil frame (C-N-C Engineering) was mounted on top of the motion platform to measure eye movements.
Visual stimuli were rear-projected onto a 60 × 60 cm tangent screen using a stereoscopic projector (Mirage S+3K; Christie Digital) that was also mounted on the motion platform (Gu et al., 2006). The display screen was attached to the front side of the field coil frame. To restrict the animal's field of view to visual stimuli displayed on the tangent screen, the sides and top of the field coil frame were covered with matte black enclosures.
To generate accurate visual simulations of the animal's movement through a virtual environment, an OpenGL camera was placed at the location of one eye, and the camera moved precisely according to the movement trajectory of the platform. Because the motion platform has its own dynamics, we characterized the transfer function of the motion platform, as described previously (Gu et al., 2006), and we generated visual stimuli according to the predicted motion of the platform. To account for a delay between the command signal and the actual movement of the platform, we adjusted a delay parameter to synchronize visual motion with platform movement. Synchronization was confirmed by presenting a world-fixed target in the virtual environment and superimposing a small spot by a room-mounted laser pointer while the platform is in motion (Gu et al., 2006).
Electrophysiological recordings
We recorded extracellular single-unit activity using tungsten microelectrodes (FHC) having a typical impedance of 1–3 MΩ. The electrode was loaded into a transdural guide tube and was advanced with a hydraulic micro-manipulator (Narishige). The voltage signal was amplified and filtered (1–6 kHz) using conventional hardware (BAK Electronics). Single-unit spikes were detected using a window discriminator (BAK Electronics), and the output was time stamped with 1 ms resolution.
Eye position signals were sampled at 200 Hz (TEMPO; Reflective Computing). The raw voltage signal from the microelectrode was digitized and recorded to disk at 25 kHz using a Power1401 data acquisition system (Cambridge Electronic Design). If necessary, single units were resorted offline using a template-based method (Spike2; Cambridge Electronic Design).
The location of area MT was identified initially in each animal through analysis of structural MRI scans, which were segmented, flattened, and registered with a standard macaque atlas using CARET software (Van Essen et al., 2001). The position of area MT in the posterior bank of the superior temporal sulcus (STS) was then projected onto the horizontal plane, and grid holes around the projection area were explored systematically in mapping experiments. In addition to the MRI scans, the physiological properties of neurons and the patterns of gray matter and white matter encountered along electrode penetrations provided essential evidence for identifying MT. In a typical electrode penetration through the STS that encounters area MT, we first encountered neurons with very large receptive fields and visual motion sensitivity, as expected for the dorsal division of the medial superior temporal (MSTd) area. This was typically followed by a very quiet region as the electrode passed through the lumen of the STS, and then area MT was the next region of gray matter. As expected from previous studies, receptive fields of MT neurons were substantially smaller than those in area MSTd (Komatsu and Wurtz, 1988), and some MT neurons exhibited strong surround suppression (DeAngelis and Uka, 2003), which is typically not seen in area MSTd. Confirming a putative localization of the electrode to area MT, we observed gradual changes in the preferred direction, preferred disparity, and receptive field location of multiunit activity, consistent with those described previously (Albright et al., 1984; DeAngelis et al., 1999).
Visual stimuli
Visual stimuli were generated by a custom-written C++ program using the OpenGL three-dimensional (3D) graphics library and were displayed using a hardware-accelerated OpenGL graphics card (NVIDIA Quadro FX 1700). The location of the OpenGL camera was matched to the location of the animal's eye, and images were generated using perspective projection. We calibrated the display such that the virtual environment had the same spatial scale as the physical space through which the platform moved the animal. To view stimuli stereoscopically, animals wore anaglyphic glasses with red and green filters (Kodak Wratten 2 numbers 29 and 61, respectively). The crosstalk between the eyes was measured using a photometer and found to be very small (0.3% for the green filter and 0.1% for the red filter).
We used the following procedure to generate random-dot stimuli that produce a percept of depth from MP (for details, see Nadler et al., 2008, their supplemental materials). A circular aperture having a diameter slightly greater (∼10%) than the optimal stimulus size was centered over the receptive field on the visual display. The initial position of each dot was generated by independently choosing random horizontal and vertical locations within the aperture.
Shifting these random dots in depth (e.g., along the z-axis) is not sufficient to create an accurate MP stimulus. If dots lie on the theoretical horizontal horopter, the Vieth–Müller circle (VM), and the animal's eye moves along the VM circle while maintaining fixation on the target, then the retinal image motion of the dots will be 0. More generally, if dots are placed along a 3D surface that corresponds to a particular binocular disparity (referred to as an “equivalent disparity”), then the motion of dots will be homogeneous within the aperture. A set of such dots having a constant equivalent disparity forms a vertical cylinder. Figure 1A shows cross-sections through vertical cylinders corresponding to zero disparity (dotted circle), as well as near and far disparities (solid circles). Note that the frontoparallel display screen lies farther away in depth than the cylinder representing zero equivalent disparity, except for the set of dots along the vertical meridian.
To present stimuli at a specific equivalent disparity, the set of random dots within the circular aperture was ray traced onto a cylinder corresponding to the desired equivalent disparity, as described in detail previously (Nadler et al., 2008). This ray-tracing procedure ensured that the size, location, and density of the random-dot patch were constant across simulated depths. Size and occlusion cues were eliminated by rendering transparent dots with a constant retinal size (0.39°). Critically, this procedure removed pictorial depth cues and rendered the visual stimulus depth-sign ambiguous, thus requiring interaction of retinal motion (RM) with extraretinal signals to perceive depth (Nadler et al., 2009).
The above description assumes lateral translation of the observer in the horizontal plane. However, in our experiments, animals were translated along an axis in the frontoparallel plane that was aligned with the preferred-null direction of the neuron under study (to elicit robust neural responses). In this case, we rotated the virtual stimulus cylinder about the naso-occipital axis such that the axis of translation of the observer was always orthogonal to the long axis of the cylinder (Nadler et al 2008, Supplementary Fig. 1D). This ensures that dots having the same equivalent disparities produce the same retinal speeds regardless of the axis of observer translation.
Experimental protocol
Preliminary measurements.
After isolating the action potential of a single neuron, the receptive field was explored manually using a small (typically 2–3°) patch of random dots. The direction, speed, position, and binocular disparity of the random-dot patch were manipulated using a computer mouse, and instantaneous firing rates were plotted on a display interface that represents the spatial location of the patch in visual space and the stimulus velocity in a direction-speed space. This procedure was used to estimate the location and size of the receptive field and to estimate the preferences of the neuron for direction, speed, and binocular disparity.
After these qualitative tests, we measured the direction, speed, binocular disparity, and size tuning of each neuron using quantitative protocols (for detailed methods, see DeAngelis and Uka, 2003). Each of these measurements was performed in a separate block of trials, and each distinct stimulus was repeated three to five times. Direction tuning was measured with random dots that moved in eight different directions separated by 45°. Speed tuning was measured, at the preferred direction, with random-dot stimuli that moved at speeds of 0, 0.5, 1, 2, 4, 8, 16, and 32°/s. Our MP stimuli contained speeds of motion that were <7°/s. If a neuron gave very little response (<5 spikes/s) to these slow speeds, the neuron was not studied further. Next, the spatial profile of the receptive field was measured by presenting a patch of random dots at all locations on a 4 × 4 grid that covered the receptive field. The height and width of the grid were 1.5–2.5 times larger than the estimated receptive field size, and each small patch was approximately one-quarter the size of the receptive field. Responses were fitted by a 2D Gaussian function to estimate the center location and size of the receptive field. To measure binocular disparity tuning, a random-dot stereogram was presented at binocular disparities ranging from −2 to +2° in steps of 0.5°. Finally, size tuning was measured with random-dot patches having diameters of 0.5, 1, 2, 4, 8, 16, or 32°.
Depth tuning measurements.
Depth tuning from MP was measured using random dots with 100% depth coherence (Nadler et al., 2008). Dots were placed at one of nine depths (−2 to +2° of equivalent disparity in steps of 0.5°), in addition to the null condition in which only the fixation target was presented. In all experimental conditions reported here, the fixation target was presented to both eyes. We randomly interleaved MP and RM conditions (Nadler et al., 2008), as described further below, and each distinct stimulus was repeated 6–10 times.
In the MP condition, animals underwent passive whole-body translation that followed a modified sinusoidal trajectory along an axis in the frontoparallel plane (Fig. 1C). To smooth the onset and offset of the stimulus, the 0.5 Hz sinusoid was multiplied by a Gaussian function, G(t), that was exponentiated to a large power as follows:
 |
where t0 = 1.0 s, σ = 0.92, and n = 22. On half of the trials, platform movement started toward the preferred direction of the neuron. On the other half, the motion started toward the null direction of the neuron. During body translation, animals were required to maintain fixation on a world-fixed target, which required a compensatory smooth eye movement in the direction opposite to head movement. We moved the OpenGL camera in precise synchrony with the animals' head movement, such that the camera remained at the animals' actual eye position during the motion trajectory. This ensured that the animals received accurate optical stimulation.
In the RM condition, image motion of the random-dot patch was the same as in the MP condition, but the animal was not translated by the motion platform and was not required to make any eye movements. Rather, we translated the OpenGL camera and counter-rotated it such that the camera was always aiming at the fixation target, thus simulating the combination of eye translation and rotation that occurred in the MP condition. As a result, the retinal image motion of the patch is identical to what the animals would see if they pursued the fixation target perfectly in the MP condition. Note, however, that no extraretinal signals were available in the RM condition to disambiguate depth sign.
RM and MP conditions were interleaved randomly within a block of trials. For depth tuning measurements in the MP and RM conditions and the depth discrimination task described below, visual stimuli were presented monocularly. For other basic tuning protocols, stimuli were presented to both eyes.
Depth discrimination task.
For neurons that showed some depth tuning from MP, a pair of near and far depths with equal but opposite sign were chosen as the “preferred” and “null” depths of the neuron, for the purposes of the depth discrimination task. In all cases, we attempted to determine (by inspection of online tuning curves) a pair of near and far depths, symmetric around zero, that approximately maximized the difference in firing rates of the neuron. We refer to these as “signal” depths. On each trial, one of the two signal depths was chosen randomly.
We introduced “depth coherence” to manipulate the amount of depth noise in the random-dot display. Depth coherence determines the proportion of dots located at a designated depth, with the remaining dots distributed uniformly in a range from −2 to +2° of equivalent disparity (Fig. 1A). As a result, all dots in a 100% coherence stimulus had the same direction and speed of motion at each point in time, whereas dots in a 0% coherence stimulus had a range of speeds defined by their individual depths. Because half of the dots were located near and the other half were located far at 0% coherence, half of the dots moved in each of the two opposite directions of motion (Fig. 1B).
The animal's task was to judge whether the average depth of the stimulus was near or far relative to the fixation target. Depth coherence was used to manipulate the difficulty of the task. We used depth coherence values of 0, 9, 19.8, 43.6, and 95.8% in most experiments, whereas four datasets were collected using coherence values of 0, 6, 12, 24, 48, and 96%. Eight of the former datasets also included 100% coherence. For each depth coherence, there were two starting phases of platform movement (toward the preferred or null direction of each neuron). All combinations of two depths, five coherences, and two platform movement phases were interleaved randomly in a block of trials using the method of constant stimuli. Each distinct combination of depth and coherence was repeated at least 20 times.
At the beginning of each trial, the fixation target appeared at the center of the screen. After the animal established fixation for 0.2 s, a patch of dots was presented in the virtual environment while the animal was translated back and forth sinusoidally (Fig. 1C). A small electronic window around the fixation target was used to monitor pursuit accuracy. The initial size of the target window was 3–4°, and it shrunk to 2.1–2.8° after 250 ms of platform movement. This allowed the animal a brief period of time to initiate pursuit and execute a catch-up saccade to arrive on target. At the end of visual stimulation, both the fixation target and the visual stimulus disappeared and two targets (0.4° in diameter, located 5° above and below the fixation target) appeared. The animal then made a saccadic eye movement to report the depth of the stimulus (upward for far and downward for near) and obtained a liquid reward (0.2–0.4 ml) for correct answers.
In seven sessions, the depth discrimination task was performed without any body translation by the motion platform (Fig. 1D, Retinal Motion). In this case, the animal remained stationary and simply fixated a visual target while self-motion was simulated as in the RM condition. The rest of the task structure remained identical, and this condition served as a control to demonstrate that the visual stimulus is depth-sign ambiguous without extraretinal signals.
Data analysis
Depth-sign tuning and discrimination index.
Average firing rates during the stimulus presentation were plotted as a function of simulated depth (Fig. 2A) to construct depth tuning curves. To quantify the relative strength of neural responses to near and far depths defined by MP, we computed a depth-sign discrimination index (DSDI; Nadler et al., 2008, 2009):
 |
For each pair of depths symmetrical around zero (for example, ±2°), the difference in mean response between far (Rfar) and near (Rnear) depths was computed relative to response variability (σavg, the average SD of responses to the two depths). This quantity was then averaged across the four pairs of depth magnitudes to obtain the DSDI (−1 < DSDI < +1). Near-preferring neurons have negative DSDI values, whereas far-preferring neurons have positive DSDI values. Statistical significance of DSDI values was evaluated using a permutation test in which DSDI values were computed 1000 times after shuffling responses across depths. If the measured DSDI value is negative, the p value is the proportion of shuffled DSDIs less than the measured DSDI value. If the measured DSDI is positive, the p value is the proportion of DSDIs greater than the measured DSDI value.
Figure 2.
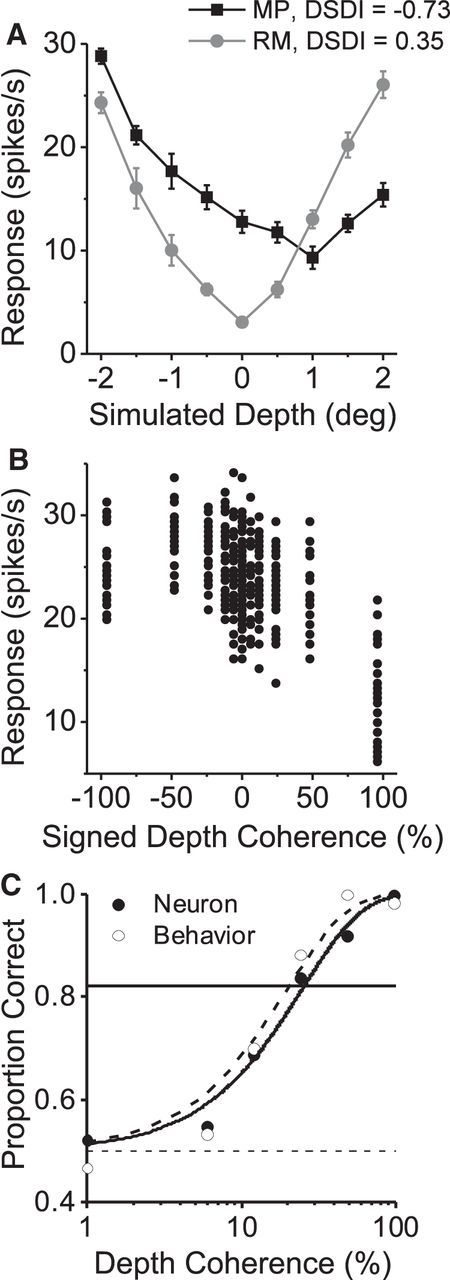
Computation of neuronal performance and its comparison with behavior. A, Depth tuning curves of an example MT neuron are shown for the MP (black) and RM (gray) conditions. B, Firing rates for individual trials of the discrimination task are plotted against signed depth coherence for the same example neuron. Negative and positive coherences correspond to near and far signal dots, respectively. C, Ideal observer performance is plotted against the magnitude of depth coherence (filled symbols) to construct a neurometric function. Open symbols, Behavioral performance in the same session. Smooth curves show Weibull functions that were fitted to the neuronal (solid curve) and psychophysical (dashed curve) data.
Calculation of pursuit gain.
In the MP condition, animals performed smooth pursuit eye movements to maintain fixation on a world-fixed target during body translation. Accuracy of smooth pursuit was quantified by calculating a pursuit gain. We computed the amplitude of the fundamental frequency (0.5 Hz) of the average eye velocity traces using a Fourier transform, and this was divided by the Fourier amplitude of the 0.5Hz component of target velocity. Pursuit gain <1 denotes under-pursuit, and values >1 indicate over-pursuit.
Neurometric performance.
We used ideal observer analysis to measure how reliably MT neurons can signal the depth sign of a stimulus (Green and Swets, 1966). For each depth coherence, the distribution of drift-corrected firing rates across trials was sorted into two groups according to the depth sign of the stimuli (near vs far). A receiver operating characteristic (ROC) curve was computed from the pair of response distributions for each depth coherence (Britten et al., 1992), and performance of an ideal observer was defined as the area under the ROC curve. ROC values were then plotted as a function of depth coherence to construct a neurometric function.
To quantify behavioral and neuronal sensitivity, we fitted the psychometric and neurometric functions with the integral of Weibull function (Britten et al., 1992):
 |
where c denotes depth coherence, α is the coherence threshold (at the 82% correct level), and β represents the slope of the fitted function. We used the fitted values of α to summarize neural and psychophysical sensitivity for each experiment.
Choice probability.
Choice probability (CP) is a measure of the relationship between neural responses and perceptual decisions, independent of the stimulus (Celebrini and Newsome, 1994; Britten et al., 1996). The procedure for computing CP is identical to that described above, except that responses are sorted into two groups according to the animal's perceptual decision (near choices vs far choices), not according to stimulus depth sign. The 0% depth coherence trials were used to compute CPs (see Fig. 5). To increase statistical power, we also included data from other coherences, if there was a sufficient proportion of choices in favor of both possible outcomes (choice ratio no less balanced than 1:3). To pool data across stimulus conditions, responses were z-scored for each distinct combination of depth sign and depth coherence and then combined into a single pair of distributions. The ROC value computed from these pooled response distributions is called a “grand” CP (Britten et al., 1996). z-Scoring responses in conditions with mostly imbalanced choice ratios can result in underestimation of the grand CP (Kang and Maunsell, 2012). To avoid this, we used “balanced z-scoring” (Kang and Maunsell, 2012). A permutation test was used to determine whether the measured CP values are significantly different from the chance level of 0.5 (Uka and DeAngelis, 2004).
Figure 5.

Example of choice-dependent response and summary of choice probability data. A, Responses of an example neuron to 0% depth coherence were sorted into two groups according to the monkey's choice (preferred choices, filled bars; null choices, open bars). Inset, The depth tuning curve of this example neuron. Filled and open triangles indicate the preferred and nonpreferred depths of signal dots in the discrimination task, respectively. B, Summary of CPs measured at 0% coherence. Filled bars indicate neurons for which the CP was significantly different from 0.5 (permutation test, p < 0.05). Arrowhead, Mean choice probability. Eighty-two neurons are included in this plot, provided that the ratio of choices at 0% coherence was no more imbalanced than 3:1. C, Responses of the same neuron were z-scored separately for each depth coherence and pooled into a single pair of distributions to compute grand CP. D, Summary of grand CPs for all 91 neurons in the sample. Format as in B.
We tested whether slow drifts of neural responses might bias our CP measurements by detrending neural activity. Responses were z-scored for each depth sign and coherence and then regressed against trial number. The residuals from this linear fit were used for computing CP. For comparison, we removed slow fluctuations in mean firing rate using locally weighted scatter plot smoothing (LOESS) with a tricubic window (span of 60 trials, full-width at half-height equal to 42 trials). This method does not assume a linear trend in responsiveness and was performed both with and without first z-scoring responses. Finally, we also measured CP values without any correction for drifts in responsiveness. Grand CP values computed using our main method (z-scoring and linear regression) were highly correlated with those measured using LOESS with z-scoring (r = 0.93), LOESS without z-scoring (r = 0.96), and no drift correction (r = 0.89; p < 10−30 for each correlation, n = 91, Spearman's rank correlations). The median CP value from our main method was not significantly different from those of the other three methods (p = 0.57, 0.89, and 0.84, respectively, Wilcoxon's signed-rank tests, n = 91). Thus, it was clear that slow drifts of neural responses had a negligible effect on our measurements of CP.
A bootstrap method was used to compute confidence intervals for measured CPs. Responses were resampled with replacement from the two measured response distributions (sorted by choice), from which CP was originally computed. We repeated this procedure 1000 times to build a distribution of bootstrap CPs, and the confidence interval was defined as the range that encompassed the central 95% of the distribution.
Eye movements.
To investigate the effect of eye movement errors on the animals' percepts of depth, we analyzed the relationship between pursuit performance and perceptual choice. Pursuit gains were computed for individual trials as described above and were sorted into two groups according to the animals' choice (near vs far). ROC analysis was then used to compute the relationship between pursuit gain and choice, in the analogous manner to computing CP from firing rates. A smaller pursuit gain generates retinal slip that corresponds to nearer depth (Nadler et al., 2008, their supplemental Fig. S5). Therefore, the “pursuit choice probability” indicates that how well we can predict far choices when the pursuit gain is greater than average or vice versa.
Results
We collected data from 296 neurons in area MT of two macaque monkeys (108 from monkey 1, 188 from monkey 2). Most neurons showed significant direction selectivity (289 of 296), and a majority of neurons (195 of 251) showed significant depth tuning from binocular disparity (ANOVA, p < 0.05), as shown previously (DeAngelis and Uka, 2003). We attempted to record from any neuron that we isolated in area MT, except for the small percentage of neurons (∼6%) that did not respond robustly (>5 spikes/s) over the range of speeds of motion (0–7°/s) used in our depth discrimination task (see Materials and Methods). Measurements of depth-sign tuning from MP were completed for 109 neurons, and 97 neurons showed significant depth-sign tuning (permutation test on DSDI metric; see Materials and Methods). We were able to complete a sufficient number of stimulus repetitions (20 for each depth coherence) in the discrimination task for 91 neurons (41 from monkey 1, 50 from monkey 2), and these 91 neurons form the main sample for our analyses.
Behavioral and neuronal sensitivity to depth from MP
Animals were trained to judge the depth sign (near vs far) of visual stimuli based on MP. In our stimuli, a fraction of “signal dots” were presented at either a near or far depth, whereas the remaining “noise dots” were assigned random depths corresponding to equivalent disparities ranging from −2 to +2° (Fig. 1A). Signal dots were presented at either the preferred depth of the recorded neuron or the depth that was equal in magnitude but opposite in sign. Near and far dots moved in opposite directions (Fig. 1B) while the monkey was translated back and forth along a quasi-sinusoidal trajectory (Fig. 1C) within the frontoparallel plane.
The percentage of signal dots (depth coherence) was manipulated to control the difficulty level of the task, and the animals' performance increased monotonically with depth coherence (Fig. 1D, Motion Parallax). To quantify psychophysical sensitivity, a Weibull function was fitted to the proportion correct data, and the depth coherence at 82% correct was defined as the psychophysical threshold (see Materials and Methods). Median ± SEM psychophysical thresholds of the two animals were very similar (monkey 1, 26.0 ± 2.3%; monkey 2, 26.4 ± 1.7%) and were not significantly different from each other (p = 0.35, Wilcoxon's rank-sum test). For a handful of sessions, we tested whether the animals can judge depth sign in the absence of extraretinal signals. In this control, self-motion was simulated visually (RM condition; see Materials and Methods). The animals performed very poorly in this condition (Fig. 1D, Retinal Motion), which confirms that our task requires the animals to combine retinal and extraretinal signals to perceive the sign of depth from MP.
Once a single unit was isolated within area MT, we ran basic tuning protocols to characterize receptive field properties, and depth tuning from MP was measured using stimuli with 100% depth coherence. Figure 2A shows data for an example near-preferring neuron. In this case, we chose ±2° as the two depths for the signal dots, because the difference in response between opposite depth signs was approximately maximal in this case.
Data recorded during the discrimination task are shown for the example neuron in Figure 2B. Positive and negative coherences correspond to signal dots presented at far and near depths, respectively. At the highest depth coherence (±96%), distributions of responses to near and far depths are primarily non-overlapping and thus easily discriminable. As depth coherence decreases, the difference in response between the preferred and null depths becomes smaller (Fig. 2B), and thus the stimuli are harder to discriminate based on the neural response. We quantified the discriminability of single neurons in our task using ideal observer analysis (Britten et al., 1992; Uka and DeAngelis, 2003). Using ROC analysis, we computed the proportion correct of the ideal observer for each depth coherence, and we plotted these values against depth coherence to construct a neurometric function (Fig. 2C, filled symbols). A Weibull function was fitted to the neurometric function to extract a neuronal discrimination threshold. For this example neuron, the neuronal threshold is 24.9%, which is comparable with the animal's psychophysical threshold (19.9%) in the same session (Fig. 2C, open symbols).
Figure 3 shows neurometric and psychometric functions for six additional example neurons. For some cells, neuronal sensitivity is comparable with behavior (Fig. 3A–C). Many MT neurons were substantially less sensitive than behavior (Fig. 3D,F), and a small number of neurons outperformed the animal (Fig. 3E).
Figure 3.
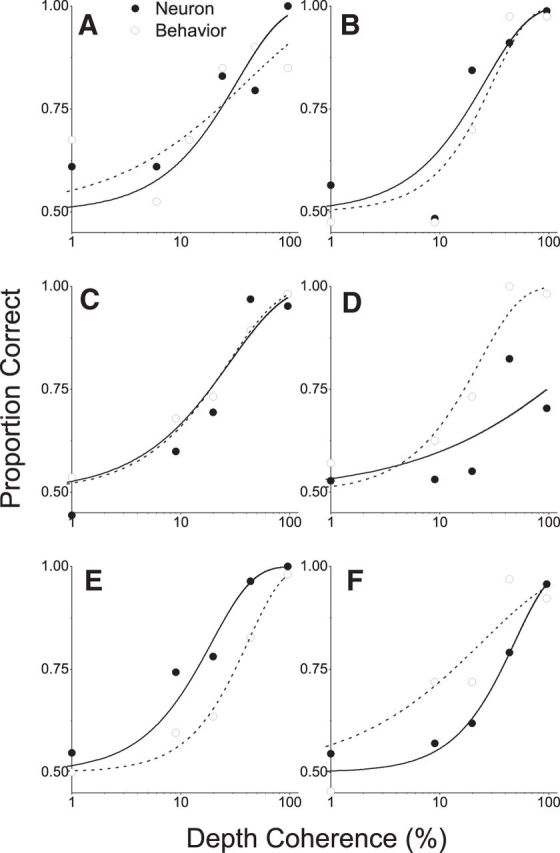
Neurometric and psychometric functions for six example neurons. Format as in Figure 2C. A–C, Example neurons with sensitivity comparable with behavior. D, F, Example neurons that are less sensitive than the animal. E, An example neuron that is more sensitive than behavior in the corresponding session.
To systematically compare neural and behavioral performance, we plotted neuronal and psychophysical thresholds for each dataset (Fig. 4). Data points are clustered below the unity-slope diagonal, indicating that most neuronal thresholds are greater than behavioral thresholds. The median neuronal threshold from monkey 1 (72.7%) was less than that for monkey 2 (93.3%), but the difference was not significant (p = 0.07, Mann–Whitney U test). We further summarized the relationship between neuronal and behavioral sensitivity by computing the ratio of neuronal/psychophysical thresholds (Fig. 4, diagonal histogram). Although the best neurons have threshold ratios close to 1, the geometric mean ± SEM threshold ratio (2.81 ± 0.03) is substantially greater than unity (p < 0.001, Wilcoxon's signed-rank test). This suggests that behavioral performance could be accounted for by the activity of a small number of the most sensitive neurons but may also be consistent with reading out information from a large population of neurons that is limited by suboptimal decoding or correlated noise.
Figure 4.

Summary of neuronal and behavioral sensitivity. Psychophysical threshold is plotted against neuronal threshold for each of the 91 recording sessions. Circles and triangles show data from monkeys 1 and 2, respectively. The diagonal histogram shows the distribution of neuronal/psychophysical threshold ratios. For a small number of insensitive neurons (7 of 41 from monkey 1, 5 of 50 from monkey 2), thresholds could not be estimated reliably (open symbols). These data are plotted here at a threshold value of 500% just for visualization, and these neurons were excluded from the computation of the geometric mean (arrowhead above the histogram).
We examined whether the sensitivity of MT neurons for discriminating depth from MP is correlated with a battery of basic tuning curve properties (DeAngelis and Uka, 2003). Parameters examined include direction selectivity index, preferred direction, preferred speed, receptive field position, preferred binocular disparity, disparity tuning index, preferred size, surround suppression index, and the width and amplitude of each fitted tuning curve. We performed correlation analyses (Spearman's rank correlation, α = 0.05) between each of these parameters and neuronal thresholds. We did not find a significant correlation of neuronal thresholds to any of the tuning parameters listed above (p > 0.05). However, the absolute value of the DSDI (see Materials and Methods) was significantly correlated with neuronal thresholds (r = −0.45, p < 0.01), similar to a previous observation for depth selectivity from binocular disparity (Uka and DeAngelis, 2003). This indicates that tuning strength measured using 100% depth coherence can predict neuronal sensitivity for noisy stimuli.
MT responses correlate with perceptual decisions about depth from MP
For stimuli with low depth coherence, there is considerable variation from trial to trial in both neural firing rates and perceptual decisions. To probe whether activity of MT neurons is functionally linked to depth judgments, we asked whether perceptual decisions could be predicted from the responses of single MT neurons (Celebrini and Newsome, 1994; Britten et al., 1996; Uka and DeAngelis, 2004). We initially explored this relationship for stimuli having 0% depth coherence, as illustrated for an example neuron in Figure 5A. When responses are sorted by the animal's perceptual decision, responses tended to be greater when the animal chose the preferred depth sign of the neuron than the opposite depth sign.
To quantify the relationship between response and choice, we computed the CP by applying ROC analysis to neural responses sorted by choice (Fig. 5A) instead of stimulus. CP quantifies the ability of an ideal observer to predict the animal's choice based on the response of a neuron and has been used widely to describe relationships between neuronal activity and behavior (Celebrini and Newsome, 1994; Britten et al., 1996; Dodd et al., 2001; Uka and DeAngelis, 2004; Purushothaman and Bradley, 2005; Nienborg and Cumming, 2006; de Lafuente and Romo, 2006; Matsumora et al., 2008; Cohen and Newsome, 2009; Shiozaki et al., 2012). For the example neuron of Figure 5A, the choice probability was 0.75 and was significantly >0.5 (permutation test, p = 0.002).
Figure 5B shows a summary of CPs measured for a sample of 82 MT neurons at 0% depth coherence. The mean ± SEM CP is 0.57 ± 0.01, which is significantly >0.5 (p < 10−7, one-sample t test). Note, however, that CP values were significantly different from 0.5 (filled bars) for only 15 of 82 (18%) neurons. This is attributable, at least in part, to the fact that there were a limited number of trials with 0% depth coherence.
To increase the statistical power of our CP analysis, we also computed a grand CP (Celebrini and Newsome, 1994; Britten et al., 1996; Uka and DeAngelis, 2004) by including data from stimulus conditions with nonzero depth coherences. To remove stimulus effects, responses from each coherence and depth were normalized using balanced z-scoring (Kang and Maunsell, 2012) and were combined into a single pair of distributions, sorted by choice (Fig. 5C). For the example neuron, the resulting grand CP was 0.74, again significantly >0.5 (permutation test, p < 0.001).
Across our entire sample of 91 MT neurons, the mean ± SEM value of the grand CP is 0.56 ± 0.01, which is significantly >0.5 (Fig. 5D; p < 10−8, one-sample t test). Because of the increased number of trials used in the analysis, grand CPs are significantly different from 0.5 for 32 of 91 (35%) of neurons, with the vast majority being >0.5 as expected. Grand CPs and 0% coherence CPs are highly correlated across the population (r = 0.67, p < 0.01; data not shown), and the mean values are not significantly different (p = 0.28, paired t test).
These data show that responses of MT neurons are robustly predictive of animals' perceptual decisions about depth from MP. The overall magnitude of CPs in our task is comparable with values reported previously for MT neurons tested in direction discrimination tasks (Britten et al., 1996; Purushothaman and Bradley, 2005) but is somewhat smaller than the mean CP value (0.59) reported for a coarse disparity discrimination task that is highly analogous to our task (Uka and DeAngelis, 2004).
Control for stimulus variations
A general concern when interpreting CPs involves trial-to-trial stimulus variations that might modulate both neural responses and perceptual decisions (Britten et al., 1996). In our stimuli, the position and depth of random dots vary from trial to trial. If these stimulus variations accounted for a substantial portion of both neural response variability and choice variability, then the observed CPs might have been an artifact. To examine this possibility, for a subset of neurons, we generated stimuli such that half of the 0% coherence trials contained identical random-dot patterns in each eye (NOVAR condition), as done in previous studies (Britten et al., 1996; Uka and DeAngelis, 2004). The remaining 0% coherence trials had distinct random distributions of dot locations and equivalent disparities (VAR condition).
We found that the mean ± SEM CP for the NOVAR condition (0.58 ± 0.03) is very similar to that for the VAR condition (0.59 ± 0.02; Fig. 6A), and both values are significantly >0.5 (p < 0.01, t test). Also, we find no significant difference between mean CPs computed from the VAR and NOVAR conditions (Fig. 6B; p = 0.71, paired t test). CP values in the two conditions are not significantly correlated (r = 0.19, p = 0.19), perhaps because the limited number of 0% coherence trials results in large confidence intervals on these CP measures (Fig. 6B). We conclude that trial-to-trial stimulus variations were not responsible for the CPs that we observed.
Figure 6.
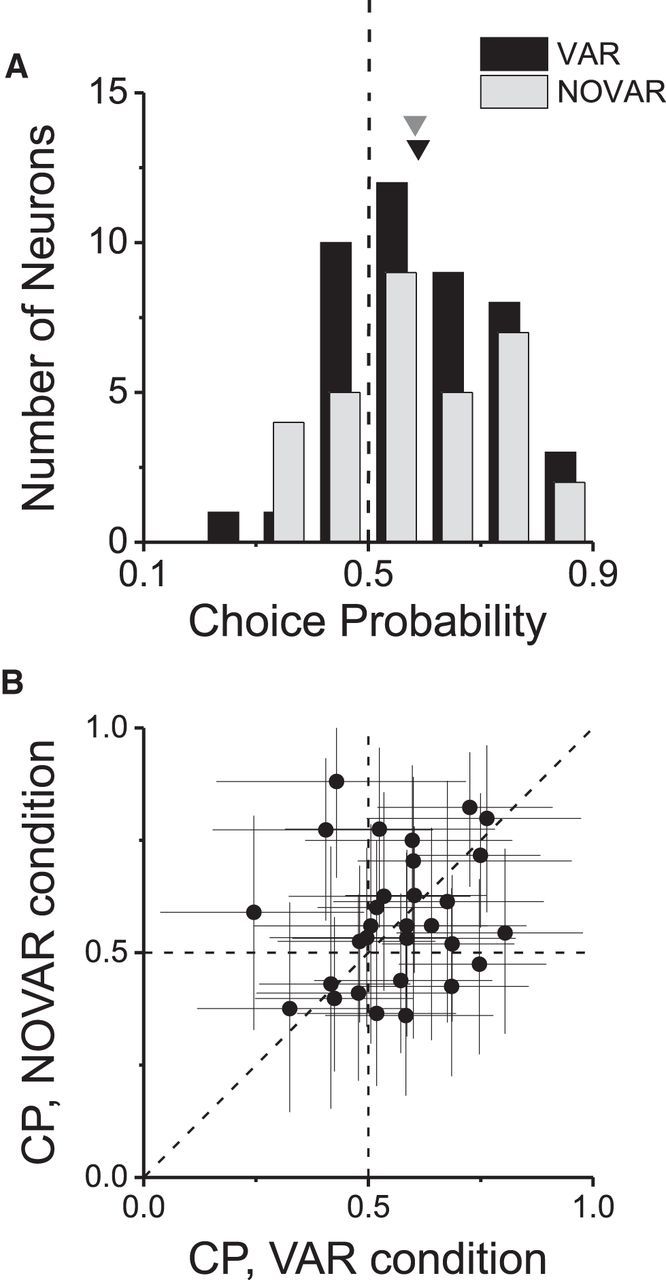
Stimulus variation does not contribute to choice probability. A, Distributions of CPs for subsets of neurons tested in the VAR (n = 43) and NOVAR (n = 32) conditions (for details, see Results). Neurons are included here if the ratio of choices at 0% coherence was no more imbalanced than 3:1. Arrowheads denote mean values. B, For sessions with a choice bias <3:1 for both VAR and NOVAR conditions (n = 30), CP in the NOVAR condition is plotted against CP in the VAR condition. Error bars denote 95% confidence intervals.
Choice effects are not linked to binocular disparity preference
The fact that many MT neurons exhibit grand CPs significantly >0.5 in our task (Fig. 5D) is consistent with the possibility that MT neurons provide evidence in favor of a decision toward their preferred depth sign. However, it is well established that the vast majority of MT neurons are also tuned for depth defined by binocular disparity (Maunsell and Van Essen, 1983; Albright et al., 1984; DeAngelis and Newsome, 1999; DeAngelis and Uka, 2003) and that MT responses are correlated with decisions about depth structure based on disparity (Bradley et al., 1998; Dodd et al., 2001; Uka and DeAngelis, 2004). Because the depth information provided by MP and binocular disparity cues is consistent frequently in the environment, it is possible that MT neurons are correlated with perception in our task simply because they are normally decoded under conditions in which disparity cues are present. This may be especially likely if MT neurons have the same depth-sign preference for disparity and MP. If so, this would question whether MT neurons actually contribute to depth perception based on MP.
Our analysis allows us to reject the possibility that the correlation of MT responses with perceptual decisions is mediated via the disparity preference of each cell. We have shown recently that MT neurons can have either congruent or opposite depth-sign preferences for binocular disparity and MP (Nadler et al., 2013). Figure 7A shows depth tuning curves from an example congruent cell that prefers near depths for both cues. DSDI values for the two conditions are significantly <0 (binocular disparity, DSDI = −0.83; MP, DSDI = −0.82; p < 0.01, permutation test). In contrast, the opposite cell in Figure 7B prefers near stimuli based on MP (DSDI = −0.69) and far stimuli based on binocular disparity (DSDI = 0.67; p < 0.01 for both conditions). In the computation of CP, we define a “preferred choice” according to the sign of the DSDI value of an individual neuron. For the opposite neuron in Figure 7B, a preferred choice based on MP tuning will be near, whereas a preferred choice based on disparity tuning will be far.
Figure 7.

Relationship between CP and congruency of depth tuning for disparity and MP. A, Depth tuning curves for an example congruent neuron that prefers near depths for both MP (open symbols) and disparity (filled symbols). Error bars denote SEM. B, Depth tuning curves for an example opposite cell. Format as in A. C, Distributions of grand CPs for congruent (n = 32, black bars) and opposite (n = 27, gray bars) cells. Congruent cells are defined as having DSDI values for the two depth cues that are both significantly different from 0 but with the same sign. Opposite cells have significant DSDI values for both cues that are opposite in sign. Arrowheads denote mean values. D, Grand CPs computed according to the preferred disparity of each neuron (n = 91; for details, see Results).
If the correlation between the responses of each neuron and decisions about depth were determined by the disparity preference, then CPs for opposite cells should generally be <0.5, whereas those for congruent cells should generally be >0.5. Figure 7C shows CPs for the subset of our neurons that could be classified unambiguously as congruent (DSDI values significantly different from 0 for both cues and same sign) or opposite (DSDI values significantly different from 0 and opposite sign). For both groups of neurons, the median CP values (0.56 for congruent cells; 0.57 for opposite cells) are significantly >0.5 (p = 0.0005 for congruent cells and p = 0.008 for opposite cells, Wilcoxon's signed-rank test) and are not significantly different from each other (p = 0.89, Wilcoxon's rank-sum test). Thus, the CPs of opposite cells appear to be determined by their depth-sign preferences for MP, not their preferences for binocular disparity.
To further examine this issue, we also computed the CP for each neuron based on its preference for binocular disparity. For opposite cells, this simply entailed reversing the sign of the choice effect (by computing 1 − CP). After this manipulation (Fig. 7D), the mean ± SEM CP value (0.51 ± 0.01) is no longer significantly different from chance (p = 0.42, one-sample t test). Thus, we conclude that our main CP results are inconsistent with the possibility of decoding MT neurons according to their disparity preferences (for related arguments, see Gu et al., 2014).
The effect of oculomotor errors on CP
In our task, animals are required to maintain fixation on a world-fixed target by making smooth eye movements, and previous studies have shown that smooth eye movement command signals are sufficient to disambiguate depth under the conditions of our experiment (Nawrot, 2003; Naji and Freeman, 2004; Nadler et al., 2009). Our animals were trained extensively to pursue the fixation target accurately, and their pursuit gains were very close to unity on average (mean ± SEM; monkey 1, 0.98 ± 0.003; monkey 2, 1.02 ± 0.003). In comparison, when pursuit gain was computed in analogous manner for the RM control condition (Fig. 1D), pursuit gain was very close to 0 (mean ± SEM, 0.008 ± 0.001, n = 7 sessions from monkey 1). To further characterize the quality of retinal image stabilization, we computed the root mean square (RMS) error of eye position across all trials and time points in each session, using 5 ms time bins. The RMS error for eye position was 0.32 ± 0.01° (mean ± SEM) across 50 sessions for the MP condition and 0.13 ± 0.01° across seven sessions for the RM condition (data from monkey 1).
Although our animals pursued the fixation target quite accurately on average, there was trial-by-trial variability in the pursuit gain. Such oculomotor errors could potentially inflate the magnitude of the measured CP (Herrington et al., 2009). Specifically, inaccurate eye movements might systematically bias retinal image motion, which could thereby affect the animal's perceptual decision.
To assess the effect of oculomotor errors on our findings, we computed a pursuit CP using the pursuit gain for each trial instead of the firing rate of the neuron (see Materials and Methods). The mean ± SEM value of this pursuit CP was 0.55 ± 0.01 (significantly >0.5, one-sample t test, p < 0.001), indicating that trial-to-trial variability in pursuit gain could explain a small portion of variability in perceptual decisions. Thus, we explored whether the correlation between neural activity and choices (Fig. 5) might be a byproduct of this variability in pursuit gain.
We examined how neural responses covary with pursuit gain across trials by plotting z-scored response (to remove effects of depth and coherence variations) against pursuit gain for each trial. The example neuron (Fig. 8A) shows a weak but significant negative correlation between firing rate and pursuit gain (Rfr,pg = −0.17, p < 0.001, Pearson's correlation), which was one of the strongest correlations we observed. If this correlation between response and pursuit gain (Rfr,pg) drove CPs, then we would expect Rfr,pg to be robustly correlated with CP. In contrast, we found no significant relationship between the magnitude of Rfr,pg and CP (Fig. 8B; r = 0.07, p = 0.52, Spearman's rank correlation). Finally, we recomputed neuronal CPs after removing the relationship between neural response and pursuit gain by computing CP from the residuals of linear fits to data like that in Figure 8A. This manipulation caused a slight reduction in the mean CP value from 0.560 to 0.553 (Fig. 8C). Although this difference was weakly significant (p = 0.013, paired t test), the mean CP value after this correction was still highly significantly >0.5 (p < 10−7, one-sample t test).
Figure 8.
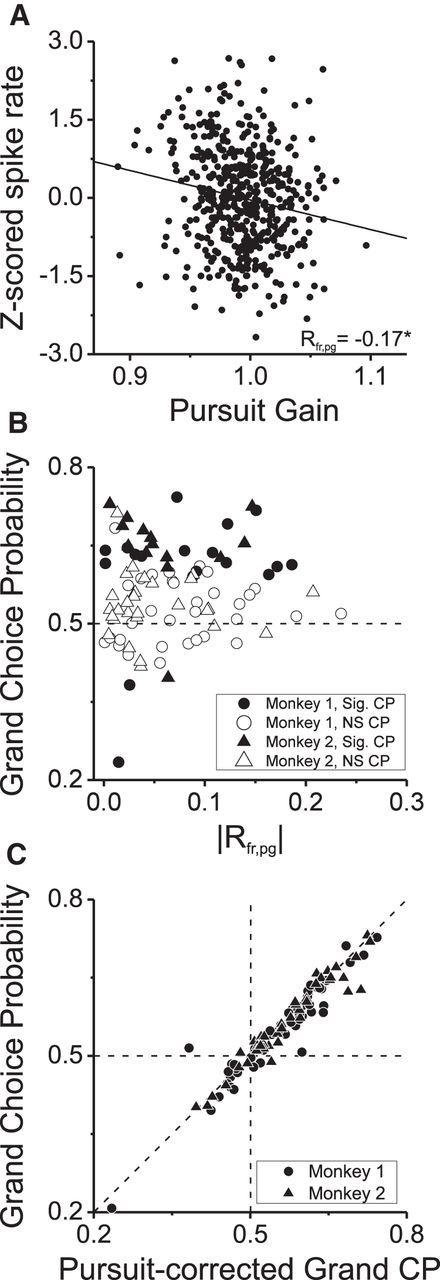
Oculomotor errors cannot account for observed CPs. A, z-Scored spike rates of an example neuron are plotted against the corresponding pursuit gain for each trial. The Pearson's correlation coefficient between firing rate and pursuit gain (Rfr,pg) was −0.17 (p < 0.01). B, CP is plotted against the absolute value of Rfr,pg for our sample of 91 neurons. Filled symbols, Neurons with significant grand CPs. Circles and triangles show data from monkeys 1 and 2, respectively. Sig, Significant; NS, not significant. C, We computed a pursuit-corrected grand CP after partialing out the effect of pursuit gain (i.e., from the residuals of the regression shown in A). Grand CP is plotted against pursuit-corrected CP for our sample of 91 neurons.
Therefore, even if perceptual decisions were influenced by the weak correlation between pursuit gain and neural response, this correlation appears unable to account for the CPs that we have observed. This implies that there are primarily separate components of neural response variability that are linked to perceptual decisions and pursuit gain, respectively.
Discussion
We investigated the functional linkage between MT responses and depth judgments based on MP. Single neurons were generally twofold to threefold less sensitive than psychophysical judgments, with the most sensitive neurons on par with behavior. This may suggest that the activity of a small number of MT neurons is sufficient to account for behavioral performance. However, if behavior depends on few neurons, then we might expect a strong inverse correlation between CP and neuronal threshold, which we did not observe (r = −0.11, p = 0.28, Spearman's rank correlation). Alternatively, perception may depend on the pooled activity of a large population of neurons, provided that information is limited by either suboptimal decoding or correlated noise.
We found that neural responses are weakly correlated with decisions about depth based on MP, such that greater responses predicted decisions in favor of the depth-sign preference of the neuron. Neither the binocular disparity preferences of neurons nor errors in oculomotor pursuit could account for significant CPs. These results suggest that neurons in MT are involved in judging depth from MP, thus extending the functional roles of area MT to perception of 3D structure during navigation.
Our study is the first to record from neurons while animals discriminate depth based on MP and the first to demonstrate conclusively that macaques can perceive depth sign (near vs far) from MP cues. Previous studies have trained animals to distinguish among stimuli based on MP (Cao and Schiller, 2002; Zhang and Schiller, 2008; Schiller et al., 2011) using an “oddball” task in which one stimulus differed in depth from the others. A limitation of this task is that the oddball could be detected simply by a difference in retinal speed, and other cues (e.g., occlusion) were also available to specify depth sign. Thus, one cannot be sure that monkeys judged depth in those experiments, although the reported cue combination effects support that interpretation (Schiller et al., 2011). In contrast, our approach required animals to discriminate depth sign by integrating retinal and extraretinal signals.
Comparison with depth judgments from binocular disparity
Uka and DeAngelis (2003, 2004) measured neuronal thresholds and CPs of MT neurons in monkeys that performed a disparity discrimination task that is closely analogous to our MP task. The median psychophysical threshold found by Uka and DeAngelis (2003) was 24.1%, which is very similar to the median psychophysical threshold in the current study (26.7%). However, the median neuronal threshold in their study was 24.06%, which is substantially smaller than that of the current study (78.29%, based on 79 of 91 neurons for which neuronal thresholds could be estimated reliably). As a result, the geometric mean of the ratio of neuronal/psychophysical thresholds in their study (0.979) is substantially smaller than what we observed (2.81).
We suspected that the lower sensitivity of MT neurons in our study arose because of important differences in visual stimuli. (1) Our MP stimuli are limited to slow retinal speeds (0–7°/s), and many MT neurons prefer faster speeds (Nover et al., 2005). In contrast, Uka and DeAngelis (2003, 2004) tailored their stimuli to the speed preference of each neuron. (2) Our stimuli were monocular, whereas the binocular stimuli of Uka and DeAngelis (2003, 2004) generally elicit stronger responses. (3) Because of the sinusoidal head translation in our task, signal dots were moving in the preferred direction of the neuron for only half (1 s) of the stimulus duration, whereas Uka and DeAngelis (2003, 2004) presented preferred motion throughout a stimulus duration of 1.5 s.
To explore these issues, we directly compared our results with those of Uka and DeAngelis (2003, 2004). Across both datasets, we found that neuronal thresholds were inversely correlated with response modulation, which was defined as the difference in firing rate between preferred and null depths at 100% depth coherence (Fig. 9A). Importantly, whereas ANCOVA revealed a significant main effect of response modulation (p = 0.01), there was no significant effect of task (p = 0.08) and no significant interaction between task and response modulation (p = 0.07). This suggests that differences in neuronal sensitivity between the two studies arise primarily from differences in the efficacy of visual stimuli, although we certainly cannot exclude the possibility that neurons more sensitive to MP exist in the macaque brain. In contrast to the result of Figure 9A, CPs across the two studies did not depend significantly on response modulation (Fig. 9B; ANCOVA, p = 0.29). The difference in mean CP between tasks was marginally significant (p = 0.048), with no significant interaction between task and response modulation (p = 0.56).
Figure 9.
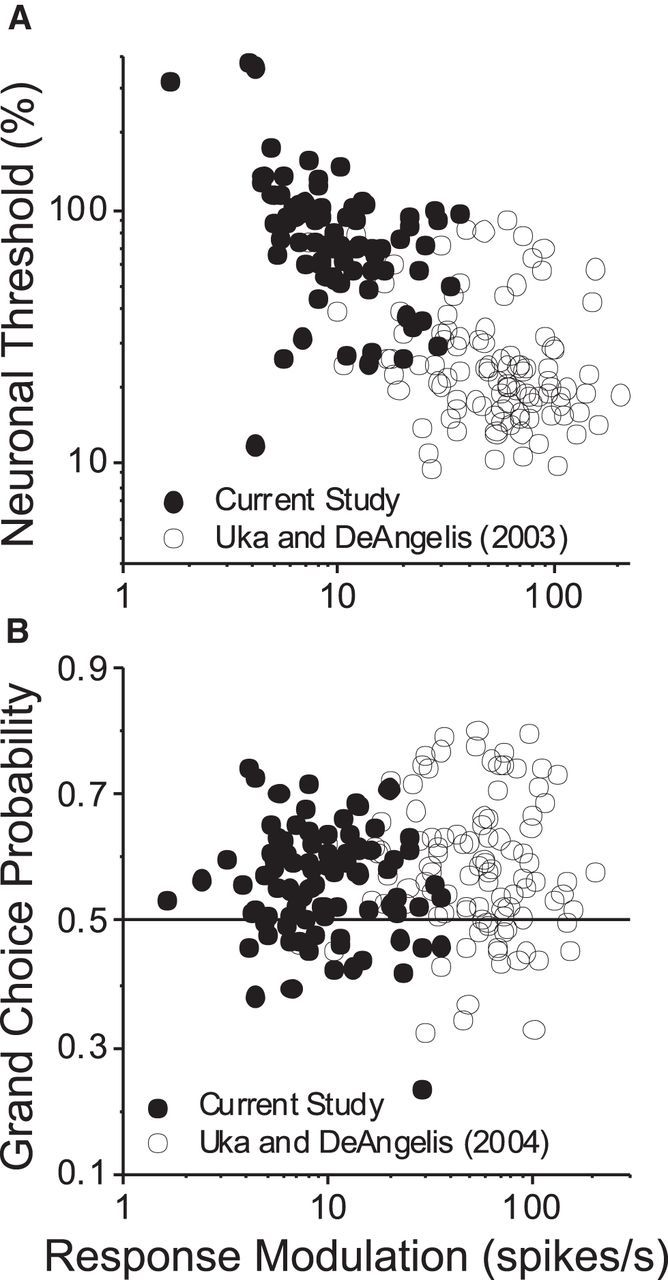
Comparison of neuronal thresholds and CPs between disparity and MP tasks. A, Neuronal threshold is plotted as a function of response modulation for populations of neurons from the present study (n = 79; filled symbols) and that of Uka and DeAngelis (2003) (n = 104; open symbols). Response modulation is defined as the difference in firing rate between the preferred and null depths for each neuron, at 100% depth coherence. For neurons in the present study, preferred and null depths were constrained to be symmetric around 0 depth, whereas they were generally chosen to lie at the peak and trough of the disparity tuning curve in the study of Uka and DeAngelis (2003). Data from neurons with thresholds that could not be estimated reliably (12 of 91 neurons in the present study with thresholds >500%) were excluded. ANCOVA was performed on the relationship between log threshold and log response modulation (for details, see Discussion). B, CP is plotted as a function of response modulation for 90 neurons from the present study (filled symbols) and 104 neurons from the study by Uka and DeAngelis (2004) (open symbols). ANCOVA was performed on the relationship between CP and log response modulation (for details, see Discussion).
The difference in neuronal sensitivity between the disparity and MP tasks might also explain the lower CPs that we observe relative to Uka and DeAngelis (2004). To achieve the same psychophysical performance from neurons with greater thresholds, the brain is likely to pool responses from more neurons (Paradiso, 1988). Because CPs may decline somewhat as pool size increases (Shadlen et al., 1996; Liu et al., 2013), pool size might account for the difference in average CPs between studies.
Differences in CPs between tasks could also depend on the extent to which population decoding is optimal. In many optimal decoding schemes, decoding weights are a function of the tuning curve of each neuron (Dayan and Abbott, 2001; Jazayeri and Movshon, 2006; Graf et al., 2011). Notably, depth tuning curves based on binocular disparity and MP cues are not always congruent (Nadler et al., 2013). If the brain were to use decoding weights that are based on the binocular disparity tuning of MT neurons, these weights would be suboptimal for decoding responses in the MP task when depth tuning is mismatched for the two cues. In such a scenario, responses of “opposite” cells would likely add noise to the judgment, and the CPs of these neurons may be less than those of “congruent” neurons. Our data allow us to reject this extreme form of suboptimal decoding. CPs were not found to be significantly different between congruent and opposite neurons (Fig. 7C), and the average CP was no longer significantly different from 0.5 when it was computed based on the binocular disparity preference of each neuron (Fig. 7D). This suggests that, in our task, MT neurons are decoded according to their depth tuning for MP.
Compatibility of depth signals between binocular disparity and MP
Neurons in macaque area MT are selective for depth from binocular disparity (Maunsell and Van Essen, 1983; DeAngelis and Uka, 2003) and from MP (Nadler et al., 2008). We have shown previously that single MT neurons have tuned responses for both cues (Nadler et al., 2013), which raises the question of whether the two cues are represented in area MT in a form that would be conducive to cue integration.
The brain represents both absolute and relative binocular disparities (Neri et al., 2004; Parker, 2007). Most neurons in early visual cortex (V1, V2, V3/V3A) and dorsal stream areas (including MT) signal absolute disparity, which represents the depth of an object relative to the fixation point (Cumming and Parker, 1999; Thomas et al., 2002; Uka and DeAngelis, 2006; Anzai et al., 2011; but see Tsao et al., 2003; Krug and Parker, 2011). In contrast, neurons in the ventral stream, particularly V4 (Umeda et al., 2007) and also some neurons in V2 (Thomas et al., 2002), represent relative disparity, which is the difference between the absolute disparities of two objects in a scene. Relative disparity is thought to be important for representing the 3D structure of objects, whereas absolute disparity is thought to be important for localizing objects in 3D space (Parker, 2007).
When MP is generated by observer translation, the speed of retinal image motion is determined by the depth of a point relative to the fixation target (Nawrot and Stroyan, 2009). Thus, observer-generated MP is referenced to the fixation point like absolute binocular disparity, not relative disparity. Therefore, the fact that MT neurons represent absolute disparity in similar stimulus geometries (Uka and DeAngelis, 2006) may allow them to integrate MP and binocular disparity cues effectively.
In closing, our findings establish that small groups of MT neurons are likely to be sufficiently sensitive to account for depth discrimination based on MP. Moreover, MT responses are predictive of perceptual decisions, consistent with a role for MT in providing sensory signals for this behavior. Although a causal test of the role of MT in depth perception based on MP awaits future studies, our findings mostly mirror those of previous studies that have suggested functional contributions of area MT to perception of motion direction (Britten et al., 1992, 1996; Purushothaman and Bradley, 2005; Cohen and Newsome, 2009), motion speed (Liu and Newsome, 2005), stereoscopic depth (Uka and DeAngelis, 2003, 2004, 2006; Chowdhury and DeAngelis, 2008), and structure from motion (Bradley et al., 1998; Dodd et al., 2001). Our findings suggest that the functional roles of area MT also include perception of depth based on MP.
Footnotes
The work was supported by National Eye Institute Grant EY013644 and Core Grant EY001319. We thank Dina Knoedl and Swati Shimpi for excellent technical support and Johnny Wen for programming assistance.
References
- Albright TD, Desimone R, Gross CG. Columnar organization of directionally selective cells in visual area MT of the macaque. J Neurophysiol. 1984;51:16–31. doi: 10.1152/jn.1984.51.1.16. [DOI] [PubMed] [Google Scholar]
- Anzai A, Chowdhury SA, DeAngelis GC. Coding of stereoscopic depth information in visual areas V3 and V3A. J Neurosci. 2011;31:10270–10282. doi: 10.1523/JNEUROSCI.5956-10.2011. [DOI] [PMC free article] [PubMed] [Google Scholar]
- Bradley DC, Chang GC, Andersen RA. Encoding of three-dimensional structure-from-motion by primate area MT neurons. Nature. 1998;392:714–717. doi: 10.1038/33688. [DOI] [PubMed] [Google Scholar]
- Britten KH, Shadlen MN, Newsome WT, Movshon JA. The analysis of visual motion: a comparison of neuronal and psychophysical performance. J Neurosci. 1992;12:4745–4765. doi: 10.1523/JNEUROSCI.12-12-04745.1992. [DOI] [PMC free article] [PubMed] [Google Scholar]
- Britten KH, Newsome WT, Shadlen MN, Celebrini S, Movshon JA. A relationship between behavioral choice and the visual responses of neurons in macaque MT. Vis Neurosci. 1996;13:87–100. doi: 10.1017/S095252380000715X. [DOI] [PubMed] [Google Scholar]
- Cao A, Schiller PH. Behavioral assessment of motion parallax and stereopsis as depth cues in rhesus monkeys. Vision Res. 2002;42:1953–1961. doi: 10.1016/S0042-6989(02)00117-7. [DOI] [PubMed] [Google Scholar]
- Celebrini S, Newsome WT. Neuronal and psychophysical sensitivity to motion signals in extrastriate area MST of the macaque monkey. J Neurosci. 1994;14:4109–4124. doi: 10.1523/JNEUROSCI.14-07-04109.1994. [DOI] [PMC free article] [PubMed] [Google Scholar]
- Chowdhury SA, DeAngelis GC. Fine discrimination training alters the causal contribution of macaque area MT to depth perception. Neuron. 2008;60:367–377. doi: 10.1016/j.neuron.2008.08.023. [DOI] [PMC free article] [PubMed] [Google Scholar]
- Cohen MR, Newsome WT. Estimates of the contribution of single neurons to perception depend on timescale and noise correlation. J Neurosci. 2009;29:6635–6648. doi: 10.1523/JNEUROSCI.5179-08.2009. [DOI] [PMC free article] [PubMed] [Google Scholar]
- Cumming BG, Parker AJ. Binocular neurons in V1 of awake monkeys are selective for absolute, not relative, disparity. J Neurosci. 1999;19:5602–5618. doi: 10.1523/JNEUROSCI.19-13-05602.1999. [DOI] [PMC free article] [PubMed] [Google Scholar]
- Dayan P, Abbott LF. Theoretical neuroscience: computational and mathematical modeling of neural systems. Cambridge, MA: Massachusetts Institute of Technology; 2001. [Google Scholar]
- DeAngelis GC, Newsome WT. Organization of disparity-selective neurons in macaque area MT. J Neurosci. 1999;19:1398–1415. doi: 10.1523/JNEUROSCI.19-04-01398.1999. [DOI] [PMC free article] [PubMed] [Google Scholar]
- DeAngelis GC, Uka T. Coding of horizontal disparity and velocity by MT neurons in the alert macaque. J Neurophysiol. 2003;89:1094–1111. doi: 10.1152/jn.00717.2002. [DOI] [PubMed] [Google Scholar]
- DeAngelis GC, Ghose GM, Ohzawa I, Freeman RD. Functional micro-organization of primary visual cortex: receptive field analysis of nearby neurons. J Neurosci. 1999;19:4046–4064. doi: 10.1523/JNEUROSCI.19-10-04046.1999. [DOI] [PMC free article] [PubMed] [Google Scholar]
- de Lafuente V, Romo R. Neural correlate of subjective sensory experience gradually builds up across cortical areas. Proc Natl Acad Sci U S A. 2006;103:14266–14271. doi: 10.1073/pnas.0605826103. [DOI] [PMC free article] [PubMed] [Google Scholar]
- Dodd JV, Krug K, Cumming BG, Parker AJ. Perceptually bistable three-dimensional figures evoke high choice probabilities in cortical area MT. J Neurosci. 2001;21:4809–4821. doi: 10.1523/JNEUROSCI.21-13-04809.2001. [DOI] [PMC free article] [PubMed] [Google Scholar]
- Durgin FH, Proffitt DR, Olson TJ, Reinke KS. Comparing depth from motion with depth from binocular disparity. J Exp Psychol Hum Percept Perform. 1995;21:679–699. doi: 10.1037/0096-1523.21.3.679. [DOI] [PubMed] [Google Scholar]
- Graf AB, Kohn A, Jazayeri M, Movshon JA. Decoding the activity of neuronal populations in macaque primary visual cortex. Nat Neurosci. 2011;14:239–245. doi: 10.1038/nn.2733. [DOI] [PMC free article] [PubMed] [Google Scholar]
- Green DM, Swets JA. Signal detection theory and psychophysics. New York: Wiley; 1966. [Google Scholar]
- Gu Y, Watkins PV, Angelaki DE, DeAngelis GC. Visual and nonvisual contributions to three-dimensional heading selectivity in the medial superior temporal area. J Neurosci. 2006;26:73–85. doi: 10.1523/JNEUROSCI.2356-05.2006. [DOI] [PMC free article] [PubMed] [Google Scholar]
- Gu Y, Angelaki DE, DeAngelis GC. Contribution of correlated noise and selective decoding to choice probability measurements in extrastriate visual cortex. eLife. 2014;3:e02670. doi: 10.7554/eLife.02670. [DOI] [PMC free article] [PubMed] [Google Scholar]
- Herrington TM, Masse NY, Hachmeh KJ, Smith JE, Assad JA, Cook EP. The effect of microsaccades on the correlation between neural activity and behavior in middle temporal, ventral intraparietal, and lateral intraparietal areas. J Neurosci. 2009;29:5793–5805. doi: 10.1523/JNEUROSCI.4412-08.2009. [DOI] [PMC free article] [PubMed] [Google Scholar]
- Howard IP, Rogers BJ. Binocular vision and stereopsis. New York: Oxford UP; 1995. [Google Scholar]
- Jazayeri M, Movshon JA. Optimal representation of sensory information by neural populations. Nat Neurosci. 2006;9:690–696. doi: 10.1038/nn1691. [DOI] [PubMed] [Google Scholar]
- Kang I, Maunsell JH. Potential confounds in estimating trial-to-trial correlations between neuronal response and behavior using choice probabilities. J Neurophysiol. 2012;108:3403–3415. doi: 10.1152/jn.00471.2012. [DOI] [PMC free article] [PubMed] [Google Scholar]
- Komatsu H, Wurtz RH. Relation of cortical areas MT and MST to pursuit eye movements. I. Localization and visual properties of neurons. J Neurophysiol. 1988;60:580–603. doi: 10.1152/jn.1988.60.2.580. [DOI] [PubMed] [Google Scholar]
- Krug K, Parker AJ. Neurons in dorsal visual area V5/MT signal relative disparity. J Neurosci. 2011;31:17892–17904. doi: 10.1523/JNEUROSCI.2658-11.2011. [DOI] [PMC free article] [PubMed] [Google Scholar]
- Liu J, Newsome WT. Correlation between speed perception and neural activity in the middle temporal visual area. J Neurosci. 2005;25:711–722. doi: 10.1523/JNEUROSCI.4034-04.2005. [DOI] [PMC free article] [PubMed] [Google Scholar]
- Liu S, Gu Y, DeAngelis GC, Angelaki DE. Choice-related activity and correlated noise in subcortical vestibular neurons. Nat Neurosci. 2013;16:89–97. doi: 10.1038/nn.3267. [DOI] [PMC free article] [PubMed] [Google Scholar]
- Matsumora T, Koida K, Komatsu H. Relationship between color discrimination and neural responses in the inferior temporal cortex of the monkey. J Neurophysiol. 2008;100:3361–3374. doi: 10.1152/jn.90551.2008. [DOI] [PubMed] [Google Scholar]
- Maunsell JH, Van Essen DC. Functional properties of neurons in middle temporal visual area of the macaque monkey. II. Binocular interactions and sensitivity to binocular disparity. J Neurophysiol. 1983;49:1148–1167. doi: 10.1152/jn.1983.49.5.1148. [DOI] [PubMed] [Google Scholar]
- Nadler JW, Angelaki DE, DeAngelis GC. A neural representation of depth from motion parallax in macaque visual cortex. Nature. 2008;452:642–645. doi: 10.1038/nature06814. [DOI] [PMC free article] [PubMed] [Google Scholar]
- Nadler JW, Nawrot M, Angelaki DE, DeAngelis GC. MT neurons combine visual motion with a smooth eye movement signal to code depth-sign from motion parallax. Neuron. 2009;63:523–532. doi: 10.1016/j.neuron.2009.07.029. [DOI] [PMC free article] [PubMed] [Google Scholar]
- Nadler JW, Barbash D, Kim HR, Shimpi S, Angelaki DE, DeAngelis GC. Joint representation of depth from motion parallax and binocular disparity cues in macaque area MT. J Neurosci. 2013;33:14061–14074. 14074a. doi: 10.1523/JNEUROSCI.0251-13.2013. [DOI] [PMC free article] [PubMed] [Google Scholar]
- Naji JJ, Freeman TC. Perceiving depth order during pursuit eye movement. Vision Res. 2004;44:3025–3034. doi: 10.1016/j.visres.2004.07.007. [DOI] [PubMed] [Google Scholar]
- Nawrot M. Eye movements provide the extra-retinal signal required for the perception of depth from motion parallax. Vision Res. 2003;43:1553–1562. doi: 10.1016/S0042-6989(03)00144-5. [DOI] [PubMed] [Google Scholar]
- Nawrot M, Joyce L. The pursuit theory of motion parallax. Vision Res. 2006;46:4709–4725. doi: 10.1016/j.visres.2006.07.006. [DOI] [PubMed] [Google Scholar]
- Nawrot M, Stroyan K. The motion/pursuit law for visual depth perception from motion parallax. Vision Res. 2009;49:1969–1978. doi: 10.1016/j.visres.2009.05.008. [DOI] [PMC free article] [PubMed] [Google Scholar]
- Neri P, Bridge H, Heeger DJ. Stereoscopic processing of absolute and relative disparity in human visual cortex. J Neurophysiol. 2004;92:1880–1891. doi: 10.1152/jn.01042.2003. [DOI] [PubMed] [Google Scholar]
- Nienborg H, Cumming BG. Macaque V2 neurons, but not V1 neurons, show choice-related activity. J Neurosci. 2006;26:9567–9578. doi: 10.1523/JNEUROSCI.2256-06.2006. [DOI] [PMC free article] [PubMed] [Google Scholar]
- Nover H, Anderson CH, DeAngelis GC. A logarithmic, scale-invariant representation of speed in macaque middle temporal area accounts for speed discrimination performance. J Neurosci. 2005;25:10049–10060. doi: 10.1523/JNEUROSCI.1661-05.2005. [DOI] [PMC free article] [PubMed] [Google Scholar]
- Ono ME, Rivest J, Ono H. Depth perception as a function of motion parallax and absolute-distance information. J Exp Psychol Hum Percept Perform. 1986;12:331–337. doi: 10.1037/0096-1523.12.3.331. [DOI] [PubMed] [Google Scholar]
- Paradiso MA. A theory for the use of visual orientation information which exploits the columnar structure of striate cortex. Biol Cybern. 1988;58:35–49. doi: 10.1007/BF00363954. [DOI] [PubMed] [Google Scholar]
- Parker AJ. Binocular depth perception and the cerebral cortex. Nat Rev Neurosci. 2007;8:379–391. doi: 10.1038/nrn2131. [DOI] [PubMed] [Google Scholar]
- Purushothaman G, Bradley DC. Neural population code for fine perceptual decisions in area MT. Nat Neurosci. 2005;8:99–106. doi: 10.1038/nn1373. [DOI] [PubMed] [Google Scholar]
- Rogers B, Graham M. Motion parallax as an independent cue for depth perception. Perception. 1979;8:125–134. doi: 10.1068/p080125. [DOI] [PubMed] [Google Scholar]
- Schiller PH, Slocum WM, Jao B, Weiner VS. The integration of disparity, shading and motion parallax cues for depth perception in humans and monkeys. Brain Res. 2011;1377:67–77. doi: 10.1016/j.brainres.2011.01.003. [DOI] [PMC free article] [PubMed] [Google Scholar]
- Shadlen MN, Britten KH, Newsome WT, Movshon JA. A computational analysis of the relationship between neuronal and behavioral responses to visual motion. J Neurosci. 1996;16:1486–1510. doi: 10.1523/JNEUROSCI.16-04-01486.1996. [DOI] [PMC free article] [PubMed] [Google Scholar]
- Shiozaki HM, Tanabe S, Doi T, Fujita I. Neural activity in cortical area V4 underlies fine disparity discrimination. J Neurosci. 2012;32:3830–3841. doi: 10.1523/JNEUROSCI.5083-11.2012. [DOI] [PMC free article] [PubMed] [Google Scholar]
- Thomas OM, Cumming BG, Parker AJ. A specialization for relative disparity in V2. Nat Neurosci. 2002;5:472–478. doi: 10.1038/nn837. [DOI] [PubMed] [Google Scholar]
- Tsao DY, Vanduffel W, Sasaki Y, Fize D, Knutsen TA, Mandeville JB, Wald LL, Dale AM, Rosen BR, Van Essen DC, Livingstone MS, Orban GA, Tootell RB. Stereopsis activates V3A and caudal intraparietal areas in macaques and humans. Neuron. 2003;39:555–568. doi: 10.1016/S0896-6273(03)00459-8. [DOI] [PubMed] [Google Scholar]
- Uka T, DeAngelis GC. Contribution of middle temporal area to coarse depth discrimination: comparison of neuronal and psychophysical sensitivity. J Neurosci. 2003;23:3515–3530. doi: 10.1523/JNEUROSCI.23-08-03515.2003. [DOI] [PMC free article] [PubMed] [Google Scholar]
- Uka T, DeAngelis GC. Contribution of area MT to stereoscopic depth perception: choice-related response modulations reflect task strategy. Neuron. 2004;42:297–310. doi: 10.1016/S0896-6273(04)00186-2. [DOI] [PubMed] [Google Scholar]
- Uka T, DeAngelis GC. Linking neural representation to function in stereoscopic depth perception: roles of the middle temporal area in coarse versus fine disparity discrimination. J Neurosci. 2006;26:6791–6802. doi: 10.1523/JNEUROSCI.5435-05.2006. [DOI] [PMC free article] [PubMed] [Google Scholar]
- Umeda K, Tanabe S, Fujita I. Representation of stereoscopic depth based on relative disparity in macaque area V4. J Neurophysiol. 2007;98:241–252. doi: 10.1152/jn.01336.2006. [DOI] [PubMed] [Google Scholar]
- Van Essen DC, Drury HA, Dickson J, Harwell J, Hanlon D, Anderson CH. An integrated software suite for surface-based analyses of cerebral cortex. J Am Med Inform Assoc. 2001;8:443–459. doi: 10.1136/jamia.2001.0080443. [DOI] [PMC free article] [PubMed] [Google Scholar]
- Wallach H. Perceiving a stable environment when one moves. Annu Rev Psychol. 1987;38:1–27. doi: 10.1146/annurev.ps.38.020187.000245. [DOI] [PubMed] [Google Scholar]
- Zhang Y, Schiller PH. The effect of overall stimulus velocity on motion parallax. Vis Neurosci. 2008;25:3–15. doi: 10.1017/S0952523808080012. [DOI] [PubMed] [Google Scholar]