

Abstract
The functional architecture of adult cerebral cortex retains a capacity for experience-dependent change. This is seen after focal binocular lesions as rapid changes in receptive field (RF) of the lesion projection zone (LPZ) in the primary visual cortex (V1). To study the dynamics of the circuitry underlying these changes longitudinally, we implanted microelectrode arrays in macaque (Macaca mulatta) V1, eliminating the possibility of sampling bias, which was a concern in previous studies. With this method, we observed a rapid initial recovery in the LPZ and, during the following weeks, 63–89% of the sites in the LPZ showed recovery of visual responses with significant position tuning. The RFs shifted ∼3° away from the scotoma. In the absence of a lesion, visual stimulation surrounding an artificial scotoma did not elicit visual responses, suggesting that the postlesion RF shifts resulted from cortical reorganization. Interestingly, although both spikes and LFPs gave consistent prelesion position tuning, only spikes reflected the postlesion remapping.
Keywords: cortical plasticity, experience-dependent plasticity, primary visual cortex, retinal lesions, topographic remapping
Introduction
The adult cortex adapts to alterations in sensory experience (Gilbert and Li, 2012). Such experience-dependent plasticity in the sensory cortex is associated with perceptual learning (Crist et al., 2001; Schoups et al., 2001; Li et al., 2004, 2006) and functional adaptation to CNS damage. Experience-dependent reorganization of adult cortex has been documented in many sensory and motor cortical areas, including somatosensory cortex (Kalaska and Pomeranz, 1979; Merzenich et al., 1984; Calford and Tweedale, 1988; Clark et al., 1988; Cusick et al., 1990; Allard et al., 1991; Jones, 2000; Kaas et al., 2008; Chen et al., 2012), motor cortex (Sanes et al., 1988), auditory cortex (Robertson and Irvine, 1989; Schwaber et al., 1993; Mühlnickel et al., 1998), and visual cortex (Gilbert et al., 1990; Kaas et al., 1990; Heinen and Skavenski, 1991; Gilbert and Wiesel, 1992; Darian-Smith and Gilbert, 1994, 1995; Chino et al., 1995; Das and Gilbert, 1995; Schmid et al., 1996; Calford et al., 2000, 2003; Baker et al., 2005; Giannikopoulos and Eysel, 2006; Baker et al., 2008; Keck et al., 2008; Dilks et al., 2009; Masuda et al., 2008; Botelho et al., 2014). For the primary visual cortex (V1), when a circumscribed area of the cortex is functionally deafferented by focal binocular retinal lesions, this area, called the lesion projection zone (LPZ), is initially unresponsive to visual stimuli but over time regains visually driven activity.
The circuit underlying the reorganization is likely to involve the intrinsic long-range horizontal connections formed by the axons of cortical pyramidal cells. The extent of these connections matches the area of reorganization (Gilbert and Wiesel, 1979), and after the lesion they undergo sprouting and synaptogenesis (Darian-Smith and Gilbert, 1994; Yamahachi et al., 2009). Axonal sprouting could explain the recovery of visually driven activity of neurons inside the LPZ and the remapping of cortical topography occurring months after the lesion. Indeed, studies using two-photon microscopy and genetically engineered viruses that label targeted cell populations revealed a massive reorganization in the horizontal connections of excitatory neurons projecting into the LPZ and inhibitory cells located within the LPZ after sensory loss (Yamahachi et al., 2009; Marik et al., 2010; Marik et al., 2014).
The shifts of receptive fields (RFs) after focal binocular retinal lesions have been documented for time points immediately after the retinal lesion and at 2 months after lesion (Gilbert and Wiesel, 1992). To quantify the prevalence, extent, and time course of cortical reorganization, we used chronically implanted microarray electrodes for an unbiased approach to examine the LPZ and surrounding cortical topography. We designed an experimental approach that can systematically assess the return of visually driven activity to multiple cortical sites after retinal lesions, on a daily basis, and over an extended period of time.
Materials and Methods
Animal preparation and electrophysiology.
Four adult male macaques (Macaca mulatta) were used in this study. Retinal lesion experiments were conducted on Monkey 1 and 2, whereas Monkey 3 and 4 were only used for an experiment to measure V1 activity within an artificial scotoma. Each animal was implanted with a head post. After the animal learned to fixate a fixation point on the computer monitor, we implanted 2 6 × 8 arrays of microelectrodes (Blackrock Microsystems; impedance: 100–800 kΩ at 1 kHz; interelectrode spacing: 400 μm) on the opercular surface of the striate cortex in one hemisphere (see Fig. 1A). The length of the electrodes was ∼500 μm, allowing for recordings from the superficial layers. Neural signals were band-pass filtered (154–8.8k Hz for spikes and 0.7–300 Hz for LFPs) and recorded using a multichannel signal acquisition processor (Plexon). Multiunit activity was sorted manually immediately before daily data collection using the waveform template function of an online sorting program (Plexon) with the aid of an audio monitor. To compare RF sizes between single and multiunits (see Fig. 1F), an offline sorting algorithm [named single unit–multiunit (SUMU); see Tankus et al., 2009; Fried et al., 2011; Chen et al., 2014] was used to classify the recorded spike waveforms. This algorithm takes advantage of the fact that single units have less variation in their spike waveforms than those from multiunits and quantifies the amount of the variation (smaller SUMU values are exhibited by single units). Based on their SUMU distribution, the units with SUMU values that were <3.0 were defined as single units and the remaining signals were classified as multiunits (see Fig. 1F). All procedures were in accordance with the National Institutes of Health Guide for the Care and Use of Laboratory Animals and with the approval of the Institutional Animal Care and Use Committee at the Rockefeller University.
Figure 1.
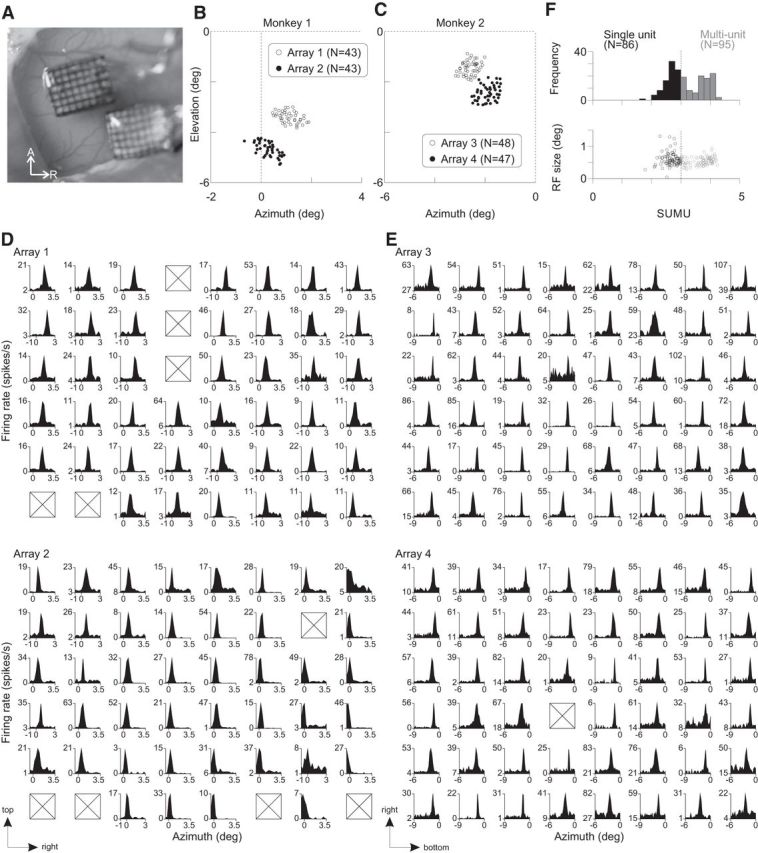
Implanted electrodes and RFs. A, Two implanted 6 × 8 microelectrode arrays in V1 of the right hemisphere of Monkey 2. A, Anterior; R, right. B, C, Centers of the receptive fields of prelesion V1 cells are shown for each animal. Each circle corresponds to the average RF center of each electrode across days. Dotted lines indicate horizontal and vertical meridians. For Monkey 1, the arrays were implanted in the left hemisphere. D, E, Azimuth position tuning. Each plot corresponds to each electrode of the arrays (D: Monkey 1, E: Monkey 2), showing the average firing rates (across trials) to an aperture of gratings as a function of its azimuth position. Black-filled tuning curves are statistically significant (1-way ANOVA with a factor of position, p < 0.05). The boxes indicate electrodes without spiking activity. The arrows at bottom left indicate the distribution directions of the prelesion RFs in the visual field. F, Unit classification and RF size. Top, Histogram showing SUMU values for the units presented in D and E. The distribution was bimodal (p = 0.001, Hartigan's dip test). Single units were defined as those with SUMU < 3.0. The rest were as multiunits. Bottom, Relationship between SUMU and RF size.
Retinal lesions.
Retinal lesions were made as described previously (Gilbert et al., 1990; Gilbert and Wiesel, 1992; Yamahachi et al., 2009). To guide the placement of the lesions, we used an audio monitor to check visually driven activity from electrodes of the implanted array while a guide light from the opthalamic laser (Iridex) was pointed at the retina. Once retinal lesions had been made in the appropriate locus, cortical cells within the LPZ immediately became unresponsive to visual stimulation. Typically, the diode laser delivered 300 mW for 800–1000 ms.
Stimulus and behavioral protocols.
Throughout a trial, the animal was required to maintain fixation within an invisible circular window (1° radius) centered on a 0.08° white fixation dot to obtain a liquid reward at the end of the trial. Visual stimuli were presented by a VSG2/5 stimulus generator (Cambridge Research Systems) and the experiment was controlled by a custom-made Windows program. Eye position was monitored by an infrared tracking system (Matsuda et al., 2000). To map the RFs of V1 cells, black and white square-wave drifting gratings (3 Hz, 3 cycles/degree; 100% Michelson contrast) were presented inside an aperture on a gray background. The aperture, with its size 0.3° ×10° (width × height) and 10°×0.3° for horizontal and vertical position mapping, respectively, pseudorandomly changed its position across trials over the clusters of RFs being recorded. After the lesion, a smaller aperture (typically 0.3°×1.5–4°) was also used to map the RF location more accurately by reducing possible contextual interaction. If a recording site had a significant orientation tuning (p < 0.05, ANOVA), the orientation of the small aperture was matched to the preferred orientation for a more accurate measure of the RF position. The orientation preference was determined by using a circular patch of drifting gratings (10° diameter; 3 Hz, 3 cycles/degree) before the lesion, and an optimally oriented small aperture (0.3°×1.5–4°) after the lesion. Nine equally spaced grating orientations between 0° and 180° were used. Each stimulus condition was tested 5–30 times. For natural scene stimulation, we used a database of 4000 uncompressed black and white pictures (van Hateren and van der Schaaf, 1998). One picture was randomly chosen for each trial. The visual stimuli were presented for 600 ms, except for the grating stimuli to Monkey 1 (1000 ms was used).
Behavioral examination of visual scotoma.
While the animal was fixating at a central white dot (0.08° diameter; 81% Michelson contrast), a green dot (0.15° and 0.3° diameter for Monkey 1 and 2, respectively; 81% contrast) was presented as a target after a uniformly random delay of 391–1346 ms. The target appeared at a random location within an annular zone centered on the fixation point. This annular zone had an inner radius of 1° and an outer radius of 10° for Monkey 1 and of 5° or 8° for Monkey 2. A trial was defined as a hit and was rewarded if the animal made an eye movement into a 1.5° circular region around the target within 600 ms; if the animal did not make any saccadic eye movement within this time window, a trial was regarded as a miss; the other cases were excluded from further analysis. During a trial, the central white dot remained on the screen so that it did not give any information about the timing of the saccadic target. To determine the area of visual scotoma, a miss rate [Nmiss/(Nmiss + Ncorrect)] was calculated for each nonoverlapping small visual field area (0.5°×0.5° and 0.2°×0.2° for Monkey 1 and 2, respectively). A 2D map was constructed based on the miss rates at each visual field location, which was then smoothened by a 2D Gaussian filter (SD = 0.5° and 0.2° for Monkey 1 and 2, respectively). The area where the miss rate was >50% in the map was estimated using a MATLAB function (contour.m).
Data analysis.
All the analyses were performed using MATLAB. RF position was tested by ANOVA and considered significant if the p-value was <0.05. Tuning curves were created by calculating the average firing rates during the entire period of visual stimulation for each tested condition. The optimal RF position was determined by Gaussian fitting of the tuning curve. A recording site was considered having a reliable RF only if both the azimuth and elevation position tuning were significant. The LFP signals during visual stimulation were analyzed by discrete Fourier transform and their power in the gamma range (30–80 Hz) was calculated. For all peristimulus time histograms (PSTHs), the baseline activity (average of 100 ms period before visual stimulus onset) was subtracted, except Figure 3, B and C, for which baseline and visually driven activities were compared. Comparisons of the position tuning between prelesion and postlesion spike signals and between postlesion spike and LFP signals were conducted only for the sites with a good Gaussian fit, which was defined by the sum of squared residual of the fit being <300; to accommodate differences in firing rates between electrodes and those in numbers of tested positions between recordings, the range of firing rate (and LFP power) was normalized to be 100 and the sum of squared residual was divided by the number of the tested positions (because the residual would be larger if the data were bigger). How this residual corresponds to the actual fit to the tuning curves can be seen in Figure 7. The stability of postlesion RF positions (Fig. 8) was estimated from azimuth position tuning experiments, which used the same stimuli in both prelesion and postlesion. This analysis was conducted with electrodes (n = 39, 13, 18, and 4 electrodes for arrays 1–4, respectively) that had significant azimuth position tuning (p < 0.05, ANOVA) with good Gaussian fit (see above) in at least 3 recording sessions ranging from the postlesion first to 13th (Monkey 1) or 10th week (Monkey 2).
Figure 3.

Visual stimulation with an artificial scotoma in normal animals. A, D, Examples of visual stimulation using grating aperture (A) and natural scene (D) stimuli with an occluder. A gray filled circle (2.5° radius, same luminance as background) was positioned at a single or multiple locations in the visual field. The dotted circle in A indicates that the occluder was invisible and is shown for an illustrative purpose. B, Average PSTHs across electrodes in Monkey 2 when a grating aperture (10° × 0.3°, height × width) with upward drifting gratings (3 cycles per degree, 3 Hz) was presented with (red) or without (black) the occluder. Before averaging across the electrodes, the PSTHs were computed for each electrode from the trials where the grating aperture was presented at the preferred location, which was determined from the position tuning curve when the occluder was absent. Shown in left are the RF centers of the recorded V1 sites (black dots) and the occluder location (red dotted circle) relative to the animal's fixation spot (top right corner). One tick on the axes is one degree. C, Same as in B except that each of the two implanted arrays was tested separately by centering the occluder on either of the two RF clusters (red and blue) when testing under the occluded condition. This experiment was done on Monkey 3. E, F, Average PSTHs to natural scene stimuli with or without an occluder obtained from Monkey 2 (E) and Monkey 4 (F). In these experiments, the occluder was placed at several locations. The PSTHs were computed for each electrode and for each occluder location and averaged separately depending on the distance (d) between the RF and occluder centers. OUT and IN indicate the groups of RFs outside or inside of the occluder, respectively. The average activity during a 100 ms period before stimulus onset was subtracted. The PSTHs were smoothened by applying a Gaussian kernel (SD = 20 ms). Shade indicates ±1 SEM.
Figure 7.
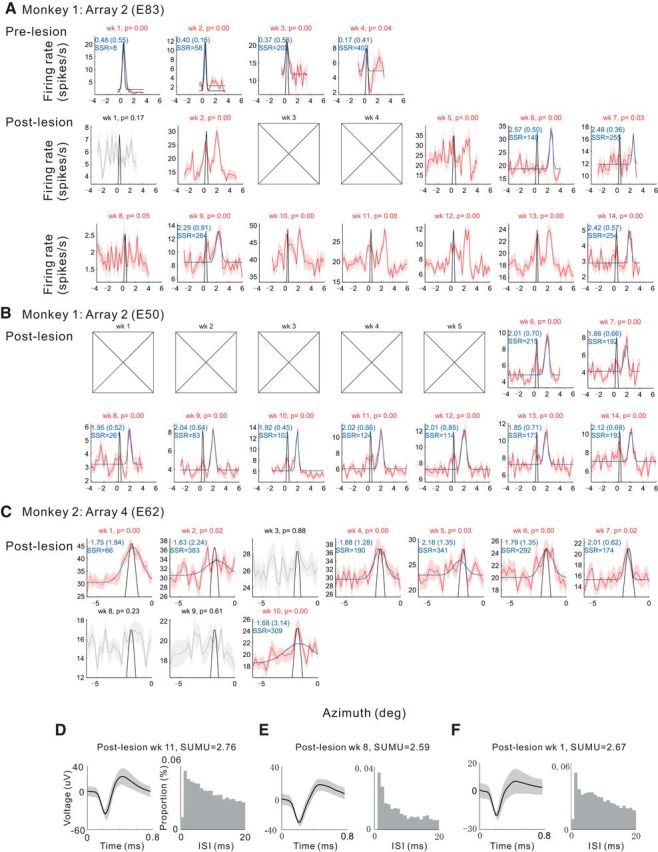
Postlesion position tuning showing stability of RF position after recovery. Azimuth position tuning curves are shown for individual weeks for three sample V1 sites (A–C, respectively) within LPZ. The recorded week and p-value from 1-way ANOVA with a factor of position are shown at the top of each panel. The red and gray curves indicate the tuning curves (mean across trials) with the color indicating its statistical significance of the ANOVA (red if p < 0.05, gray otherwise). The shading indicates ±1 SEM. The blue curves indicate Gaussian functions fitted to the tuning curves with four parameters corresponding mean, SD, amplitude, and offset. The black curves show the average Gaussian functions fitted to the prelesion tuning curves (Gaussian mean and SD were averaged across days), with its peak matched to each tuning curve by changing the amplitude and offset proportionally. The numbers in blue in each panel (except for the data having obvious bimodal peaks) indicate the center and FWHM (in parentheses) of the fitted Gaussian function and the sum of squared residual (SSR) of the fit after normalizing the range of the data to 100 and dividing by the number of fit points; smaller value corresponds to better fit. The boxes with X's indicate the absence of spiking activity. D–F, Examples of spike waveforms (left; mean ± SEM) and interspike interval histograms (right; 1 ms bin) with SUMU values (top) recorded in postlesion 11th, eighth, and first week for the same V1 sites shown in A–C, respectively.
Figure 8.

Stability of the postlesion position tuning. A, Histogram showing the SDs of postlesion azimuth position tuning. Medians are indicated by the triangles for each array. B, Azimuth position tuning as a function of postlesion time elapsed. The dots indicate azimuth position tuning estimated in each measurement. The lines are linear regression fit to the measurements for each electrode. The color of the lines indicates statistical significance of the correlation between azimuth position and time elapsed (red: p < 0.05, gray: N.S.). Only electrodes that had significant azimuth position tuning across 3 weeks or more are included in A and B (p < 0.05, ANOVA).
Results
To measure the stability in RF size and position at identical cortical sites, we monitored neurons recorded with the electrode arrays for a period of time before making retinal lesions in Monkey 1 and 2. The RFs were located in lower visual field and, for the two arrays, were distributed into two distinct clusters (Fig. 1B,C). The average RF size, estimated as full-width-half-maximum (FWHM) of a Gaussian fit to a position tuning curve (Fig. 1D,E) was ∼0.5° in diameter (0.56 ± 0.01°, mean ± SEM), in agreement with previous studies examining superficial layers of macaque V1 at similar eccentricities in the visual field (Crist et al., 2001; Chen et al., 2014). In this and subsequent results, we analyzed both single and multiunit recordings. Single units were characterized by SUMU analysis (Tankus et al., 2009; Fried et al., 2011; Chen et al., 2014), which takes into account variation of spike waveforms. Using a criterion SUMU maximum value of 3.0, we were able to include 86 single units to establish baseline values of RF size and position, as well as 95 multiunit recordings. The RF size was not significantly different between single and multiunits (p = 0.06, two-sided t test; single-unit: 0.590 ± 0.02°, n = 86; multiunit: 0.542 ± 0.01°, n = 95), indicating the lack of scatter in RF position at each recording site. The similarity between multiunit and single unit data indicated that there was little RF scatter caused by signal isolation itself; therefore, we pooled the data. The mapped RF locations were stable for the period between the implantation of the array and the placement of the lesion, which was 5 weeks for Monkey 1 and 3 weeks for Monkey 2 (Fig. 2). For each electrode, the variation in RF location measured at multiple time points over this period was quantified as SDs separately for the azimuth and elevation (Fig. 2A). The median SD of RF position was 0.04–0.07° (Fig. 2B,C), indicating high stability in measured RF position over extended periods of time.
Figure 2.
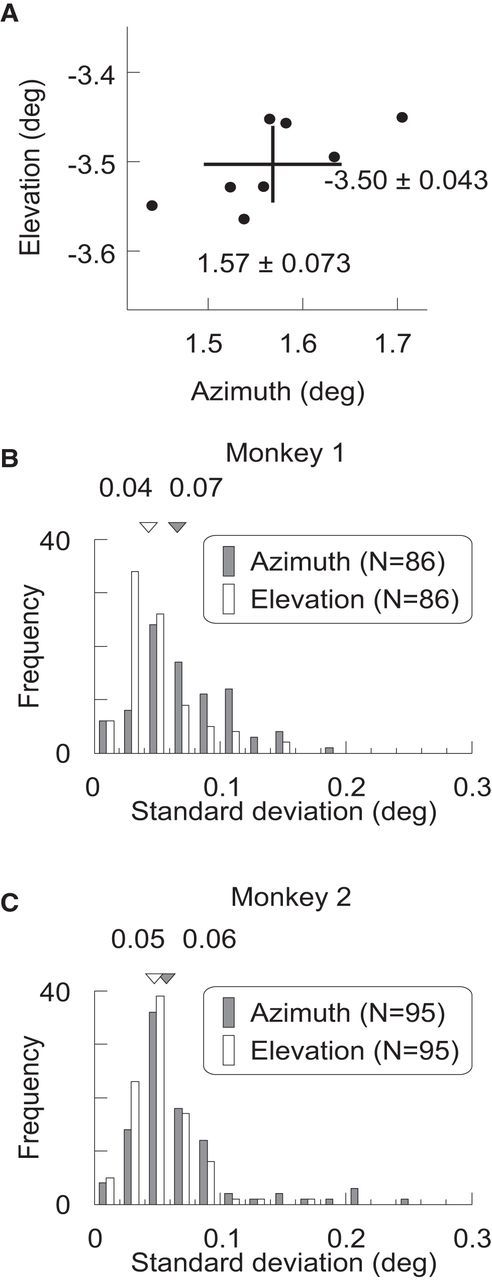
Stability of prelesion RF locations. A, Stability of RF location of a single electrode across days. Each dot indicates the RF center of an electrode from Monkey 1 examined on a particular day. The cross indicates the average location and ±1 SD for azimuth and elevation. B, C, Distributions of the SDs of the RF locations for individual electrodes across weeks of recordings. The medians of the distributions were indicated by the triangles and the numbers at top.
To assess the baseline extra-RF influences before making retinal lesions, we measured the responses of neurons to visual stimuli when a portion of the visual field including the RFs was occluded acutely. The stimuli included gratings and natural scenes within which a gray occluder overlapping with the neurons' RFs obscured a portion of the stimulus (Fig. 3A,D). This gives a sense of the distance from the RF center where different kinds of stimuli can activate the neurons and allows one to differentiate between preexisting lateral inputs and those involving reorganization. In the absence of an occluder, V1 neurons were strongly activated when a drifting grating was presented at their preferred locations. For example, in Monkey 2, the average firing rate of the recording sites during 1000 ms of visual stimulation period was 61.0 ± 3.2 spikes/s (mean ± SEM), whereas the average firing rate during the preceding 100 ms presentation of a uniform gray field was 17.4 ± 1.6 spikes/s (Fig. 3B, gray curve before time 0). The firing rates were significantly different (p = 5.8 × 10⁻²², Mann–Whitney U test, n = 90). We then measured the responses of neurons when we placed an occluder consisting of a gray circular patch (2.5° radius), with luminance matched to the background, centered on the RF locations. When this artificial scotoma was present, the drifting grating produced no significant change in activity above spontaneous levels (Fig. 3B, red curve; 19.1 ± 1.9 spikes/s stimulating with the grating surrounding the occluder vs 17.7 ± 1.6 spikes/s with a uniform gray field; p = 0.87). We repeated this analysis in the same animal after placing a retinal lesion (see below). In addition, we obtained results in one nonlesioned animal (Monkey 3, Fig. 3C) to confirm the absence of responses when the RF is placed within the occluder (18.4 ± 2.0 spikes/s grating with occluder vs 21.5 ± 1.9 spikes/s with the uniform gray field; p = 0.20, n = 44).
The definition of the RF, and the measure of its extent, is dependent on the stimulus used. A simple stimulus such as short oriented line segment or a grating patch gives a measure referred to as the minimum response field. Beyond that region, there are modulatory effects that influence a neuron's response, but cannot by themselves activate the neuron above threshold. However, certain stimuli with multiple components or extended contours flanking the RF could activate a neuron. Such interactions may mediate perceptual fill-in. One may ask whether more naturalistic stimuli with rich stimulus context could activate a neuron even when its minimum response field is contained within an occluder. To test this idea, we examined the responses of neurons to natural scene images as an occluder was placed in different positions relative to the RF (Fig. 3D–F). For Monkey 2 and another nonlesioned animal (Monkey 4), the evoked activity (the average firing rates during the 600 ms period of stimulation subtracted by those during 100 ms preceding the stimulation) was highly dependent on the position of the RF within the occluder (Figure 3E: p = 4.16 × 10⁻³⁴, F(6,317) = 37.3, ANOVA; Figure 3F: p = 1.22 × 10⁻¹³, F(5,132) = 18.1). When the occluder covered the RFs the firing rates were significantly reduced (p < 0.05, Tukey's HSD test). Notably, when the RFs were centered within the occluder, the responses were not significantly different from the baseline.
Having established the degree to which neurons can be activated when their RFs are placed acutely within an occluded region of the visual field, we next turned to monitor the changes in RF position and size during chronic conditions of local functional deafferentation. We made binocular retinal lesions at corresponding retinotopic locations in the two eyes. A postmortem examination of Monkey 2 revealed that, within the lesion, the retinal photoreceptor layer was confirmed to be destroyed. The retinal ganglion cell layer was intact toward the periphery of the lesion, but was destroyed toward the center (Fig. 4A). The extent of the lesion was initially mapped by back-projecting retinal landmarks and points along the lesion boundary through a fundus camera. On subsequent days, we made a more precise map of the lesion by having the animals perform a behavioral test (see Materials and Methods), which revealed a clear visual scotoma in each monkey (Fig. 4B,C). The visual scotomas were oval in shape and their sizes were ∼6° by 4°. As shall be seen later, array 2 in Monkey 1 and array 4 in Monkey 2 were well inside the LPZ, array 1 in Monkey 1 was immediately outside the LPZ boundary, and array 3 in Monkey 2 was just inside the LPZ boundary. These placements provided internal controls when examining the visual activity in the LPZ over time.
Figure 4.
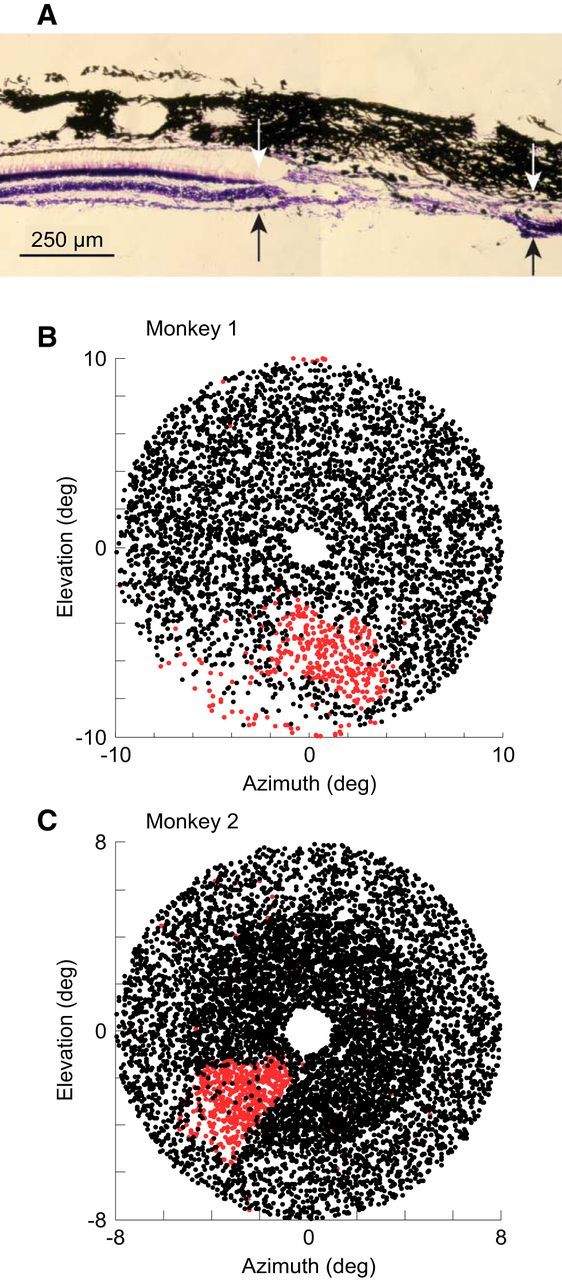
Retinal lesion and visual scotoma. A, Cross-section of retina showing the lesion (Monkey 2). The lesion extends between the arrows, which indicate the boundary between the intact photoreceptor layer and the lesioned zone. Within the lesion, a portion of the retinal ganglion cell layer is intact, but is destroyed toward the center of the lesion. The thick black tissue on top is the choroid and one can see photoreceptor outer segments extending between the outer nuclear layer and the choroid. B, C, Visual scotomata in Monkey 1 (B; n = 4623) and Monkey 2 (C; n = 24352) revealed by a behavioral test. The dots indicate the target locations where the animals made correct eye movements (black) and failed to respond (red), respectively.
Recordings were made on a daily basis after the placement of the lesions. When neurons could be activated by visual stimuli, we determined the RF positions along the horizontal axis (azimuth position, Fig. 5). For the arrays centered in the LPZ, 89% (34/38; array 2 in Monkey 1) and 63% (25/40; array 4 in Monkey 2) of the electrodes had visually driven responses with significant azimuth position tuning (p < 0.05, ANOVA). Similarly, for the array in peri-LPZ and that on LPZ boundary, 100% (39/39; array 1 in Monkey 1) and 89% (41/46; array 3 in Monkey 2) of the electrodes, respectively, had significant azimuth position tuning. Using the SUMU index (see Materials and Methods), most of the postlesion units with significant position tuning were classified as single units (39/39, 29/34, 41/41, and 25/25 for arrays 1–4, respectively). We compared RF sizes prelesion and postlesion (cf. Fig. 1D,E, Fig. 5) for recordings sites with a good Gaussian fit (see Materials and Methods). The same grating stimulus was used for RF mapping and thus permitted a direct comparison. The postlesion RF sizes were approximately doubled (median, prelesion vs postlesion: 0.50 vs 1.03, 0.53 vs 2.11, 0.63 vs 0.93, and 0.58 vs 1.15 for arrays 1–4 respectively; p < 10−12, p < 10−5, p < 10−6, and p = 0.14, Mann–Whitney U test, n = 37, 19, 34, and 10). We also compared the prelesion and postlesion orientation tuning for those units with significant tuning curves (p < 0.05, ANOVA) and with RF shifted by >1° (arrays 2 and 4). This included eight recording sites. The preferred orientations were similar at prelesion and postlesion RF locations. The changes in the preferred orientations were 5.0 ± 12.7° (mean ± SEM), which were not statistically different from zero (p = 0.72, two-sided t test). These results suggest that, after the lesion and subsequent recovery of visually driven activity, RFs maintained their original orientation preference. In addition, the tuning width measured as the SD of fitted Gaussian was unchanged. They were 22.5 ± 2.7° (prelesion) and 21.7 ± 4.7° (postlesion), which were not significantly different (p = 0.90, two-sided paired t test).
Figure 5.

Postlesion azimuth position tuning. A, B, Same format as in Figure 1, D and E, but for postlesion. The boxes indicate electrodes without spiking activity; the single traces indicate that the tuning curve was not statistically significant (ANOVA, p > 0.05). These activities were recorded 8–13 weeks (arrays 1 and 2) or 5–10 weeks (arrays 3 and 4) after the lesion.
In addition to azimuth position tuning, we measured the elevation position tuning of recording sites and tested the statistical significance with ANOVA (p < 0.05). For neurons located within the LPZ, their RFs shifted to visual field positions above and below the LPZ (Fig. 6). The average extent of the shift was 3.79 ± 0.17° and 2.03 ± 0.18° for array 2 in Monkey 1 and array 4 in Monkey 2, respectively. Importantly, for each animal, the extents of these postlesion shifts were significantly larger than the prelesion session-by-session fluctuations (SD) of the RF positions at the same V1 sites (p < 10−15 and p < 10−7 for Monkey 1 and 2, respectively, paired t tests; Figs. 2, 6; for prelesion, the SD in radial distance from the mean position was calculated for each site). Some of the recording sites had two RFs located on either side of the LPZ, as reported in previous studies (Gilbert and Wiesel, 1992; Calford et al., 2000), regardless of single or multiunits. This is also evident in azimuth position tuning (Figs. 5, 7) in which some electrodes from array 2 had clear bimodal peaks. Therefore, the great majority of neurons originally located within the LPZ shifted their RFs to positions outside the LPZ. One of the shifted RFs from array 4 still resided in the LPZ, which is likely due to a small region that was spared by the lesion, as reflected in the behavioral mapping (Fig. 4C). The size of the RF shifts were smaller for array 3 in Monkey 2 located just inside the LPZ boundary (average shift: 0.52 ± 0.04°; Fig. 6B) than for array 2 in Monkey 1 and array 4 in Monkey 2 located at the LPZ center (p = 5.3 × 10⁻¹², Mann–Whitney U test). The RFs of the array located immediately outside of the LPZ (array 1 in Monkey 1) showed a small shift toward the LPZ (average shift: 0.37 ± 0.02; Fig. 6A), which may reflect retinal contraction due to the lesion. Alternatively, the shift of RFs to locations just within scotoma boundary (array 1) may be accounted for by short distance migration of photoreceptors into the lesion (Sher et al., 2013). As a consequence, the outward shifts seen in the other arrays may represent an underestimate of the degree of the actual magnitude of RF shifts and of the degree of cortical reorganization.
Figure 6.

The shifts of the RF positions. A, B, Pale and vivid color dots indicate the prelesion and postlesion RF locations, respectively, in Monkey 1 (A) and Monkey 2 (B) with the lines connecting the RF locations of the same electrodes. Shown are only electrodes from which spiking activity could be recorded 1–3 months after the lesion. The black curves encompass the area where the animals failed to make a saccade to a small target in ≥50% of the trials revealed by the behavioral tests (Fig. 4B,C). The broken lines indicate horizontal and vertical meridians. pre, Prelesion; post, postlesion.
To examine the nature of the RF shifts, we studied the dynamics of the postlesion RFs. The postlesion RF positions were stable as in prelesion experiments (Fig. 7) over the period of postlesion recording (up to 13 weeks, median of SD: 0.08°, 0.11°, 0.08° and 0.08° for array 1–4; Fig. 8A) and remained in the same shifted positions once visually driven activity returned, even though the postlesion RFs sometimes appeared and disappeared during the period of recovery (Fig. 7). We found no relationship between the time elapsed postlesion and the position of the shifted RFs in any of the arrays (Fig. 8B). Among the sites with significant azimuth position tuning across 3 weeks or more (n = 74), only 6 sites had significant correlation between the time elapsed and the shifted positions (p < 0.05). This number was not significantly different from that expected by chance (p = 0.17, binomial test).
Before making the lesion, for the 600 ms period of natural scene stimulation, neurons responded with an initial transient burst of activity that rapidly peaked within 100 ms after stimulus onset, followed by a gradual decay (Fig. 9A, left column). For Monkey 1 (with array 1 just outside the LPZ boundary and array 2 inside the LPZ), after the retinal lesion, the PSTHs of V1 neurons showed a distinct time course: the initial transient activity largely diminished in the first and second weeks after the lesion and the delayed component was stable (Fig. 9A, right column). For neurons in the LPZ (array 2 in Fig. 9A), the delayed component largely disappeared by the third and fourth weeks, then recovered over the subsequent weeks, but left the initial transient activity still greatly reduced. For neurons located outside the LPZ boundary (array 1 in Fig. 9A), the delayed component also decreased to a minimum by the third and fourth weeks and then recovered and the initial transient activity recovered over time as well. For Monkey 2 (with arrays 3 just inside the LPZ boundary and array 4 well within the LPZ), the V1 activity peaked slightly later and showed a triphasic activity pattern different from the prelesion activity.
Figure 9.

Changes in time course of neuronal responses over recording period. A, Average PSTHs for natural scene stimulation, shown separately for each array (row) and for prelesion and postlesion (columns). The PSTHs were constructed and color-coded for groups of electrodes according to the recording period after array implantation or the retinal lesion. All functional electrodes were analyzed. The PSTHs were smoothened by applying a Gaussian kernel (SD = 20 ms). Shade indicates ±1 SEM. Baseline activity (averaged during a prior 100 ms period) was subtracted. B, Average PSTHs for grating stimulation. A grating drifting vertically within an aperture (10° × 3°; height × width) was presented at each recording site's preferred azimuth position. Only electrodes that had activity significantly modulated by grating positions (p < 0.05, ANOVA) were included.
Similar recovery patterns were seen in response to the grating stimulus. For the neurons in the LPZ of Monkey 1 (array 2 in Fig. 9B), the initial transient activity was clearly seen before making the lesion, but it was lost after the lesion. Instead, there was a delayed activity after stimulus onset, which gradually diminished and was almost lost at 7 and 8 weeks postlesion, emerged again at 9 and 10 weeks, and was maintained afterward. For the neurons located at peri-LPZ (array 1 in Fig. 9B), the initial transient response was retained. But even here, the activity markedly fluctuated during the recovery, similar to those neurons in the LPZ. For Monkey 2 (with arrays 3 and 4 within the LPZ), the population PSTHs from both arrays showed reduced delayed components compared with the prelesion activity; the fluctuation of the PSTH across weeks was also increased.
After the lesion, LFP signals also showed marked changes. A drifting grating stimulus evoked an initial transient negative peak (∼50 ms) before making the lesion (Fig. 10A), whereas it was lost or largely diminished after the retinal lesion in arrays that were located within the LPZ (arrays 2, 3, and 4 in Fig. 10B). Conversely, the delayed positive and negative components were still present, but diminished. Importantly, the relationship between spiking activity and LFP signals changed. This was evident in the position tuning of these signals. The azimuth position tuning curves of spikes and LFP signals recorded from an identical electrode are shown in Figure 10C. Before making the retinal lesions, there was a close correspondence between the positional tuning of spikes and of gamma band (30–80 Hz) activity of LFP signals. However, this correspondence was largely lost after the lesion, as seen in the correlation coefficient between the spike and LFP tuning curves. The correlation coefficient for the example shown was 0.75 prelesion (p < 10−3) and 0.15 postlesion (p > 0.3). We calculated correlation coefficients between the spike and LFP tuning curves for each electrode in each recording session. Figure 10D shows the histogram of the correlation coefficients for the population of recording sites over time. As with the example site, before the lesion, LFP tuning curves were highly correlated with the spike tuning curves (median r: 0.90, 0.79, 0.71, and 0.53 for arrays 1–4, respectively). The postlesion correlations became substantially weaker (median r: 0.65, 0.19, 0.25, and 0.20; significantly smaller than prelesion values, p = 1.3 × 10−49, 3.0 × 10−95, 3.5 × 10−71, and 9.2 × 10−49, Kormogolv–Smirnov test), with a prominent reduction in LPZ (arrays 2–4). The decreased correlations between spike- and LFP-based position tuning curves were mainly due to a loss of tuning in the postlesion LFP signals. For the V1 sites that had significant position tuning both in spike and LFP signals (p < 0.05, ANOVA; Fig. 5), we compared Gaussian function fitting with the tuning curves. The tuning curve was significantly broader in the LFP signals in the arrays 2 and 4 located well within LPZ (p = 0.11, p < 0.001, p = 0.09, p < 0.01 for arrays 1–4, respectively, Mann–Whitney U test; FWHM in degree, spike vs LFP: 1.03 vs 0.85, 1.35 vs 3.35, 0.93 vs 1.56, and 1.15 vs 2.09; n = 39, 21, 34, and 10 for spike; n = 37, 14, 4, and 21 for LFP).
Figure 10.

LFP and its relation to spike tuning. A, B, LFP time course to grating stimulation. For each electrode, the average LFP time courses were calculated from the trials where a vertical drifting grating (10°×3°; height × width) was presented at the preferred position, which was determined by the spike tuning curve. Shown are the grand average LFP time courses across electrodes, calculated for each group of weeks after array implantation (A: prelesion) and after the retinal lesion (B: postlesion). C, Examples of spike and LFP tuning curves of a single electrode. The average firing rate and LFP power in the gamma range (30–80 Hz) are presented as a function of grating position in a recording session before (top) and after (bottom) making the retinal lesion. Correlation coefficients between the spike and LFP (gamma) tuning curves are also presented. D, Histograms showing the distribution of correlation coefficients between the spike and LFP (gamma) tuning curves recorded from the same electrodes in all the azimuth position mapping experiments. The open and filled bars indicate prelesion and postlesion data, respectively. The medians are indicated by the triangles and the numbers at top.
Discussion
Using chronically implanted electrode arrays, we were able to provide a quantitative and longitudinal measure of the functional recovery in the cortical LPZ after retinal lesions. The great majority of sites within the LPZ showed recovery of visually driven responses, indicating the extent, prevalence, and robustness of the recovery. One concern about the previous studies using extracellular recording was the possibility of sampling bias toward a subpopulation of neurons with RFs outside the lesioned area (Smirnakis et al., 2005). Here, there was no such sampling bias because we used implanted microelectrode arrays and the extent of reorganization within the LPZ was consistent with previous studies. In addition, the placement of the electrode arrays allowed us to establish internal controls and to differentiate effects occurring at V1 sites recorded in the peri-LPZ, those located just inside the LPZ boundary, and those more centrally located within the LPZ (Figs. 4, 6). The boundaries of the lesions, and their cortical representations, were established by combining behavioral mapping of the scotoma and prelesion and postlesion array recordings. The lack of scatter of RF position measured before the lesion and the absence of responses when RFs are placed acutely within an occluder demonstrate that the large RF shifts resulting from the lesion represent genuine plasticity. Further, the visually driven activity observed after recovery could not be attributed to the survival of a small number of V1 cells with very large RFs because the limit of RF size measured from single and multiunit activity is too small to account for the observed RF shifts in the LPZ.
Another intriguing aspect of our findings is the time course of recovery. Within the first week after the lesion, there is a transient recovery of visually driven activity in the LPZ, followed by a period of a decrease in activity lasting a few weeks and then a return to visual responses with clearly shifted RFs. By the final time point, 2–3 months after the lesion, 60–90% of the sites had significant position tuning. The time course of the PSTHs also showed a distinct signature in which the recovery was seen in the delayed component of the visual responses and the early component only returned for sites near the LPZ boundary. This is reminiscent of the time course of contextual influences seen in normal visual cortex, where responses related to extended contours and texture discontinuities emerge with a delay after the initial visual response (Lamme, 1995; Roelfsema et al., 1998; Li et al., 2001, 2006), suggesting that they may come from a common source. As for the stronger responses in the initial period of recovery, we speculate that these might arise from an altered excitatory/inhibitory balance within V1 circuits, which can affect contextual interactions (Ozeki et al., 2009; Piëch et al., 2013) as well as rapid changes in the axonal arbors of excitatory and inhibitory neurons. A two-photon in vivo study showed that a retinal lesion triggered, within the first week, an ∼2-fold outgrowth of axons toward the center of the LPZ in monkey V1, followed by a parallel process of pruning and sprouting, with a net increase relative to prelesion levels (Marik et al., 2010; Yamahachi et al., 2009).
Although the arrays are subject to limitations of the duration over which they provide recordable activity, we were able to make observations over ∼4–5 months after implantation. For the two arrays in the LPZ in both animals, 63–89% of the V1 sites showed recovery of visual responses, with significant azimuth position tuning after the lesion (Fig. 5). Within the time window allowed by the array recordings, we also identified their vertical position tuning, which, together with the azimuth measurements, enabled us to determine the magnitude and direction of shift in RF position induced by the lesion. About half of the V1 sites recorded from the functional electrodes located near the center of the LPZ (24/35 sites from array 2 in Monkey 1 and 16/33 sites from array 4 in Monkey 2) had shifted RFs (Fig. 6). The extent of such RF shifts was ∼3°. These were significantly larger than those of the V1 sites recorded from the array slightly inside the LPZ (∼0.5°; array 3).
The extent of the shifts in RF position is consonant with the extent of the horizontal connections. For array 3 in Monkey 2, which was located around the LPZ boundary, the observed mean shift was ∼0.5°. This might indicate that the recorded V1 sites received visual inputs from V1 sites ∼1.5 mm away, based on the V1 magnification factor (estimated as 2.9 mm/degree at the eccentricity of the array, ∼3°; Van Essen et al., 1984). This cortical distance is well within the spread of horizontal connections (∼4 mm in radius in normal V1, Stettler et al., 2002). However, for longer shifts, there may be multiple scenarios. For example, the upward RF shifts seen from array 2 in Monkey 1 were ∼4°. Using a similar calculation, the cortical distance between the prelesion RF location of a V1 site and its postlesion location would be >6.5 mm, given the magnification factor (1.62 mm/degree at 5° eccentricity) and that the magnification factor should be larger in the shifted RF locations at smaller eccentricities. This would suggest either that the reorganization is mediated by multiple nodes in the network of horizontal connections or that the area covered by the horizontal connections might enlarge.
After the retinal lesion, the initial transient activation in response to both natural scenes and to drifting gratings was lost in the LPZ (Fig. 9), likely reflecting the loss of direct visual input from the damaged part of the retina via feedforward interlaminar cortical connections. Because the horizontal connections in normal V1 tend to connect neurons with a similar orientation preference (Stettler et al., 2002), the preservation of orientation preference after retinal lesions seen here and previously (Das and Gilbert, 1995; Calford et al., 2000) suggests again the involvement of layer 2/3 horizontal connections in cortical reorganization in V1. Computational simulations show that V1 reorganization mediated by horizontal connections can engender perceptual fill-in across scotomas (McManus et al., 2008), which may account for perceptual fill-in reported by subjects with retinal lesions. By strengthening preexisting connections that are involved in contour integration, the reorganization may entail a change of horizontal connections from a subthreshold to a suprathreshold role and the consequent shift in RF position.
Both the short- and long-term recovery of visually driven activity cannot be accounted for by normal RF organization and therefore requires cortical plasticity and topographic reorganization. First, the RFs at any recording site show little scatter and are remarkably constant from day to day (SD ∼0.05°; Fig. 2). Second, they are limited in extent and, at the eccentricity studied, their activation requires stimulation within an area a half degree in diameter. The occluder experiment shows that, for both the grating and natural stimuli, cells do not respond when the RF is acutely occluded (Fig. 3). The extent of RF shifts is therefore much larger than what one can expect by the normal extent of RF, even when defined by complex stimuli or by scatter.
The altered relationship between spiking and LFP activity before and after the lesion gives an insight into the source of the LFP signal. Although the two show similar tuning to stimulus position before the lesion, the LFP power is reduced and shows little positional tuning after the lesion (Fig. 10C). This may reflect the idea that the source of the LFP signal in the normal cortex comes from neuronal inputs (subthreshold activity) rather than outputs (manifested by spiking activity; Logothetis et al., 2001). This may also explain some of the discrepancies between fMRI (Smirnakis et al., 2005; Masuda et al., 2008) and electrophysiological studies (Eysel, 1982; Gilbert et al., 1990; Kaas et al., 1990; Heinen and Skavenski, 1991; Gilbert and Wiesel, 1992; Darian-Smith and Gilbert, 1994, 1995; Chino et al., 1992, 1995; Das and Gilbert, 1995; Schmid et al., 1996; Calford et al., 2000, 2003, 2005; Giannikopoulos and Eysel, 2006; Keck et al., 2008; Botelho et al., 2014) because fMRI signals have a stronger relationship with LFPs than with spiking activity (Logothetis et al., 2001). Nevertheless, some fMRI work shows clear evidence for cortical reorganization after retinal lesions (Baker et al., 2005; Baker et al., 2008): parts of visual cortex including V1 that normally respond only to central visual stimuli are strongly activated by peripheral stimuli in subjects with extensive bilateral central retinal lesions due to macular degeneration.
The reorganization seen after retinal lesions, together with the changes in cortical circuitry that closely track the functional changes, suggests that functional recovery after CNS damage recruits a preexisting network of lateral cortical interactions that play a role in contour integration in the normal visual cortex. After retinal lesions, these same interactions can be strengthened and allow neurons to recover visually driven activity, with the potential benefit of mediating perceptual fill-in across the retinal scotoma, and may account for the fill-in reported for individuals with macular degeneration.
Footnotes
This work was supported by the National Eye Institute EY007968 (C.D.G.), the National Natural Science Foundation of China (Grant 31125014 to W.L.), and the 111 Project B07008. We thank Minggui Chen for help in offline sorting.
The authors declare no competing financial interests.
References
- Allard T, Clark SA, Jenkins WM, Merzenich MM. Reorganization of somatosensory area 3b representations in adult owl monkeys after digital syndactyly. J Neurophysiol. 1991;66:1048–1058. doi: 10.1152/jn.1991.66.3.1048. [DOI] [PubMed] [Google Scholar]
- Baker CI, Peli E, Knouf N, Kanwisher NG. Reorganization of visual processing in macular degeneration. J Neurosci. 2005;25:614–618. doi: 10.1523/JNEUROSCI.3476-04.2005. [DOI] [PMC free article] [PubMed] [Google Scholar]
- Baker CI, Dilks DD, Peli E, Kanwisher N. Reorganization of visual processing in macular degeneration: replication and clues about the role of foveal loss. Vision Res. 2008;48:1910–1919. doi: 10.1016/j.visres.2008.05.020. [DOI] [PMC free article] [PubMed] [Google Scholar]
- Botelho EP, Ceriatte C, Soares JG, Gattass R, Fiorani M. Quantification of early stages of cortical reorganization of the topographic map of V1 following retinal lesions in monkeys. Cereb Cortex. 2014;24:1–16. doi: 10.1093/cercor/bhs208. [DOI] [PMC free article] [PubMed] [Google Scholar]
- Calford MB, Tweedale R. Immediate and chronic changes in responses of somatosensory cortex in adult flying-fox after digit amputation. Nature. 1988;332:446–448. doi: 10.1038/332446a0. [DOI] [PubMed] [Google Scholar]
- Calford MB, Wang C, Taglianetti V, Waleszczyk WJ, Burke W, Dreher B. Plasticity in adult cat visual cortex (area 17) following circumscribed monocular lesions of all retinal layers. J Physiol. 2000;524:587–602. doi: 10.1111/j.1469-7793.2000.t01-1-00587.x. [DOI] [PMC free article] [PubMed] [Google Scholar]
- Calford MB, Wright LL, Metha AB, Taglianetti V. Topographic plasticity in primary visual cortex is mediated by local corticocortical connections. J Neurosci. 2003;23:6434–6442. doi: 10.1523/JNEUROSCI.23-16-06434.2003. [DOI] [PMC free article] [PubMed] [Google Scholar]
- Calford MB, Chino YM, Das A, Eysel UT, Gilbert CD, Heinen SJ, Kaas JH, Ullman S. Neuroscience: rewiring the adult brain. Nature. 2005;438:E3. doi: 10.1038/nature04359. discussion E3–E4. [DOI] [PubMed] [Google Scholar]
- Chen LM, Qi HX, Kaas JH. Dynamic reorganization of digit representations in somatosensory cortex of nonhuman primates after spinal cord injury. J Neurosci. 2012;32:14649–14663. doi: 10.1523/JNEUROSCI.1841-12.2012. [DOI] [PMC free article] [PubMed] [Google Scholar]
- Chen M, Yan Y, Gong X, Gilbert CD, Liang H, Li W. Incremental integration of global contours through interplay between visual cortical areas. Neuron. 2014;82:682–694. doi: 10.1016/j.neuron.2014.03.023. [DOI] [PubMed] [Google Scholar]
- Chino YM, Kaas JH, Smith EL, 3rd, Langston AL, Cheng H. Rapid reorganization of cortical maps in adult cats following restricted deafferentation in retina. Vision Res. 1992;32:789–796. doi: 10.1016/0042-6989(92)90021-A. [DOI] [PubMed] [Google Scholar]
- Chino YM, Smith EL, 3rd, Kaas JH, Sasaki Y, Cheng H. Receptive-field properties of deafferentated visual cortical neurons after topographic map reorganization in adult cats. J Neurosci. 1995;15:2417–2433. doi: 10.1523/JNEUROSCI.15-03-02417.1995. [DOI] [PMC free article] [PubMed] [Google Scholar]
- Clark SA, Allard T, Jenkins WM, Merzenich MM. Receptive fields in the body-surface map in adult cortex defined by temporally correlated inputs. Nature. 1988;332:444–445. doi: 10.1038/332444a0. [DOI] [PubMed] [Google Scholar]
- Crist RE, Li W, Gilbert CD. Learning to see: experience and attention in primary visual cortex. Nat Neurosci. 2001;4:519–525. doi: 10.1038/87470. [DOI] [PubMed] [Google Scholar]
- Cusick CG, Wall JT, Whiting JH, Jr, Wiley RG. Temporal progression of cortical reorganization following nerve injury. Brain Res. 1990;537:355–358. doi: 10.1016/0006-8993(90)90385-O. [DOI] [PubMed] [Google Scholar]
- Darian-Smith C, Gilbert CD. Axonal sprouting accompanies functional reorganization in adult cat striate cortex. Nature. 1994;368:737–740. doi: 10.1038/368737a0. [DOI] [PubMed] [Google Scholar]
- Darian-Smith C, Gilbert CD. Topographic reorganization in the striate cortex of the adult cat and monkey is cortically mediated. J Neurosci. 1995;15:1631–1647. doi: 10.1523/JNEUROSCI.15-03-01631.1995. [DOI] [PMC free article] [PubMed] [Google Scholar]
- Das A, Gilbert CD. Long-range horizontal connections and their role in cortical reorganization revealed by optical recording of cat primary visual cortex. Nature. 1995;375:780–784. doi: 10.1038/375780a0. [DOI] [PubMed] [Google Scholar]
- Dilks DD, Baker CI, Liu Y, Kanwisher N. “Referred visual sensations”: rapid perceptual elongation after visual cortical deprivation. J Neurosci. 2009;29:8960–8964. doi: 10.1523/JNEUROSCI.1557-09.2009. [DOI] [PMC free article] [PubMed] [Google Scholar]
- Eysel UT. Functional reconnections without new axonal growth in a partially denervated visual relay nucleus. Nature. 1982;299:442–444. doi: 10.1038/299442a0. [DOI] [PubMed] [Google Scholar]
- Fried I, Mukamel R, Kreiman G. Internally generated preactivation of single neurons in human medial frontal cortex predicts volition. Neuron. 2011;69:548–562. doi: 10.1016/j.neuron.2010.11.045. [DOI] [PMC free article] [PubMed] [Google Scholar]
- Giannikopoulos DV, Eysel UT. Dynamics and specificity of cortical map reorganization after retinal lesions. Proc Natl Acad Sci U S A. 2006;103:10805–10810. doi: 10.1073/pnas.0604539103. [DOI] [PMC free article] [PubMed] [Google Scholar]
- Gilbert CD, Li W. Adult visual cortical plasticity. Neuron. 2012;75:250–264. doi: 10.1016/j.neuron.2012.06.030. [DOI] [PMC free article] [PubMed] [Google Scholar]
- Gilbert CD, Wiesel TN. Morphology and intracortical projections of functionally characterised neurones in the cat visual cortex. Nature. 1979;280:120–125. doi: 10.1038/280120a0. [DOI] [PubMed] [Google Scholar]
- Gilbert CD, Wiesel TN. Receptive field dynamics in adult primary visual cortex. Nature. 1992;356:150–152. doi: 10.1038/356150a0. [DOI] [PubMed] [Google Scholar]
- Gilbert CD, Hirsch JA, Wiesel TN. Lateral interactions in visual cortex. Cold Spring Harb Symp Quant Biol. 1990;55:663–677. doi: 10.1101/SQB.1990.055.01.063. [DOI] [PubMed] [Google Scholar]
- Heinen SJ, Skavenski AA. Recovery of visual responses in foveal V1 neurons following bilateral foveal lesions in adult monkey. Exp Brain Res. 1991;83:670–674. doi: 10.1007/BF00229845. [DOI] [PubMed] [Google Scholar]
- Jones EG. Cortical and subcortical contributions to activity-dependent plasticity in primate somatosensory cortex. Annu Rev Neurosci. 2000;23:1–37. doi: 10.1146/annurev.neuro.23.1.1. [DOI] [PubMed] [Google Scholar]
- Kaas JH, Krubitzer LA, Chino YM, Langston AL, Polley EH, Blair N. Reorganization of retinotopic cortical maps in adult mammals after lesions of the retina. Science. 1990;248:229–231. doi: 10.1126/science.2326637. [DOI] [PubMed] [Google Scholar]
- Kaas JH, Qi HX, Burish MJ, Gharbawie OA, Onifer SM, Massey JM. Cortical and subcortical plasticity in the brains of humans, primates, and rats after damage to sensory afferents in the dorsal columns of the spinal cord. Exp Neurol. 2008;209:407–416. doi: 10.1016/j.expneurol.2007.06.014. [DOI] [PMC free article] [PubMed] [Google Scholar]
- Kalaska J, Pomeranz B. Chronic paw denervation causes an age-dependent appearance of novel responses from forearm in “paw cortex” of kittens and adult cats. J Neurophysiol. 1979;42:618–633. doi: 10.1152/jn.1979.42.2.618. [DOI] [PubMed] [Google Scholar]
- Keck T, Mrsic-Flogel TD, Vaz Afonso M, Eysel UT, Bonhoeffer T, Hübener M. Massive restructuring of neuronal circuits during functional reorganization of adult visual cortex. Nat Neurosci. 2008;11:1162–1167. doi: 10.1038/nn.2181. [DOI] [PubMed] [Google Scholar]
- Lamme VA. The neurophysiology of figure-ground segregation in primary visual cortex. J Neurosci. 1995;15:1605–1615. doi: 10.1523/JNEUROSCI.15-02-01605.1995. [DOI] [PMC free article] [PubMed] [Google Scholar]
- Li W, Thier P, Wehrhahn C. Neuronal responses from beyond the classic receptive field in V1 of alert monkeys. Exp Brain Res. 2001;139:359–371. doi: 10.1007/s002210100757. [DOI] [PubMed] [Google Scholar]
- Li W, Piëch V, Gilbert CD. Perceptual learning and top-down influences in primary visual cortex. Nat Neurosci. 2004;7:651–657. doi: 10.1038/nn1255. [DOI] [PMC free article] [PubMed] [Google Scholar]
- Li W, Piëch V, Gilbert CD. Contour saliency in primary visual cortex. Neuron. 2006;50:951–962. doi: 10.1016/j.neuron.2006.04.035. [DOI] [PubMed] [Google Scholar]
- Logothetis NK, Pauls J, Augath M, Trinath T, Oeltermann A. Neurophysiological investigation of the basis of the fMRI signal. Nature. 2001;412:150–157. doi: 10.1038/35084005. [DOI] [PubMed] [Google Scholar]
- Marik SA, Yamahachi H, McManus JN, Szabo G, Gilbert CD. Axonal dynamics of excitatory and inhibitory neurons in somatosensory cortex. PLoS Biol. 2010;8:e1000395. doi: 10.1371/journal.pbio.1000395. [DOI] [PMC free article] [PubMed] [Google Scholar]
- Marik SA, Yamahachi H, Meyer zum Alten Borgloh S, Gilbert CD. Large-scale axonal reorganization of inhibitory neurons following retinal lesions. J Neurosci. 2014;34:1625–1632. doi: 10.1523/JNEUROSCI.4345-13.2014. [DOI] [PMC free article] [PubMed] [Google Scholar]
- Masuda Y, Dumoulin SO, Nakadomari S, Wandell BA. V1 projection zone signals in human macular degeneration depend on task, not stimulus. Cereb Cortex. 2008;18:2483–2493. doi: 10.1093/cercor/bhm256. [DOI] [PMC free article] [PubMed] [Google Scholar]
- Matsuda K, Nagami T, Kawano K, Yamane S. A new system for measuring eye position on a personal computer. Soc Neurosci Abstr. 2000;26:744.2. [Google Scholar]
- McManus JN, Ullman S, Gilbert CD. A computational model of perceptual fill-in following retinal degeneration. J Neurophysiol. 2008;99:2086–2100. doi: 10.1152/jn.00871.2007. [DOI] [PubMed] [Google Scholar]
- Merzenich MM, Nelson RJ, Stryker MP, Cynader MS, Schoppmann A, Zook JM. Somatosensory cortical map changes following digit amputation in adult monkeys. J Comp Neurol. 1984;224:591–605. doi: 10.1002/cne.902240408. [DOI] [PubMed] [Google Scholar]
- Mühlnickel W, Elbert T, Taub E, Flor H. Reorganization of auditory cortex in tinnitus. Proc Natl Acad Sci U S A. 1998;95:10340–10343. doi: 10.1073/pnas.95.17.10340. [DOI] [PMC free article] [PubMed] [Google Scholar]
- Ozeki H, Finn IM, Schaffer ES, Miller KD, Ferster D. Inhibitory stabilization of the cortical network underlies visual surround suppression. Neuron. 2009;62:578–592. doi: 10.1016/j.neuron.2009.03.028. [DOI] [PMC free article] [PubMed] [Google Scholar]
- Piëch V, Li W, Reeke GN, Gilbert CD. Network model of top-down influences on local gain and contextual interactions in visual cortex. Proc Natl Acad Sci U S A. 2013;110:E4108–E4117. doi: 10.1073/pnas.1317019110. [DOI] [PMC free article] [PubMed] [Google Scholar]
- Robertson D, Irvine DR. Plasticity of frequency organization in auditory cortex of guinea pigs with partial unilateral deafness. J Comp Neurol. 1989;282:456–471. doi: 10.1002/cne.902820311. [DOI] [PubMed] [Google Scholar]
- Roelfsema PR, Lamme VA, Spekreijse H. Object-based attention in the primary visual cortex of the macaque monkey. Nature. 1998;395:376–381. doi: 10.1038/26475. [DOI] [PubMed] [Google Scholar]
- Sanes JN, Suner S, Lando JF, Donoghue JP. Rapid reorganization of adult rat motor cortex somatic representation patterns after motor nerve injury. Proc Natl Acad Sci U S A. 1988;85:2003–2007. doi: 10.1073/pnas.85.6.2003. [DOI] [PMC free article] [PubMed] [Google Scholar]
- Schmid LM, Rosa MG, Calford MB, Ambler JS. Visuotopic reorganization in the primary visual cortex of adult cats following monocular and binocular retinal lesions. Cereb Cortex. 1996;6:388–405. doi: 10.1093/cercor/6.3.388. [DOI] [PubMed] [Google Scholar]
- Schoups A, Vogels R, Qian N, Orban G. Practising orientation identification improves orientation coding in V1 neurons. Nature. 2001;412:549–553. doi: 10.1038/35087601. [DOI] [PubMed] [Google Scholar]
- Schwaber MK, Garraghty PE, Kaas JH. Neuroplasticity of the adult primate auditory cortex following cochlear hearing loss. Am J Otol. 1993;14:252–258. [PubMed] [Google Scholar]
- Sher A, Jones BW, Huie P, Paulus YM, Lavinsky D, Leung LS, Nomoto H, Beier C, Marc RE, Palanker D. Restoration of retinal structure and function after selective photocoagulation. J Neurosci. 2013;33:6800–6808. doi: 10.1523/JNEUROSCI.1044-12.2013. [DOI] [PMC free article] [PubMed] [Google Scholar]
- Smirnakis SM, Brewer AA, Schmid MC, Tolias AS, Schüz A, Augath M, Inhoffen W, Wandell BA, Logothetis NK. Lack of long-term cortical reorganization after macaque retinal lesions. Nature. 2005;435:300–307. doi: 10.1038/nature03495. [DOI] [PubMed] [Google Scholar]
- Stettler DD, Das A, Bennett J, Gilbert CD. Lateral connectivity and contextual interactions in macaque primary visual cortex. Neuron. 2002;36:739–750. doi: 10.1016/S0896-6273(02)01029-2. [DOI] [PubMed] [Google Scholar]
- Tankus A, Yeshurun Y, Fried I. An automatic measure for classifying clusters of suspected spikes into single cells versus multiunits. J Neural Eng. 2009;6 doi: 10.1088/1741-2560/6/5/056001. 056001. [DOI] [PMC free article] [PubMed] [Google Scholar]
- Van Essen DC, Newsome WT, Maunsell JH. The visual field representation in striate cortex of the macaque monkey: asymmetries, anisotropies, and individual variability. Vision Res. 1984;24:429–448. doi: 10.1016/0042-6989(84)90041-5. [DOI] [PubMed] [Google Scholar]
- van Hateren JH, van der Schaaf A. Independent component filters of natural images compared with simple cells in primary visual cortex. Proc Biol Sci. 1998;265:359–366. doi: 10.1098/rspb.1998.0303. [DOI] [PMC free article] [PubMed] [Google Scholar]
- Yamahachi H, Marik SA, McManus JN, Denk W, Gilbert CD. Rapid axonal sprouting and pruning accompany functional reorganization in primary visual cortex. Neuron. 2009;64:719–729. doi: 10.1016/j.neuron.2009.11.026. [DOI] [PMC free article] [PubMed] [Google Scholar]