

ABSTRACT
Purpose
The potential mechanisms of hamstring strain injuries in athletes are not well understood. The study, therefore, was aimed at understanding hamstring mechanics by studying loading conditions during maximum-effort overground sprinting.
Methods
Three-dimensional kinematics and ground reaction force data were collected from eight elite male sprinters sprinting at their maximum effort. Maximal isometric torques of the hip and knee were also collected. Data from the sprinting gait cycle were analyzed via an intersegmental dynamics approach, and the different joint torque components were calculated.
Results
During the initial stance phase, the ground reaction force passed anteriorly to the knee and hip, producing an extension torque at the knee and a flexion torque at the hip joint. Thus, the active muscle torque functioned to produce flexion torque at the knee and extension torque at the hip. The maximal muscle torque at the knee joint was 1.4 times the maximal isometric knee flexion torque. During the late swing phase, the muscle torque counterbalanced the motion-dependent torque and acted to flex the knee joint and extend the hip joint. The loading conditions on the hamstring muscles were similar to those of the initial stance phase.
Conclusions
During both the initial stance and late swing phases, the large passive torques at both the knee and hip joints acted to lengthen the hamstring muscles. The active muscle torques generated mainly by the hamstrings functioned to counteract those passive effects. As a result, during sprinting or high-speed locomotion, the hamstring muscles may be more susceptible to high risk of strain injury during these two phases.
Key Words: RUNNING BIOMECHANICS, MUSCLE STRAIN, LOAD CONDITION, JOINT TORQUE, INTERSEGMENTAL DYNAMICS
Hamstring strain injury is one of the most common injuries among athletes in sports such as sprinting, soccer, or rugby (14,23,33). It can not only cause great pain on stretching or contracting muscles but can also have significant physiological and psychological effects on an athlete’s performance. Although many studies have been conducted to reveal the underlying mechanisms of hamstring strain injuries, it is still in dispute whether the hamstrings are susceptible to injury during the stance phase or swing phase of the sprinting stride cycle or during both of them (14,21). The underlying mechanisms of hamstring injuries are not well understood.
Mann and Sprague (17) and Mann (18) firstly speculated that early stance was the highest-risk period because their results showed that both knee flexion and hip extension moments reached the greatest value in the early ground contact phase, indicating that the hamstring muscles group may be primarily responsible for generating the main force during this phase. However, the hamstring mechanics of the knee flexion moment during initial stance phase remained unclear in their study.
Many subsequent researchers have rejected Mann’s argument, preferring the hypothesis that muscle strains occur during eccentric contractions. They used musculoskeletal models to study hamstring function during running (4,5,25,29,30). They found that the biarticular hamstrings reached maximal lengthening, produced peak force, and performed much negative work during the late swing phase of the stride cycle and concluded that the biarticular hamstrings were at greatest risk of injury in this period of the stride cycle. Heiderscheit et al. (7) and Schache et al. (23) also considered neuromuscular latencies and electromechanical delays in preinjury and injury trials. Results from these studies indicated that the stimulus for the injury must have occurred before foot strike during the swing phase. However, the exact dynamic contributions (such as motion, inertia, and external force) to the stimulus are not very clear.
Yu et al. (35) reported that the peak eccentric contraction speeds of the hamstring muscles were significantly greater during the late swing phase than that during the late stance phase. However, the hamstring muscle–tendon lengths at the peak eccentric contraction speeds were significantly greater during the late stance phase than those during the late swing phase. Hence, the late stance phase and late swing phase were identified as the potential phases for hamstring muscles strain injury. However, this study was conducted during an acceleration phase of overground sprinting.
In summary, most of the previous studies are based on the clinical muscle strain assumption, despite experimental muscle strains also being able to be produced during concentric (shortening) contractions (31). Besides, some studies focused on the acceleration phase rather than the maximal speed phase of sprinting (35) or used a treadmill rather than overground running (4,5,23,29,30). Although the treadmill is a moderate tool for assessment of running biomechanics, the parameters measured with a treadmill are not equivalent to those measured with overground running and may possibly lead to inadequate conclusions about overground running (19,27). Furthermore, limited attempts have been made to measure ground reactions during overground sprinting (12,17,18,20), and few previous studies that have used such data to estimate hamstring kinetics during stance (5,25). For these reasons, the potential mechanisms of hamstring strain injuries in athletes are still not well understood.
This study was aimed at understanding hamstring mechanics by studying loading conditions during maximum-effort overground sprinting. On the basis of the previous studies, we hypothesized that there would be greater hamstring strain risk during both the initial stance and late swing phases compared with that during other phases of the overground sprinting gait cycle. Especially, an intersegmental dynamics approach was used to evaluate hamstring kinetics at both the knee and hip joints during the entire gait cycle of elite athletes. This would reveal how the active and passive joint torque components affect the hamstring injury risk.
METHODS
Subjects
Eight male elite sprinters (age, 21.1 ± 1.9 yr; mass, 74.7 ± 4.1 kg; height, 181.5 ± 3.9 cm) (all mean ± SD) participated in this study. The sprinters’ best performance records for 100 m ranged from 10.27 to 10.80 s. Subjects were free of musculoskeletal injuries in the lower extremity at least 6 months before the study. This study was approved by the local ethical committee of Shanghai University of Sport, and all participants gave an informed written consent before testing.
Data collection
An isokinetic dynamometer (Con-Trex PM1/MJ; CMV AG Corp., Zurich, Switzerland) was used to measure subjects’ maximal isometric knee joint flexion and extension torque before the sprinting trials. During the sprinting trails, 57 reflective markers were placed on the subjects’ anatomic landmarks on the basis of the marker setup used in our earlier study (8). Three-dimensional kinematic data were collected at a sampling rate of 300 Hz via eight high-resolution cameras (Vicon MX, Oxford, United Kingdom). The calibration volume for kinematics collection was 10.0 m long, 2.5 m high, and 2.0 m wide and located 40 m away from the starting line. Ground reaction forces (GRF) were collected with a recessed force platform (Kistler 9287B, 0.6 m × 0.9 m; Kistler Instruments Corp., Winterthur, Switzerland). The force signals were amplified and recorded in the Vicon system at a sampling rate of 1200 Hz. After sufficient warming up, the subjects wearing spiked shoes performed maximum-effort sprinting on the synthetic track. Each subject performed 3–4 trials with sufficient rest intervals. One of the trails containing valid force plate contacts was analyzed for each subject. One gait cycle was defined from the beginning of the stance phase (initial foot-to-ground contact determined by the vertical GRF) to the end of the subsequent swing phase (immediately before the next foot-to-ground contact determined by the vertical velocity of the markers on the forefoot).
Data reduction
Preprocessed kinematics and kinetic data (C3D format) were imported to Visual 3D (3.390.23; C-Motion, Inc.). Kinematic and force data were filtered through a fourth-order Butterworth digital filter at cutoff frequencies of 17 and 55 Hz (32,34), respectively. Anatomical landmarks and segments were defined according to the Visual 3D framework model and the anthropometric data. The whole-body center of mass was determined using a 14-segment model (6). The average horizontal velocity of the body center of mass during the whole stride cycle was used to represent the running speed. From the collected three-dimensional data, two-dimensional sagittal plane coordinates were extracted. Data from the right lower extremity were used for the following analyses. Stance phase was defined from the right foot touchdown to toe off as measured by the force platform, whereas swing phase was defined as from toe off to touchdown of the same foot.
Intersegmental dynamics analysis
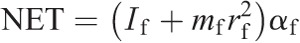
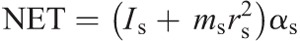
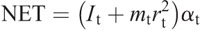
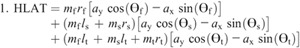
The intersegmental dynamics analysis was conducted with a customized program using the data from Visual 3D. The lower limb was modeled as a linked-segment system (thigh, shank, foot) with frictionless joints at the hip, knee, and ankle (8,15). The origin of the local coordinate system (x0, y0) for the system was fixed at the hip joint, and therefore, the motion of the lower limb could be described by x0, y0 and segment angles θf, θs, and θt (Fig. 1). The definition of the angular motion of a segment was positive when the direction of segmental rotation was counterclockwise. On the basis of free body diagrams of the segments of the lower extremity, the dynamic equations of motion was derived using the Newton–Euler formula applied to each body segment. The anthropometric inertial parameters for Chinese adults published by Zheng (37) were used to determine the location of the center of mass and the moment of inertia of each body segment. According to earlier research (9,22,36), at each of the joints of the linked segments, the torque was separated into five categories: net joint torque (NET), gravitational torque (GTT), motion-dependent torque (MDT), contact torque (EXT), and generalized muscle torque (MST). NET is the sum of the other four components:
FIGURE 1.
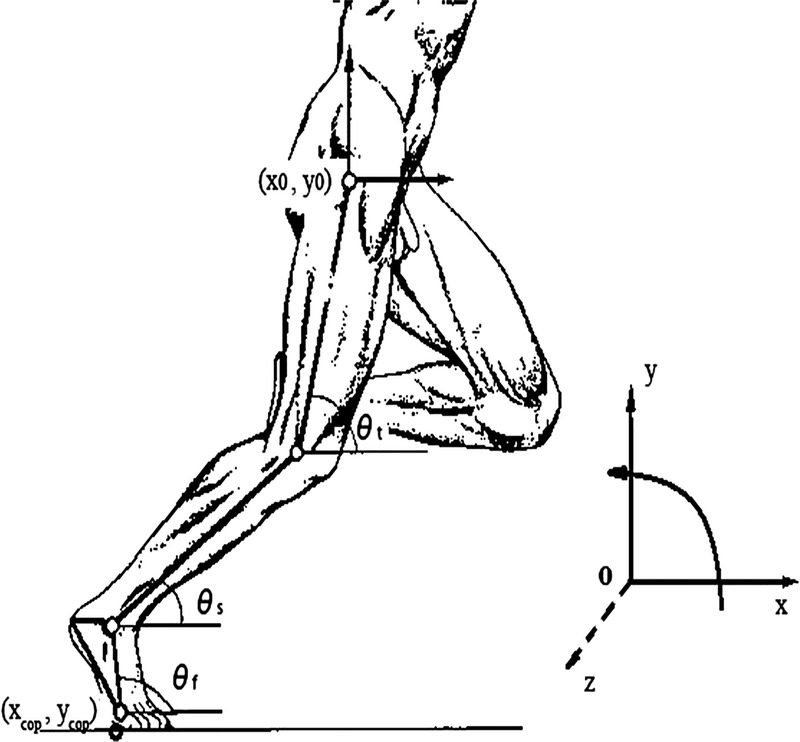
Model of lower limb. θf, θs, and θt, segment angles for the foot, shank, and thigh measured at the distal joint. x0 and y0, the X and Y coordinates of the hip; xcop and ycop, the X and Y coordinates of the center of pressure.

Thus, NET is the sum of all the positive and negative torque components acting on a joint. MST is the resultant joint torque mainly generated by muscle contractions. GTT results from gravitational force acting at the center of each joint. EXT is generated at joints by GRF acting on limb segments. MDT arises from mechanical interactions occurring between limb segments and is the sum of all torques produced by segment movements (e.g., segment angular velocity and angular acceleration).
MST at each joint is calculated as follows:

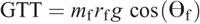
The equations for each component are as follows:
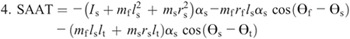
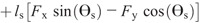
Ankle torque components:


Knee torque components:

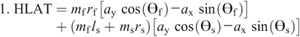


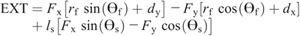
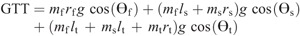
Hip torque components:


Nomenclature:
mf, ms, and mt —mass of the foot, shank, and thigh
If, Is, and It —moment of inertia about the center of mass of the foot, shank, and thigh
θf, θs, and θt —segment angles for the foot, shank, and thigh measured at the distal joint (orientation angle)
ωf, ωs, and ωt —angular velocities of the foot, shank, and thigh
αf, αs, and αt —angular accelerations of the foot, shank, and thigh
rf, rs, and rt —distances from the proximal joint to the center of mass of the foot, shank, and thigh
ls and lt —lengths of the shank and thigh segments
Fx and Fy —X and Y components of the GRF
ax and ay —X and Y components of the linear acceleration of the hip joint (x0, y0)
dx and dy —X and Y distances from the center of pressure to the center of mass of the foot (i.e., xcmf−xcop and ycmf−ycop, respectively, where xcmf and ycmf are the X and Y coordinates of the center of mass of the foot, respectively, and xcop and ycop are the X and Y coordinates of the center of pressure) g gravitational constant.
RESULTS
The subjects’ average maximal isometric contraction torque of knee flexors was 164.8 ± 29.6 N·m, as measured via the isokinetic dynamometer. The average sprinting speed for the eight subjects was 9.7 ± 0.3 m·s−1. Figure 2A shows the ensemble curves for knee and hip joint torque during stance phase. MST and EXT were the two main torques counterbalancing each other during stance phase while the other torques (GTT, MDT, and NET) were much smaller.
FIGURE 2.

A. Averaged time-normalized graphs for joint torques at the knee and hip joints during the stance phase. The top panel shows positions of the lower extremity during stance phase. Data represents the group mean (lines) with one SD (shading). B. Diagram of sprinting during the initial stance phase. The GRF passes anteriorly to the knee and hip joints. +, extension; −, flexion.
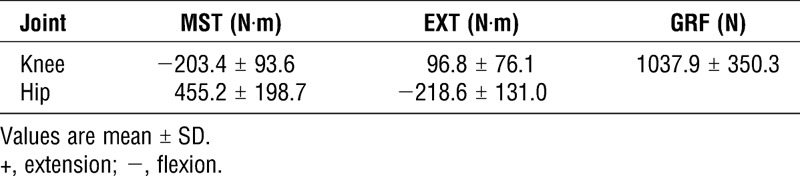
Note that the knee flexion MST and the hip extension MST both reached peak values during the initial stance phase (about 5% of stance phase) (Fig. 2A). These peak values could be easily removed in the normalization and data smoothing process. To show the real situation, the mean ± SD peak values among subjects are presented (Table 1). Figure 2B shows the skeleton diagram of the subjects’ sprinting during the initial stance phase. Note that the GRF passed anteriorly to the knee and hip at this moment, which would generate an extension torque at the knee and a flexion torque at the hip joint. Although hip extension MST has larger values later, the knee MST tended to be positive (extension).
TABLE 1.
Maximum MST, EXT at the knee and hip joints, and maximum GRF during the initial stance phase.
As shown in Figure 3A, both MST and MDT were much greater than the others during the swing phase. They were counterbalancing and reached the maximum at both knee and hip joints at a time point approximately 80% of the way through swing phase. The skeleton diagram during late swing phase is shown in Figure 3B and the mean peak values at this moment are shown in Table 2.
FIGURE 3.
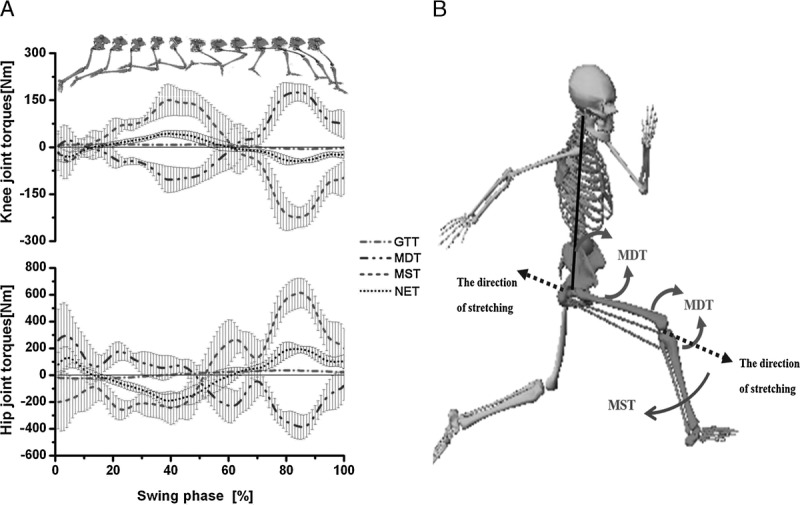
A. Averaged time-normalized graphs for joint torques at the knee and hip joints during swing phase. The top panel shows positions of the lower extremity during swing phase. Data represents the group mean (lines) with one SD (shading). B. Diagram of sprinting during the late swing phase; the inertial loads produced by segment motion work at the knee and hip joints. +, extension; −, flexion.
TABLE 2.
Maximum MST and MDT at the knee and hip joints during the late swing phase.

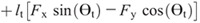
Figure 4 shows the ensemble curves of components of MDT at the hip joint and the knee joint during swing phase. MDT at the hip joint was mainly composed of the torque due to shank angular acceleration (SAAT), thigh angular acceleration, and hip linear acceleration. MDT at the knee joint was mainly constituted of the SAAT during the entire swing phase.
FIGURE 4.
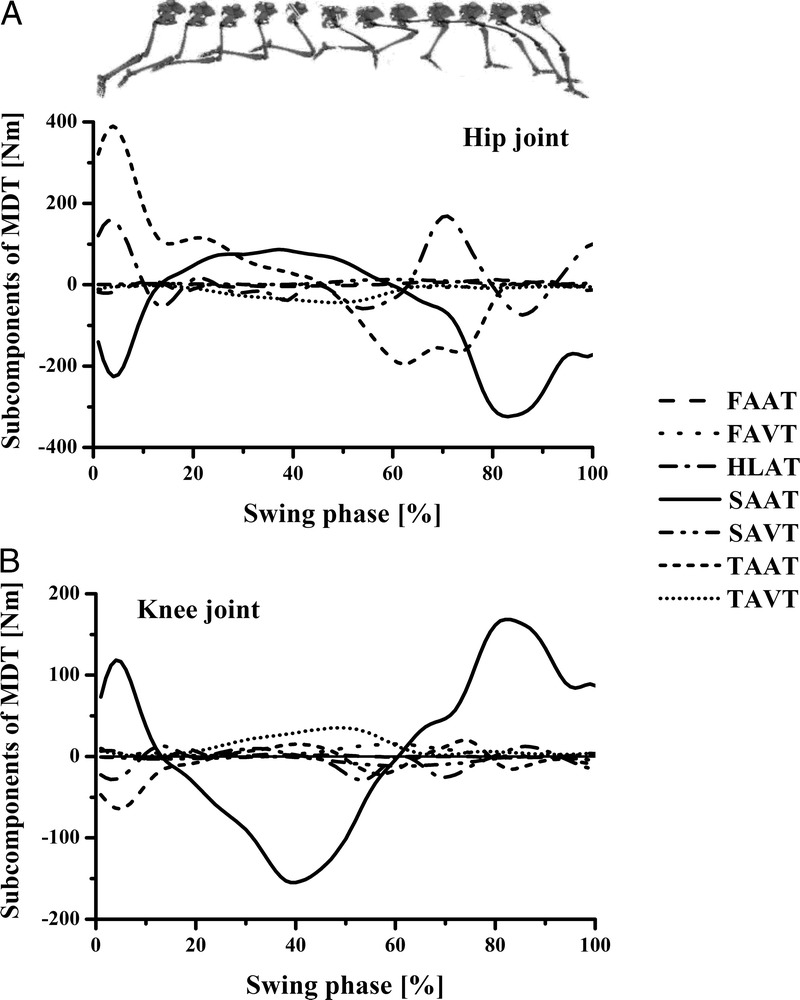
Ensemble curves of subcomponents of MDT at the hip (A) and knee (B) joints during the swing phase. +, extension torque; −, flexion torque; FAAT, torque due to foot angular acceleration; FAVT, torque due to foot angular velocity; HLAT, torque due to hip linear acceleration; SAAT, torque due to shank angular acceleration; SAVT, torque due to shank angular velocity; TAAT, torque due to thigh angular acceleration; TAVT, torque due to thigh angular velocity.
DISCUSSION
During initial stance phase, the GRF passed in front of the knee and hip joints, which resulted in a large extension torque at the knee and a flexion torque at the hip (EXT) (Fig. 2B). These EXT acted at both knee and hip joints, applying stress to the hamstring muscles. To counteract this effect of GRF, the knee flexors and the hip extensors, hamstring muscles served both roles, were required to produce a large flexion torque at the knee and an extension torque at the hip. This observation is congruent with previous studies (3,16–18), which showed a large knee flexion MST during initial stance phase but contradicts some kinetic findings of no knee flexion torque at this moment (25).
Because these large peak values appeared within a very short period, they could easily be removed as a noise spike by using an inappropriate filtering method, which may explain the inconsistent findings in hamstring mechanics during early stance in maximum speed sprinting. In the study of Schache et al. (25), peak stance musculotendon force for the biarticular hamstrings would seem to have been underestimated in the early stance phase and the authors ascribed this underestimation to the computational approach used to calculate muscle forces, that is, the limitations of inverse dynamics-based static optimization combined with a minimum stress performance criterion. However, in our opinion, the cause of this underestimation could be that erroneously low (or zero) knee flexion torque and hip extension torque were taken to calculate individual muscle forces. Compared with their previous results, which also demonstrated a knee flexion MST during initial stance phase (24), some peak values of joint moments might be removed artificially (25).
The average peak MST at knee and hip joints were −203.4 ± 93.6 N·m and 455.2 ± 198.7 N·m, respectively, during the initial stance phase (Table 1). On the basis of the magnetic resonance imaging and videofluoroscopy results (2,10,26), the two-dimensional moment arm of the hamstrings at the knee joint in the sagittal plane was approximately 0.02–0.04 m. We could reasonably estimate the peak hamstring force across the knee joint on the basis of the MST values at the knee, and it ranged from 5777 to 11,554 N, which is at least 8 times the subjects’ average body weight. Furthermore, because the subjects’ maximal isometric contraction force of the knee flexors ranged from 4120 to 8241 N (estimated from the results measured via the isokinetic dynamometer, 164.8 ± 29.6 N·m), the knee flexor force during the initial stance phase was 40% larger than that produced by the maximal isometric knee flexion. Clearly, a huge load acts on the hamstrings during sprinting.
In addition, the MST is a net effect of both agonist and antagonist activities. Thus, the hamstrings encounter the knee extensors (quadriceps femoris) to generate this flexor torque, which means that the actual knee extension torques that need to be generated by the hamstrings might be even greater than those in the present results. In this case, there would be a high strain injury risk during the initial stance phase because of the sprinter’s hamstring strength deficits.
During the late swing phase, the thigh started to extend backward but the shank still rotated forward because of MDT. To pull the shank backward and downward before ground contact, the hamstring muscles are intensely contracted, creating an (clockwise) acceleration where there is a rapid change from eccentric to concentric function (Fig. 3B). Our data revealed that the largest MST occurred at the end of the swing phase (Fig. 3A), where the largest hip extension and knee flexion MST happened at almost the same time and the MST was used mainly to counterbalance the MDT during swing phase. The mean ± SD peak values of MST at the knee and hip joints were −249.3 ± 38.8 N·m and 650.8 ± 101.1 N·m (Table 2), respectively. Using the force arm of the hamstring muscles based on magnetic resonance imaging studies, we could also estimate the force produced by the knee flexors at this moment. It was from 6225 to 12,450 N, which is approximately 10 times the subjects’ average body weight and 50% larger than that generated during the maximal isometric knee flexion.
As with the loading conditions during the initial stance phase, it was necessary to take the antagonist activities into consideration. Thus, the actual torques produced by the hamstring muscles at the knee and hip might be greater than those we estimated. The hamstrings loading condition was maximized during this phase as well. This was consistent with most of the previous studies (23,24,28,30,35), which reported that the peak hamstring stretch and force occur during the late swing phase of sprinting before foot contact. In addition, our results highlighted that this high load on the hamstrings was caused by the MDT because the MST functioned to counterbalance the MDT to control the rapid limb rotation during the swing phase. We further found that the major component of MDT at both the knee and hip was the MDT due to the acceleration of shank (Fig. 4). These findings may answer the question of why the hamstrings were stretched to their maximum length and the muscle force reached its maximal value during the late swing phase according to the observations of other researchers.
In summary, our analysis of MST via intersegment dynamics indicated that the hamstring muscles experience tremendous loads in both the initial stance phase and late swing phase. This is consistent with previous EMG studies (5,35) reporting that peak activities of the medial and lateral hamstrings occurred during the initial stance and late swing phases. Although force load on its own is not a strong predictor of injury, the results suggest that there would be greater strain risk during these two phases. Furthermore, our analyses revealed the reasons behind those high loading conditions, that is, EXT (by GRF) in the initial stance phase and MDT (mainly by shank angular acceleration) in the late swing phase, respectively. The values of flexion torque at the knee and extension torque at the hip in those two phases were considerable, indicating that the knee flexors and hip extensors play a very important role in sprint running, especially during the initial stance phase and late swing phase. These findings may help inform coaches and athletes in designing appropriate training protocols and injury prevention strategies that focus on emphasizing knee flexors and hip extensors on the basis of the characteristics of MST.
Our previous work (13) showed that all of the major muscles that cross the hip and knee joint were activated above minimum level during running, including monoarticular (gluteus maximus, vastus lateralis, biceps femoris short head) and biarticular (rectus femoris, hamstrings, and gastrocnemius) muscles. In addition, passive structures also contribute to joint torques at both the joints. However, hamstrings are the only biarticular muscles that flex the knee and extend the hip, in addition to the fact that hamstrings are the most injured muscles during sprint (14,33). Therefore, we have focused our MST-related discussions on the hamstring. Future studies need to consider the role of other active and passive structures that cross the hip and knee joints. Their contributions to hip joint extension and knee joint flexion torque and their influence on the dynamics of the hamstrings need to be further studied. Moreover, some recent research indicates that during inverse dynamics analysis of locomotion, mismatched cutoff frequencies applied to the kinematic and kinetic data will likely affect the calculated joint torques (1,11). This might be a potential limitation of this study and should be treated with caution in further research.
During the initial stance phase and late swing phase, the passive torques (EXT and MDT produced by GRF and the inertial movement of the segments of the lower extremity) applied stress to the hamstring muscles in opposite directions at both the knee and hip joints. To counter these large passive effects, the hamstring muscles endure high mechanical loads, which may lead to strains. By understanding the loading condition on hamstring muscles, especially the load production mechanism, injury prevention programs and rehabilitation approaches can be developed to mitigate the high risk of hamstring strain injuries during high-speed running.
Acknowledgments
The authors would like to thank Dr. Fuzhong Li for his support and suggestions in this study.
This study was supported partly by the National Natural Science Foundation of China (grants 30871210 and 11372194) and Shanghai Broad Liberal Arts Academic New Talents Incubation program from Shanghai University of Sport (xsxr2012021).
The authors have no conflicts of interest to declare.
The results of the present study do not constitute endorsement by the American College of Sports Medicine.
REFERENCES
- 1. Bezodis NE, Salo AI, Trewartha G. Excessive fluctuations in knee joint moments during early stance in sprinting are caused by digital filtering procedures. Gait Posture. 2013; 38 (4): 653– 7. [DOI] [PubMed] [Google Scholar]
- 2. Bonnefoy A, Doriot N, Senk M, Dohin B, Pradon D, Cheze L. A non-invasive protocol to determine the personalized moment arms of knee and ankle muscles. J Biomech. 2007; 40 (8): 1776– 85. [DOI] [PubMed] [Google Scholar]
- 3. Brüggemann GP, Arampatzis A, Emrich F, Potthast W. Biomechanics of double transtibial amputee sprinting using dedicated sprinting prostheses. Sports Technol. 2008; 1 (4): 220– 77. [Google Scholar]
- 4. Chumanov ES, Heiderscheit BC, Thelen DG. The effect of speed and influence of individual muscles on hamstring mechanics during the swing phase of sprinting. J Biomech. 2007; 40 (16): 3555– 62. [DOI] [PubMed] [Google Scholar]
- 5. Chumanov ES, Heiderscheit BC, Thelen DG. Hamstring musculotendon dynamics during stance and swing phases of high-speed running. Med Sci Sports Exerc. 2011; 43 (3): 525– 32. [DOI] [PMC free article] [PubMed] [Google Scholar]
- 6. Hay JG. The Biomechanics of Sports Techniques. 4th ed. Englewood Cliffs (NJ): Prentice-Hall; 1993. p 138– 43. [Google Scholar]
- 7. Heiderscheit BC, Hoerth DM, Chumanov ES, Swanson SC, Thelen BJ, Thelen DG. Identifying the time of occurrence of a hamstring strain injury during treadmill running: a case study. Clin Biomech (Bristol, Avon). 2005; 20 (10): 1072– 8. [DOI] [PubMed] [Google Scholar]
- 8. Huang L, Liu Y, Wei S, et al. , Segment-interaction and its relevance to the control of movement during sprinting. J Biomech. 2013; 46 (12): 2018– 23. [DOI] [PubMed] [Google Scholar]
- 9. Hunter JP, Marshall RN, McNair PJ. Segment-interaction analysis of the stance limb in sprint running. J Biomech. 2004; 37 (9): 1439– 46. [DOI] [PubMed] [Google Scholar]
- 10. Kellis E, Baltzopoulos V. In vivo determination of the patella tendon and hamstrings moment arms in adult males using videofluoroscopy during submaximal knee extension and flexion. Clin Biomech (Bristol, Avon). 1999; 14 (2): 118– 24. [DOI] [PubMed] [Google Scholar]
- 11. Kristianslund E, Krosshaug T, van den Bogert AJ. Effect of low pass filtering on joint moments from inverse dynamics: implications for injury prevention. J Biomech. 2012; 45 (4): 666– 71. [DOI] [PubMed] [Google Scholar]
- 12. Kuitunen S, Komi PV, Kyrolainen H. Knee and ankle joint stiffness in sprint running. Med Sci Sports Exerc. 2002; 34 (1): 166– 73. [DOI] [PubMed] [Google Scholar]
- 13. Li L, Ogden LL. Muscular activity characteristics associated with preparation for gait transition. J Sport Health Sci. 2012; 1 (1): 27– 35. [Google Scholar]
- 14. Liu H, Garrett WE, Moorman CT, Yu B. Injury rate, mechanism, and risk factors of hamstring strain injuries in sports: a review of the literature. J Sport Health Sci. 2012; 1 (2): 92– 101. [Google Scholar]
- 15. Liu Y, Shih S, Tian S, Zhong Y, Li L. Lower extremity joint torque predicted by using artificial neural network during vertical jump. J Biomech. 2009; 42 (7): 906– 11. [DOI] [PubMed] [Google Scholar]
- 16. Luo G, Stefanyshyn D. Ankle moment generation and maximum-effort curved sprinting performance. J Biomech. 2012; 45 (16): 2763– 8. [DOI] [PubMed] [Google Scholar]
- 17. Mann R, Sprague P. A kinetic analysis of the ground leg during sprint running. Res Q Exerc Sport. 1980; 51 (2): 334– 48. [DOI] [PubMed] [Google Scholar]
- 18. Mann R. A kinetic analysis of sprinting. Med Sci Sports Exerc. 1981; 13 (5): 325– 8. [PubMed] [Google Scholar]
- 19. Nigg BM, De Boer RW, Fisher V. A kinematic comparison of overground and treadmill running. Med Sci Sports Exerc. 1995; 27 (1): 98– 105. [PubMed] [Google Scholar]
- 20. Novacheck TF. Walking, running, and sprinting: a three-dimensional analysis of kinematics and kinetics. Instr Course Lect. 1995; 44: 497– 506. [PubMed] [Google Scholar]
- 21. Orchard JW. Hamstrings are most susceptible to injury during the early stance phase of sprinting. Br J Sports Med. 2012; 46 (2): 88– 9. [DOI] [PubMed] [Google Scholar]
- 22. Putnam CA. A segment interaction analysis of proximal-to-distal sequential segment motion patterns. Med Sci Sports Exerc. 1991; 23 (1): 130– 44. [PubMed] [Google Scholar]
- 23. Schache AG, Wrigley TV, Baker R, Pandy MG. Biomechanical response to hamstring muscle strain injury. Gait Posture. 2009; 29 (2): 332– 8. [DOI] [PubMed] [Google Scholar]
- 24. Schache AG, Blanch PD, Dorn TW, Brown NA, Rosemond D, Pandy MG. Effect of running speed on lower limb joint kinetics. Med Sci Sports Exerc. 2011; 43 (7): 1260– 71. [DOI] [PubMed] [Google Scholar]
- 25. Schache AG, Dorn TW, Blanch PD, Brown NA, Pandy MG. Mechanics of the human hamstring muscles during sprinting. Med Sci Sports Exerc. 2012; 44 (4): 647– 58. [DOI] [PubMed] [Google Scholar]
- 26. Scheys L, Spaepen A, Suetens P, Jonkers I. Calculated moment-arm and muscle-tendon lengths during gait differ substantially using MR based versus rescaled generic lower-limb musculoskeletal models. Gait Posture. 2008; 28 (4): 640– 8. [DOI] [PubMed] [Google Scholar]
- 27. Sinclair J, Richards J, Taylor PJ, Edmundson CJ, Brooks D, Hobbs SJ. Three-dimensional kinematic comparison of treadmill and overground running. Sports Biomech. 2013; 12 (3): 272– 82. [DOI] [PubMed] [Google Scholar]
- 28. Thelen DG, Chumanov ES, Best TM, Swanson SC, Heiderscheit BC. Simulation of biceps femoris musculotendon mechanics during the swing phase of sprinting. Med Sci Sports Exerc. 2005; 37 (11): 1931– 8. [DOI] [PubMed] [Google Scholar]
- 29. Thelen DG, Chumanov ES, Hoerth DM, et al. , Hamstring muscle kinematics during treadmill sprinting. Med Sci Sports Exerc. 2005; 37 (1): 108– 14. [DOI] [PubMed] [Google Scholar]
- 30. Thelen DG, Chumanov ES, Sherry MA, Heiderscheit BC. Neuromusculoskeletal models provide insights into the mechanisms and rehabilitation of hamstring strains. Exerc Sport Sci Rev. 2006; 34 (3): 135– 41. [DOI] [PubMed] [Google Scholar]
- 31. Uchiyama Y, Tamaki T, Fukuda H. Relationship between functional deficit and severity of experimental fast-strain injury of rat skeletal muscle. Eur J Appl Physiol. 2001; 85 (1–2): 1– 9. [DOI] [PubMed] [Google Scholar]
- 32. Winter DA. Biomechanics and Motor Control of Human Movement. 4th ed. New York (NY): John Wiley & Sons; 2009. p. 67– 75. [Google Scholar]
- 33. Woods C, Hawkins RD, Maltby S, et al. Football Association Medical Research Programme. The Football Association Medical Research Programme: an audit of injuries in professional football—analysis of hamstring injuries. Br J Sports Med. 2004; 38 (1): 36– 41. [DOI] [PMC free article] [PubMed] [Google Scholar]
- 34. Yu B, Gabriel D, Noble L, An KN. Estimate of the optimum cutoff frequency for the butterworth low-pass digital filter. J Appl Biomech. 1999; 15 (3): 318– 29. [Google Scholar]
- 35. Yu B, Queen RM, Abbey AN, Liu Y, Moorman CT, Garrett WE. Hamstring muscle kinematics and activation during overground sprinting. J Biomech. 2008; 41 (15): 3121– 6. [DOI] [PubMed] [Google Scholar]
- 36. Zernicke RF, Smith JL. Biomechanical insights into neural control of movement. In: Rowell LB, Shepherd JT, eds. Handbook of Physiology, New York (NY): Oxford University Press; 1996. p. 293– 332. [Google Scholar]
- 37. Zheng X. Modern Sports Biomechanics (in Chinese), Beijing (China): National Defence Industry Press; 2007. p. 169– 88. [Google Scholar]