

Abstract
Cerebellar morphology and function have been implicated in a variety of developmental disorders, and in healthy aging. Although recent work has sought to characterize the relationships between volume and age in this structure during adolescence, young, and older adulthood, there have been no investigations of regional cerebellar volume from adolescence through late middle age. Middle age in particular has been largely understudied, and investigating this period of the lifespan may be especially important for our understanding of senescence. Understanding regional patterns of cerebellar volume with respect to age during this portion of the lifespan may provide important insight into healthy aging and cognitive function as well as pathology from adolescence into later life. We investigated regional cerebellar volume using a highly novel lobular segmentation approach in conjunction with a battery of cognitive tasks in a cross‐sectional sample of 123 individuals from 12 to 65 years old. Our results indicated that regional cerebellar volumes show different patterns with respect to age. In particular, the more posterior aspect of the neocerebellum follows a quadratic “inverse‐U” pattern while the vermis and anterior cerebellum follow logarithmic patterns. In addition, we quantified the relationships between age and a variety of cognitive assessments and found relationships between regional cerebellar volumes and performance. Finally, exploratory analyses of sex differences in the relationships between regional cerebellar volume, age, and cognition were investigated. Taken together, these results provide key insights into the development and aging of the human cerebellum, and its role in cognitive function across the lifespan. Hum Brain Mapp 36:1102–1120, 2015. © 2014 Wiley Periodicals, Inc.
Keywords: adolescence, aging, cerebellum, cognition, MRI
INTRODUCTION
Across the lifespan, there is variation in cognitive performance, associated first with brain development, and later with senescence [Craik and Bialystok, 2006]. However, as noted by Craik and Bialystok [2006], there is often little integration and cross talk between the developmental and aging fields. Moving away from cross‐sectional comparisons of young and older adults, for example, and moving toward investigations that look cross‐sectionally at the lifespan is particularly important for capturing trajectories of brain and cognitive development. Investigating adolescence and middle age may be especially important for understanding cognitive function and brain differences in later life. Indeed, recent longitudinal work investigating white matter during middle age indicated that baseline white matter structural integrity was predictive of change 4 years later in healthy individuals [Ly et al., 2014]. That is, measures of white matter structural integrity at time one during middle age were associated with the degree of white matter atrophy measured between 3 and 4 years later. This highlights the importance of investigating brain morphology during middle age, as it may be predictive of changes later in life.
In both the development and aging fields, there have now been many studies investigating brain‐behavior relationships to better understand development and senescence [e.g. Bernard and Seidler, 2013; Raz et al., 2000; Tamnes et al., 2013; Woodruff‐pak et al., 2001; Ziegler et al., 2013]. Indeed, the benefit of investigating individual differences in brain structure to better understand individual differences in performance has been recently reviewed [Kanai and Rees, 2011]. These analyses have greatly increased our understanding of the brain and cognition at different points across the lifespan. An emerging literature focusing on the cerebellum has recently begun to highlight the role of this structure in a variety of task domains. The cerebellum is now known to be involved in a variety of motor and cognitive processes [e.g. Chen and Desmond, 2005a; Leiner et al., 1989, 1993; Stoodley and Schmahmann, 2009]. Indeed, with respect to the latter, there is now a growing and compelling literature to indicate that the cerebellum is important for cognition, and may indeed be important for the formation of internal models of cognitive processes [Ito, 2008; Ramnani, 2006]. Furthermore, the cerebellum appears to have a distinct functional topography associated with motor and cognitive task performance [Stoodley et al., 2012; Stoodley and Schmahmann, 2009]. The anterior cerebellum has been associated with motor performance, whereas Crus I in particular has been implicated in working memory as well as language function [Chen and Desmond, 2005b; E et al., 2014; Stoodley et al., 2012; Stoodley and Schmahmann, 2009].
Cerebellar morphology has been investigated in both pediatric and aging populations. The developmental literature has generally supported cerebellar growth trajectories that mirror concurrent cortical development [Tiemeier et al., 2010]. In healthy older adults, cerebellar volume is smaller, and longitudinal evidence indicates that this is due to volumetric shrinkage [e.g. Bernard and Seidler, 2013; Hoogendam et al., 2012a; Luft et al., 1999; Raz et al., 1998, 2000, 2001; for a recent review see Bernard and Seidler, 2014]. Although both the aging and child development literatures have investigated cerebellar volume, this has largely been through investigations of total cerebellar volume. Given the recent evidence to indicate a functional topography within the cerebellum [Stoodley et al., 2012; Stoodley and Schmahmann, 2009], it is important to investigate the cerebellum via a regional approach, particularly if we hope to better understand cerebellar‐behavioral relationships.
We recently did so in a distinct sample of young (18–30 years old) and older (65–80 years old) adults, demonstrating that there are regional age differences within the cerebellum with differential relationships with behavior in young and older adults [Bernard and Seidler, 2013]. However, these cross‐sectional findings focused on two very specific young and older adult age groups, and we did not investigate the critical intervening time of middle age nor did we look at individuals during adolescence. Indeed, our results indicated linear relationships between volume and age [Bernard and Seidler, 2013], but it may be the case that these patterns are nonlinear when adolescence and middle age are considered. Such an approach is important for understanding regional patterns of cerebellar development during this portion of the lifespan. Furthermore, although we investigated general cognitive function and working memory, our primary focus was on motor behavior. Regional cerebellar volume has been investigated during child and adolescent development [Tiemeier et al., 2010], but cross‐sectional investigation from adolescence to middle age is important for understanding regional cerebellar volume development and senescence, and for understanding the relationships with cognitive function. There remains a large gap in the literature with respect to regional cerebellar volume in middle age, particularly with respect to behavior. Thus, here we focused on understanding regional cerebellar volume from adolescence through late middle age, with a particular interest in middle age and cognitive function as this portion of the lifespan includes periods of development, but also the start of decline. This stands to provide a sorely needed perspective on cerebellar development and aging, and gives further insight into the role of this structure in cognition.
Using a large sample (N = 123) of adolescents and adults, ranging from age 12 to 65, we used a novel segmentation method to investigate region‐specific cerebellar volume and associations with cognitive function (spatial and verbal working memory, spatial and verbal learning, and processing speed) across a large cross‐section of human development. We hypothesized that different cerebellar subregions (anterior, posterior, Crus I, and vermis) would show differing relationships with age. Specifically, we hypothesized that the posterior cerebellum especially would follow a pattern consistent with prefrontal cortical development and change with aging, as suggested by Diamond [2000], and supported by the coupling of the posterior cerebellum with the prefrontal cortex [Bernard et al., 2012; Krienen and Buckner, 2009; Salmi et al., 2010]. That is, because the prefrontal cortex is one of the last cortical regions to reach maturity [cf., Casey et al., 2000] we expected that posterior cerebellar volume would also reach its peak volume later in adolescence. Additionally, we hypothesized that regional cerebellar volume would be associated with cognitive performance in a manner consistent with previous reports on the functional topography of the cerebellum [Stoodley et al., 2012; Stoodley and Schmahmann, 2009], particularly with respect to the laterality of spatial and verbal cognitive functions. That is, we expected tasks relying on verbal processing (verbal working memory and verbal learning) to be associated with lateral posterior regions of the right cerebellum (particularly Crus I), whereas those tasks relying on spatial processing (spatial working memory and spatial learning) were expected to be associated with the left cerebellar hemisphere. Finally, we predicted that digit‐symbol coding (a measure of processing speed), which has a large motor component, would be associated with anterior motor regions of the cerebellum.
MATERIALS AND METHODS
Participants
Healthy participants were recruited as part of an ongoing collaboration between Intermountain Neuroimaging Consortium sites at the University of Colorado Boulder and the Mind Research Network (Albuquerque, New Mexico). The Colorado sample contributed data from 45 participants, while the New Mexico sample contributed data from 95 participants, for a total of 140 participants (12–65 years old). All participants gave their informed consent, and for those under the age of 18, a parent or guardian provided consent. All procedures were reviewed and approved by the local institutional review board at the two respective institutions. At both sites, all participants were screened using a structured clinical interview to rule out any psychiatric illnesses, substance abuse, or dependence. Furthermore, all participants were healthy and free of any neurological disorder or insult. Although general information about occupation was collected for participants, specifics regarding the exact nature of work were not available, particularly as it may relate to use‐dependent plasticity. Eight participants were excluded from our analyses due to the inability to effectively and adequately normalize or segment their neuroimaging scans (see Structural MRI Scanning and Processing, below), seven individuals were excluded due to a lack of demographic information and neuropsychological assessments, and finally two were not scanned due to contraindications for the scanner environment (e.g., braces, piercings that could not be removed). The final sample used in our data analysis included 123 participants ranging in age from 12 to 65 years old (mean, standard deviation; 30.92 ± 13.69 years; 46 females). Figure 1 shows the breakdown of participants by age group. Additionally, within this sample of 123 individuals, 5 were left handed and 3 reported using both hands while the remaining 115 were right handed. Because of the small sample of left and mixed handed individuals we were unable to directly compare them to the rest of the sample. However, they were equally distributed across the age spectrum ranging from 18 to 62 years old. Within the general population it is estimated that approximately 10% of individuals are left and mixed handed [Hardyck and Petrinovich, 1977]. By including these individuals, who make up 6.5% of our total sample, we are investigating a sample that is generally more representative of the population as a whole.
Figure 1.
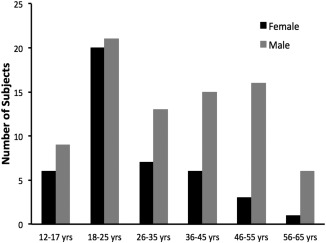
Distribution of participants by age group and sex.
Structural MRI Scanning and Processing
Structural brain images were acquired using matching parameters and on scanners of the same make and model at all testing locations (Siemens Tim Trio 3 Tesla). Structural images were acquired with a T1‐weighted 3D magnetization prepared rapid gradient multiecho sequence (MPRAGE; sagittal plane; repetition time [TR] = 2530 ms; echo times [TE] = 1.64 ms, 3.5 ms, 5.36 ms, 7.22 ms, 9.08 ms; GRAPPA parallel imaging factor of 2; 1 mm3 isomorphic voxels, 192 interleaved slices; FOV = 256 mm; flip angle = 7°; time = 6:03 min). A turbo spin echo proton density/T2‐weighted acquisition (axial oblique aligned with anterior commissure‐posterior commissure line; TR = 3720 ms; TE = 89 ms; GRAPPA parallel imaging factor 2; 0.9 × 0.9 mm voxels; FOV = 240 mm; flip angle: 120°; 77 interleaved 1.5 mm slices; time = 5:14 min) was acquired to check for incidental pathology. Data collected at the Mind Research Network were downloaded from the COllaborative Informatics and Neuroimaging Suite data exchange tool [COINS; http://coins.mrn.org/dx; Scott et al., 2011].
Lobular volume was calculated using the lobular regions as defined by the spatially unbiased infratentorial template (SUIT) atlas [Diedrichsen, 2006; Diedrichsen et al., 2009], and the methods parallel those previously used to investigate regional cerebellar volume in advanced age [Bernard and Seidler, 2013]. This allowed us to investigate specific hypotheses with respect to regional volume and both age and cognitive performance. Furthermore, it allowed us to put these results into context with comparable existing work using regional cerebellar volume in development and aging [Bernard and Seidler 2013; Tiemeier et al., 2010]. Individual lobular volumes of each subject were determined for all lobules in the right and left hemispheres, and the vermis. For all structural analyses, the original raw high‐resolution structural images were used. First, we created masks of each lobule and a mask for the whole cerebellum using the probabilistic SUIT atlas. Next, the cerebellum was extracted and separated from the rest of the brain using the SUIT toolbox [version 2.5.2; Diedrichsen, 2006; Diedrichsen et al., 2009] implemented in SPM8 (Welcome Department of Cognitive Neurology, London, UK; http://www.fil.ion.ucl.ac.uk). We masked the extracted anatomical image with the threshold classification map that was produced during the isolation process. This resulted in a high‐resolution image of the cerebellum, excluding all surrounding cortical matter. Third, the SUIT cerebellum template was normalized to each individual subject's cerebellar anatomical image (in native space) using Advanced Normalization Tools [Avants et al., 2008; Penn Image Computing & Science Lab, http://www.picsl.upenn.edu/ANTS/]. ANTS was used as the nonlinear warping as it has been shown to do better in comparison to more well‐known algorithms, such as those implemented in SPM [Klein et al., 2009]. The transformation was first applied to the SUIT cerebellum, and then the resulting warp vectors were applied to the individual lobular masks. The result was a mask of each lobule normalized to individual subject space for each participant.
Finally, these masks were loaded into MRICron (http://www.mccauslandcenter.sc.edu/mricro/mricron/index.html) and converted to volumes of interest. Volumes of interest were then overlaid onto each individual subject's structural scan and inspected to ensure accurate registration. We then used MRICron to calculate the descriptive statistics for each lobule, providing us with the gray matter volume of each lobule in cubic centimeters. To reduce multiple comparisons in our analyses, we calculated the regional volumes for the anterior cerebellum (lobules I‐VI), posterior cerebellum (Crus II‐lobule X), and Crus I, bilaterally, along with the vermis (Vermis VI‐Vermis X). These regional breakdowns were used previously by Bernard and Seidler [2013], and were defined based on principal component analysis (please see Supporting Information Figure 1). To ensure that the components also apply to our sample, we replicated the analysis in the individuals from 18 to 30 years old (N = 52), consistent with the young adult sample from Bernard and Seidler [2013]. In brief, all of the corrected volumes for each hemisphere and the vermis were entered into two separate analyses (left and right hemisphere separately) into SPSS. We used varimax rotation and investigated the rotated solutions. Please see Supporting Information Tables I and 2 for the results of these analyses. In general, they replicate the prior work, and further justify our use of these regional distinctions. Furthermore, the automated methods used here are similar to several recent additional automated methods [Park et al., 2014; Weier et al., 2014]. Both the total cerebellar volumes and lobular volumes here are consistent with those found with hand tracing and the automated methods used by Weier et al. [Weier et al., 2014].
Table 2.
Significant models of digit‐symbol coding performance, with hypothesized cerebellar regions in males
| Predictor variable | Beta | P |
|---|---|---|
| Digit symbol (right anterior): adjusted R 2 = 0.134, F (2,76) = 7.03, P = 0.002 | ||
| Age | −0.390 | 0.001 |
| Right anterior | −0.284 | 0.013 |
| Digit symbol (left anterior): adjusted R 2 = 0.167, F (2,76) = 8.80, P < 0.001 | ||
| Age | −0.409 | 0.001 |
| Left anterior | −0.342 | 0.003 |
| Digit symbol (vermis): adjusted R 2 = 0.107, F (2,76) = 5.68, P = 0.005 | ||
| Age | −0.395 | 0.001 |
| Vermis | −0.236 | 0.051 |
Two digit‐symbol models are presented for anterior regions as they were run separately to minimize issues of multicolinearity due to strong correlations between homologous regions across hemispheres.
Additionally, we calculated the estimated total intracranial volume (TIV) for all participants to normalize the cerebellar lobular volumes. We first segmented the gray matter, white matter, and cerebrospinal fluid using the segment function in SPM8. The voxel‐based morphometry (VBM8) toolbox (http://dbm.neuro.uni-jena.de/vbm/download/) was used to get the total volume for each of these tissue types, in each individual subject, in native space. Although we used raw anatomical images in our analyses, the segmentation algorithm includes corrections for image intensity inhomogeneities. Individual segmentations were visually inspected on each participant to ensure accurate segmentations. The volume of the gray matter, white matter, and cerebrospinal fluid were summed to get an estimated TIV for each individual. Recent work has indicated that the SPM8 segmentation method used here does not differ in the median TIV from that calculated using manual methods, and these values are highly correlated with one another [Ridgway et al., 2011]. Thus, this estimated TIV is a reasonable for normalizing regional cerebellar volumes. Normalized regional volumes were calculated by dividing the lobular volume by the estimated TIV. All regional volumes are expressed as a percentage of the TIV.
Cognitive Assessment
All participants completed a battery of standard cognitive tasks. All of the tasks used in this study fell into the domains that were previously linked to the cerebellar functional topography [Stoodley and Schmahmann 2009; Stoodley et al., 2012], with the exception of processing speed. Processing speed was included because of the large literature indicating age‐related decreases in this domain [e.g., Salthouse 1996]. Given our research interests, a priori hypotheses, and prior work linking cerebellar volume to performance [Eckert et al., 2010; Raz et al., 2000; Stoodley et al., 2012; Stoodley and Schmahmann, 2009], we focused on the following cognitive tests: symbol coding, Trails A, spatial span, letter‐number span, verbal learning (Hopkins verbal learning test‐revised; HVLT‐R), and spatial learning (brief visuospatial memory test‐revised; BVMT‐R). Specific administration methods for each test are all described in turn below. Finally, to serve as a proxy for general intelligence measures, the Boulder sample completed the Wide Range Achievement Test (WRAT). This provides a measure of general intelligence in adolescents and young adults [Wilkinson and Robertson, 2006] and was used give the younger age range of participants in this sample. In the Albuquerque sample, all participants completed the Wechsler Test of Adult Reading [Weschler, 2008]. Both of these tests use word and letter reading to assess general intelligence, but the WRAT has been designed for use in younger populations. Standard scoring on both tests results in an average score of 100. Both assessments are strongly correlated with intelligence assessed using the WAIS [Green et al., 2008; Johnstone et al., 1996; Whitney et al., 2010]. The scores in both samples were similar (mean ± standard deviation; Boulder: 104.72 ± 12.14; Albuquerque: 108.61 ± 13.03) and indicate that the participants were of average, or slightly better than average intelligence. In addition, all participants were highly educated, although the educational attainment was notably lower in the Boulder sample (Boulder: an average of 12 ± 2.38 years, range 6–15 years; Albuquerque: an average of 13.77 ± 1.69 years, range 10–18 years). This is due to the overall younger sample from the Boulder site, as many of the participants are still completing their education.
Symbol coding
Participants had 90 s to fill in nonsense symbols (provided in a key) with their corresponding number as quickly as possible [Wechsler, 1997]. We quantified the total number of symbols that were matched (maximum score of 110).
Trails A
Trails A [Reitan & Wolfson, 1985] assessed speed of processing and attention. Participants connected circles in numerical order, as quickly as possible, and we measured completion time. The experimenter pointed out errors, and the participant had to continue from the point of the error, resulting in a longer completion time.
Spatial span
Spatial span was assessed using the Corsi blocks, from the Wechsler Memory Scale [Wechsler, 1997]. Participants repeated sequences of taps using a board with 10 blocks. Two trials for each sequence length were completed. The sequence length was increased until the participant failed to repeat the sequence on both trials. The procedure was repeated with participant pointing to the boxes in the reverse order of their presentation. The sum of the forward and backward conditions was calculated and used in our analyses (range from 0 to 32).
Letter‐number span
Verbal working memory was assessed using letter‐number span. Participants repeated a list of letters and numbers numerically, and alphabetically, and the number of items increased across trials. Four trials at each level are completed, and the test was discontinued after the participant failed to correctly respond to all four trials at a particular level. Verbal working memory was quantified as the sum of all correct trials (maximum score, 24).
Hopkins verbal learning test‐revised
The HVLT‐R [Brandt, 1991] was used as a measure of verbal learning. Participants had to remember a list of words, and repeat them back to the experimenter, in any order. The entire procedure with the same list was repeated three times. The total recall score was added across all three trials.
Brief visuospatial memory test‐revised
We assessed spatial learning using the BVMT‐R [Benedict et al., 1996]. Participants were shown a sheet of paper with six figures and were given 10 s to study the display. After the display was removed, participants were asked to try to draw the figures just as they were shown on the page. This was repeated three times. Drawings were scored based on their accuracy as well as their location on the sheet of paper. The sum of the scores on all three trials was used in our analyses (maximum score of 36).
Statistical Analysis
All statistical analyses were performed using IBM SPSS 21 (IBM Corporation, Armonk, NY, 2012).
Cognitive performance and age
We investigated performance on the cognitive measures with respect to age using curve fitting in SPSS. Scatterplots were created and we used curve fitting to best determine any age‐related relationships (Fig. 2). In these analyses, we primarily used linear and quadratic fits, guided by investigating the scatterplots. In several cases, we also conducted additional post hoc models (primarily linear) and these are noted in the results.
Figure 2.
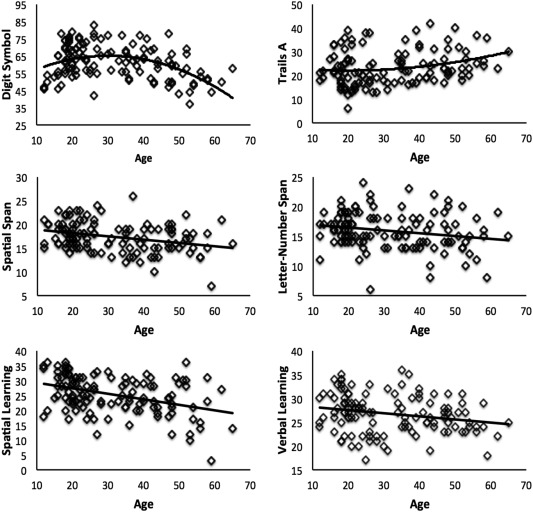
Relationships between cognitive performance and age for all six of the investigated tasks. All relationships with age were statistically significant. However, both measures of processing speed, digit‐symbol coding and Trails A were both significantly modeled using quadratic fits. All other relationships were linear. Digit symbol: total number of symbols; Trails A: time to complete (seconds); spatial span, letter‐number span, spatial learning, and verbal learning: total score across three trials.
Regional cerebellar volume and age
To investigate regional cerebellar volume with respect to age, from adolescence to late middle age, we used curve fitting in SPSS as we did with cognitive function. We also investigated the relationship between age and total cerebellar gray matter volume. Scatterplots of each group were used to guide our curve fitting. We primarily used linear and logarithmic fits to investigate relationships between regional cerebellar volume and age. However, for the posterior cerebellum, we used a quadratic fit given the patterns in the scatterplots, and our hypothesis that it would be comparable to the slower prefrontal cortical development patterns (Fig. 3). Again, in several cases, we also conducted additional post hoc models (primarily linear), noted in the results.
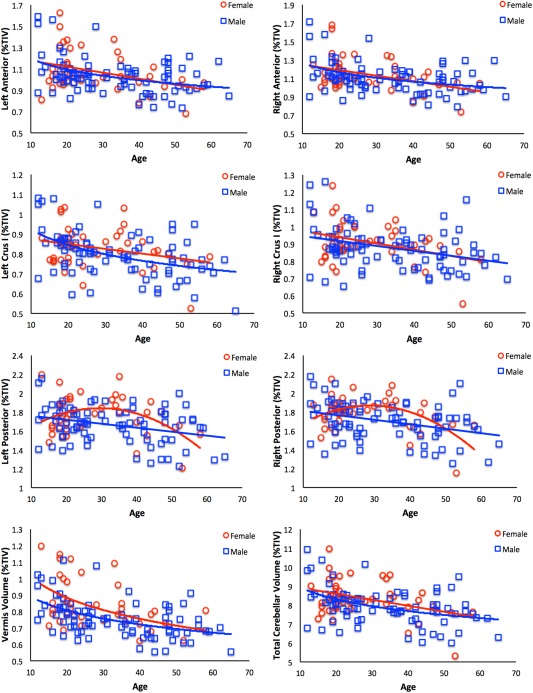
Figure 3.
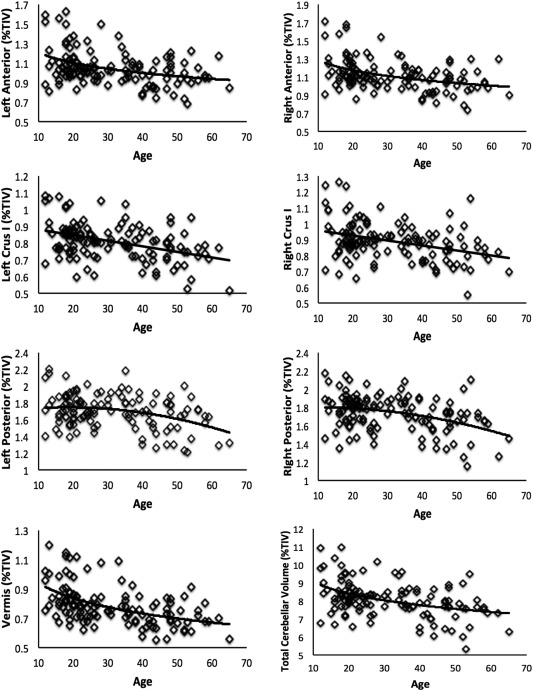
Relationships between regional cerebellar gray matter volume and age, as well as total cerebellar gray matter volume. All relationships with age were statistically significant. The anterior cerebellum was modeled with a logarithmic function, while Crus I was fit with a linear model, and the posterior cerebellum with a quadratic model. Like the anterior cerebellum, the cerebellar vermis was fit with a logarithmic model. Finally, total cerebellar volume was modeled with a logarithmic fit. However, a linear model fit the data equally well. We present the logarithmic fit here.
Regional cerebellar volume and cognitive performance from adolescence to middle age
Similar to the analysis approach taken by Bernard and Seidler [2013], we used multiple regression to investigate the relationships between regional cerebellar volume and cognitive performance, taking age into account. For all models, cognitive performance was the dependent variable, and regional volumes and age were the independent variables. Models for each cognitive assessment were created using a priori regions hypothesized to be associated with the assessment based on prior work investigating regional cerebellar volume, and the cerebellar functional topography [Bernard and Seidler, 2013; Stoodley et al., 2012; Stoodley and Schmahmann, 2009]. In all cases, we investigated the vermis, as vermal volume, in both superior and inferior regions, has been linked with several measures of cognitive function in older adulthood [MacLullich et al., 2004; Miller et al., 2013]. Furthermore, resting state networks of the vermis, particularly in lobules VI and Crus II are similar to those of their hemispheric counterparts. That is, they are associated with frontoparietal regions which are implicated in cognition [Bernard et al., 2012]. For all analyses, we investigated the vermis independently, and in cases where lobules from each hemisphere were hypothesized, the homologous lobules were investigated using separate regression models due to issues of multicolinearity. Cerebellar regions of the left and right hemisphere were considered separately, and in cases where we had specific hypotheses regarding laterality, only one hemisphere was investigated. Age was included in all models. In addition to age and vermis volume, we investigated cognitive performance with respect to volume in the following lobules: digit symbol and Trails A: left and right anterior cerebellum; letter‐number span and HVLT‐R: right anterior, right Crus I, right posterior; spatial span, and BVMT‐R: left Crus I, left posterior. Because of the a priori nature of our hypotheses and analyses, we did not apply a multiple comparisons correction.
Sex differences in cognitive and cerebellar relationships with age
Prior work has indicated that cerebellar volume in both development and senescence may differ between males and females [Raz et al., 2001; Rhyu et al., 1999; Tiemeier et al., 2010]. We, therefore, completed exploratory analyses relating cognitive performance and regional cerebellar volume with respect to age in males and females separately. Analysis procedures paralleled those described above. In addition, we investigated cognitive performance with respect to regional cerebellar volume using multiple regression in males and females. Due to the post hoc exploratory nature of these analyses, we used a Bonferroni correction for multiple comparisons for all analyses within each sex (P < 0.008 for the six cognitive tasks, and P < 0.007 for the seven cerebellar regions).
RESULTS
Cognitive Performance and Age
Scatterplots showing the associations between age and performance on all cognitive domains are presented in Figure 2. Importantly, ANCOVA models controlling for both age and education indicated that there are no significant differences on cognitive performance across the two locations on all measures (all Ps > 0.076) except verbal learning (F (1,121) = 4.15, P = 0.048). Processing speed, as measured by the digit‐symbol coding task, was fit using a quadratic model (R 2 = 0.198, F (2,118) = 14.61, P < 0.001). This “inverted‐U” pattern indicated an increase in performance through adolescence and young adulthood, with decreases in individuals starting after age 30. Trails A, which also indexes processing speed, was first modeled using a quadratic fit (R 2 = 0.061, F (2,115) = 3.75, P < 0.05), which indicated performance increases through adolescence, but decreases in participants approaching age 40. However, we also included a post hoc linear model. The linear model fit the data comparably well (R 2 = 0.054, F (1,116) = 6.63, P = 0.01), indicating linear increases in task completion time from adolescence to late middle age.
Both measures of working memory (letter‐number span and spatial span) were fit with linear models (letter‐number span: R 2 = 0.045, F (1,119) = 5.66, P < 0.05; spatial span: R 2 = 0.096, F (1,118) = 12.56, P = 0.001). For both domains, older participants had poorer working memory performance (shorter span length), and this pattern began in adolescence. Similarly, both measures of learning (HVLT‐R, verbal; BVMT‐R, spatial) were fit with linear models (HVLT‐R: R 2 = 0.05, F (1,119) = 6.29, P < 0.05; BVMT‐R: R 2 = 0.163, F (1,119) = 23.09, P < 0.001) indicating that performance decreased with age.
Regional Cerebellar Volume
Plots illustrating relationships between age and regional cerebellar volume are presented in Figure 3. Of note, an ANCOVA, controlling for age indicated that there are no differences in total cerebellar volume (as a percentage of TIV) when individuals from the two testing sites are compared (F (1,121) = 0.004, P = 0.952). Total cerebellar gray matter volume was significantly related with age using a logarithmic model (R 2 = 0.175, F (1,121) = 25.59, P < 0.001); however, the scatterplot indicated that a linear fit might also be appropriate. The post hoc linear fit was nearly identical to the logarithmic fit (R 2 = 0.175, F (1,121) = 25.67, P < 0.001). Broadly speaking however, adolescents have more cerebellar gray matter volume, and volume is smaller in young adult and middle‐aged individuals.
Vermis gray matter volume was modeled using a logarithmic fit (R 2 = 0.253, F (1,121) = 40.88, P < 0.001). Vermis volume is higher in adolescents, but is smaller in young adults, at which point the downward trend continues, but less rapidly. A similar logarithmic relationship with age was seen in both the left and right anterior cerebellum (left: R 2 = 0.145, F (1,121) = 20.45, P < 0.001; right: R 2 = 0.164, F (1,121) = 23.77, P < 0.001). However, the lateral region Crus I was fit using a linear model for both the right and left hemispheres, indicative of a more consistent rate of change when cross‐sectionally investigating individuals from adolescence to middle age (left: R 2 = 0.171, F (1,121) = 25.04, P < 0.001; right: R 2 = 0.129, F (1,121) = 17.84, P < 0.001). Finally, the posterior cerebellum was investigated. Here, the relationship between regional volume and age was significantly modeled using a quadratic fit, for both hemispheres (left: R 2 = 0.111, F (2,120) = 7.46, P = 0.001; right: R 2 = 0.137, F (2,120) = 9.54, P < 0.001). In this case, the pattern indicates that posterior cerebellar gray matter volume reaches its peak volume in adults around age 30 and in older participants volume is increasingly smaller.
Regional Cerebellar Volume and Cognitive Performance From Adolescence to Middle Age
We used multiple regression models to investigate the relationships between regional cerebellar volume and cognitive performance from adolescence to late middle age. Table 1 provides beta values and statistics for all models. The models investigating speed of processing measured with the digit‐symbol coding task (vermis, left, and right anterior) were all significant in predicting performance. However, for the vermis model, age was the only significant predictor (P = 0.001). In our model of the right anterior cerebellum, age was again significantly associated with performance, but there was also a strong trend indicating that the right anterior cerebellum was negatively associated with performance (P = 0.06). A similar trend‐level result was seen for the left anterior cerebellum (P = 0.1). That is, those with larger anterior cerebellar volume, when controlling for age, performed worse on the digit‐symbol coding task. Of the three parallel models investigating processing speed using the Trails A task, only age showed a significant association with performance. There were no relationships with regional cerebellar volume.
Table 1.
Multiple regression models relating regional cerebellar volume and cognition
| Predictor variable | Beta | P |
|---|---|---|
| Digit symbol | ||
| Vermis: adjusted R 2 = 0.078, F (2,118) = 6.06, P = 0.003 | ||
| Age | −0.344 | 0.001 |
| Vermis | −0.118 | 0.239 |
| Right anterior: adjusted R 2 = 0.094, F (2,118) = 7.21, P = 0.001 | ||
| Age | −0.353 | 0.001 |
| Right anterior | −0.175 | 0.064 |
| Left anterior: adjusted R 2 = 0.088, F (2,118) = 6.81, P = 0.002 | ||
| Age | −0.343 | 0.001 |
| Left anterior | −0.155 | 0.099 |
| Trails | ||
| Vermis: adjusted R 2 = 0.044, F (2,115) = 3.68, P = 0.028 | ||
| Age | 0.189 | 0.070 |
| Vermis | −0.090 | 0.388 |
| Right anterior: adjusted R 2 = 0.044, F (2,115) = 3.70, P = 0.028 | ||
| Age | 0.198 | 0.047 |
| Right anterior | −0.088 | 0.375 |
| Left anterior: adjusted R 2 = 0.040, F (2,115) = 3.44, P = 0.036 | ||
| Age | 0.213 | 0.031 |
| Left anterior | −0.052 | 0.594 |
| Spatial span | ||
| Vermis: adjusted R 2 = 0.081, F (2,117) = 6.23, P = 0.003 | ||
| Age | −0.306 | 0.003 |
| Vermis | 0.009 | 0.927 |
| Hemispheric regions: adjusted R 2 = 0.115, F (3,116) = 6.13, P = 0.001 | ||
| Age | −0.307 | 0.001 |
| Left Crus I | 0.227 | 0.096 |
| Left posterior | −0.303 | 0.021 |
| Spatial learning | ||
| Vermis: adjusted R 2 = 0.150, F (2,118) = 11.56, P < 0.001 | ||
| Age | −0.383 | <0.001 |
| Vermis | 0.041 | 0.667 |
| Hemispheric regions: adjusted R 2 = 0.157, F (3,117) = 8.43, P < 0.001 | ||
| Age | −0.435 | <0.001 |
| Left Crus I | 0.027 | 0.840 |
| Left posterior | −0.146 | 0.248 |
| Letter span | ||
| Vermis: adjusted R 2 = 0.031, F (2,118) = 2.89, P = 0.059 | ||
| Age | −0.193 | 0.061 |
| Vermis | 0.041 | 0.687 |
| Hemispheric regions: adjusted R 2 = 0.029, F (3,117) = 2.20, P = 0.092 | ||
| Age | −0.245 | 0.012 |
| Right Crus I | 0.008 | 0.956 |
| Right posterior | −0.102 | 0.501 |
| Verbal learning | ||
| Vermis: adjusted R 2 = 0.053, F (2,118) = 4.38, P = 0.015 | ||
| Age | −0.149 | 0.143 |
| Vermis | 0.157 | 0.124 |
| Hemispheric regions: adjusted R 2 = 0.037, F (3,117) = 2.56, P = 0.059 | ||
| Age | −0.191 | 0.049 |
| Right Crus I | 0.151 | 0.317 |
| Right posterior | −0.056 | 0.710 |
Spatial span and spatial learning (BVMT‐R) were modeled with the left posterior cerebellum and left Crus I, and separately with the vermis. For spatial span, the vermis model was significant, but within the model only the beta for age was significant. However, in the model including left posterior cerebellum and left Crus I, which was also significant, age was negatively associated with performance (P = 0.001), as was left posterior cerebellar volume (P < 0.05). Larger posterior cerebellar volume was associated with worse performance (shorter span). Additionally, there was a positive trend with left Crus I (P = 0.09) such that larger volume was indicative with better performance. Like spatial span, the vermis model for spatial learning assessed with the BVMT‐R was significant, but age was the only significant predictor. The model including left Crus I and left posterior volume was also significant, but none of the volumetric components were significant.
Letter‐number span and verbal learning (HVLT‐R) were modeled with the right posterior cerebellum and right Crus I, and separately with the vermis. Neither of the models of letter‐number span were significant, although the vermis model was trend level (adjusted R 2 = 0.03, F (2,118) = 2.89, P = 0.06). With respect to the HVLT‐R, the vermis model was significant, although none of the individual predictor betas themselves were significant. The model including right Crus I and posterior cerebellar volume was trend level (adjusted R 2 = 0.037, F (3,117) = 2.56, P = 0.059).
Sex Differences in Cognitive and Cerebellar Relationships With Age
To understand whether or not males and females show similar patterns in the relationships between age and both cognitive performance and regional cerebellar volume, as is the case during adolescence [Tiemeier et al., 2010], we completed additional exploratory analyses on males and females separately. However, we want to emphasize the exploratory nature of this analysis, particularly as the male and female sample sizes greatly differ between the two groups (n = 77 and 46 for males and females, respectively), and the female group is underpowered with respect to the male group. We will refer to these results with respect to the opposite sex but also in comparison to the results from the full group. Scatterplots of these relationships are presented in Figures 4 and 5.
Figure 4.
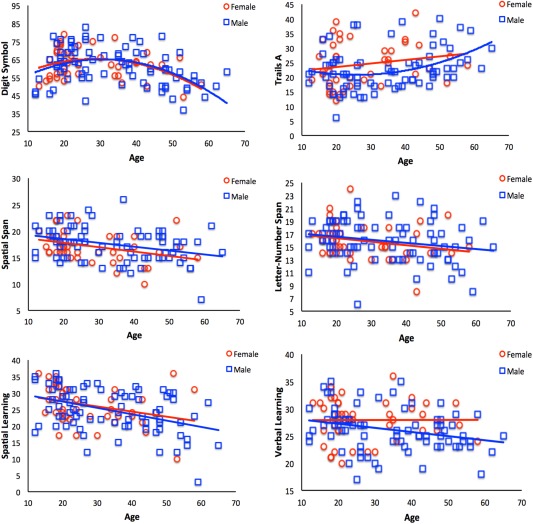
Cognitive performance with respect to age for females (red circles) and males (blue squares) separately. The relationships with digit‐symbol coding, spatial working memory (spatial span), and spatial learning were trend level in females, but were not significant after multiple comparisons. Trails A was not significantly associated with age in females. In males, the aforementioned relationships were significant. In both sexes, there were no significant relationships verbal working memory (letter‐number span) nor with verbal learning (although this relationship was trend level in males). Nonsignificant relationships and their associated trend lines are presented for the purpose of comparisons between the sexes, and with the whole‐group analyses presented in Figure 2. Digit symbol: total number of symbols; Trails A: time to complete (seconds); spatial span, letter‐number span, spatial learning, and verbal learning: total score across three trials.
Figure 5.
Regional cerebellar gray matter volume with respect to age for females (red circles) and males (blue squares) separately. In females, all of the relationships were at trend level, with the exception of the right posterior cerebellum, which was modeled with a quadratic fit. Furthermore, in the anterior models, although only trend level, linear fits best explained the relationships between age and gray matter volume. In males, the majority of the relationships were significant, with the exception of the posterior cerebellum, which was trend level, and best fit with a linear model. Nonsignificant relationships and their associated trend lines are presented for the purpose of comparisons between the sexes, and with the whole‐group analyses presented in Figure 3.
Cognitive Performance
Processing speed measured by the digit‐symbol coding task was significantly associated with age in males using a quadratic fit, much like our whole‐group analysis (R 2 = 0.211, F (2,76) = 10.18, P < 0.001; Fig. 4). However, in females, the relationship with age was only trend level after correcting for multiple comparisons (R 2 = 0.145, F (2,39) = 3.32, P = 0.047). Processing speed measured using the Trails A task was not significantly associated with age in females with a linear fit (R 2 = 0.037, F (1,40) = 1.55, P > 0.2) nor with a quadratic fit (R 2 = 0.056, F (2,39) = 1.15, P > 0.3). In males, there was a quadratic association with age (R 2 = 0.125, F (2,73) = 5.22, P = 0.008).
In the whole‐group analyses, both verbal and spatial working memory measures were fit with linear models. In females, after accounting for multiple comparisons (P < 0.008) there was a nonsignificant linear trend for spatial working memory (R 2 = 0.113, F (1,40) = 5.12, P = 0.029) while in males this relationship was significant (R 2 = 0.107, F (1,76) = 9.125, P < 0.003). Verbal working memory, although significant in the whole group, was not significant for either sex (in both cases, P > 0.06). Similarly, the learning measures also showed a linear relationship with age in the whole group. In females, the BVMT‐R (spatial learning) was related with age, but this was not significant after multiple comparisons correction (R 2 = 0.098, F (1,40) = 4.34, P < 0.05). In males, the relationship was significant (R 2 = 0.177, F (1,77) = 16.59, P < 0.001). When each sex was looked at individually, there were no significant relationships with the HVLT‐R (verbal learning) after multiple comparisons correction, although the relationship was trend level in males (females: R 2 = 0, F (1,40) = 0, P > 0.9; males: R 2 = 0.077, F (1,77) = 6.41, P = 0.013).
Regional Cerebellar Volume
Scatterplots of each region, divided by sex, are presented in Figure 5. Below, we report the uncorrected P‐values and note throughout whether or not they reach statistical significance using a Bonferroni correction. The Bonferroni correction used here requires P < 0.007 for statistical significance. Patterns of anterior cerebellar volume in females were again not significant with multiple comparisons correction, although the patterns do differ at trend level from those seen with the whole group. That is, linear fits were best for both the right and left anterior cerebellum in females (right anterior: R 2 = 0.162, F (1,40) = 7.72, P = 0.008; left anterior: R 2 = 0.122, F (1,40) = 5.54, P < 0.05). In males, like in the whole‐group analysis, relationships between anterior cerebellar volume and age were fit with a logarithmic function (right anterior: R 2 = 0.164, F (1,79) = 15.48, P < 0.001; left anterior: R 2 = 0.164, F (1,79) = 15.52, P < 0.001).
In the whole‐group analyses, Crus I was fit with a linear function. In females, this was not significant for the left hemisphere (R 2 = 0.081, F (1,40) = 3.52, P > 0.06), and trend level in the right hemisphere, although not significant after multiple comparisons correction (R 2 = 0.134, F (1,40) = 6.17, P = 0.017). In males, both relationships were significant (left Crus I: R 2 = 0.194, F (1,79) = 19.03, P < 0.001; right Crus I: R 2 = 0.113, F (1,79) = 10.02, P < 0.005). However, left Crus I in males was also investigated with a logarithmic fit, which better modeled the relationship between regional volume and age (R 2 = 0.214, F (1,79) = 21.49, P < 0.001). Right Crus I in males was also fit with a logarithmic function, but it was similar to the linear fit with respect to the proportion of variance that was explained (R 2 = 0.13, F (1,79) = 11.82, P = 0.001).
In females, the quadratic relationship between age and left posterior cerebellar volume was a nonsignificant trend after multiple comparisons correction (R 2 = 0.156, F (2,39) = 3.62, P = 0.036), although the relationship with the right posterior cerebellum was significant (R 2 = 0.259, F (2,39) = 6.83, P < 0.005). In males, both left and right posterior cerebella were associated with age using a quadratic fit, but only at the trend level (left: R 2 = 0.096, F (2,78) = 4.14, P = 0.019; right: R 2 = 0.115, F (2,78) = 5.06, P = 0.009). Interestingly however, in males, the bilateral posterior regions were also modeled with linear fits. For the left posterior cerebellum, this was highly similar to the quadratic fit (R 2 = 0.096; F (1,79) = 8.35, P = 0.005), and in the right posterior cerebellum, this relationship was also significant (R 2 = 0.114, F (1,79) = 10.21, P = 0.002).
Finally, we investigated relationships between age and total cerebellar gray matter volume and vermis volume in males and females separately. In females, after accounting for multiple comparisons the logarithmic relationship with total cerebellar gray matter volume was not significant (R 2 = 0.107, F (1,40) = 4.79, P = 0.03), and appears as although a linear fit may better describe the data, although this also did not reach significance after multiple comparisons correction (R 2 = 0.143, F (1,40) = 6.67, P = 0.01). However, in males, the logarithmic association with age was significant (R 2 = 0.185, F (1,79) = 17.92, P < 0.001). The logarithmic fits for vermis volume were significant in both sexes (females: R 2 = 0.232, F (1,40) = 12.05, P < 0.005; men: R 2 = 0.246, F (1,79) = 25.71, P < 0.001), consistent with the group results.
Age, Volume, and Performance in Females and Males
When we repeated the multiple regression models as described above, in females only, there were no significant relationships between cognitive performance and hypothesized regional cerebellar volume, after correction for multiple comparisons. However, in males, the models of digit‐symbol coding performance with both the left and right anterior cerebellum were significant (in both cases, P < 0.005), and the betas associated with regional cerebellar volume themselves were also significant. Just as we saw in the whole‐group analysis, the betas were negative, indicating that larger anterior cerebellar volume is associated with worse performance. Please see Table 2, for the full model information and beta values.
DISCUSSION
Here, using a fine‐grained regional approach to determining cerebellar volume, we characterized the regional volumetric patterns associated with age, from adolescence through late middle age. We did the same for a battery of theoretically relevant cognitive tasks and also investigated the relationships between regional cerebellar volume and cognitive performance over this segment of the lifespan. Our findings indicate that within the cerebellum, volumetric patterns with age vary regionally, such that anterior and vermal regions show logarithmic patterns indicative of a fast drop in volume between adolescence and young adulthood, with a slowing in volumetric differences from young adulthood through midlife. In contrast, the lateral lobule Crus I showed a negative linear relationship of consistent difference, and the posterior cerebellum follows an “inverted‐U” pattern. The latter pattern is indicative of continued volumetric gains through adolescence, peaking around age 30. Additionally, regional cerebellar volume was significantly associated with several cognitive variables, particularly processing speed and spatial working memory. Finally, we conducted exploratory follow‐up analyses of sex indicating that although males and females have relatively similar patterns between age and regional cerebellar volume, there may be differences with respect to the relationships between age, regional volume, and cognitive performance. Taken together, our results highlight the importance of investigating the cerebellum from a fine‐grained regional approach, and also shed important light on this structure from adolescence through middle age, the latter of which is relatively poorly understood. This work provides an important new perspective on cerebellar development and aging, taking into account the understudied period of middle age, and provides further evidence supporting a role for the cerebellum in cognition. A better understanding of cerebellar structure and its functional associations is important for understanding developmental pathology, as well as the cognitive and motoric declines associated with late life.
Cerebellar Structural Relationships With Age
Within the cerebellum, our results indicate different volumetric trajectories in the anterior, posterior, vermis, and Crus I regions. The anterior cerebellum and vermis follow a logarithmic pattern such that volume was largest in adolescents and dropped quickly during young adulthood. However, Crus I showed a linear pattern, whereas the posterior cerebellum was modeled with a quadratic fit with an “inverted‐U” pattern. As we hypothesized, the volumetric pattern of the posterior cerebellum seems to follow the protracted developmental pattern of the prefrontal cortex [Casey et al., 2000]. This finding is in accordance with the established coupling between the prefrontal cortex and posterior cerebellum (Bernard et al., 2012; Diamond, 2000; Krienen and Buckner, 2009; Salmi et al., 2010). However, it was somewhat surprising to see that Crus I showed a linear pattern, as opposed to the “inverted‐U” pattern as it is also part of the posterior cerebellum. This may be due to the functional role of Crus I, as well as the multifunctional lobules included in the posterior grouping in this study.
With that said, it is important to note that lobules VIIIa and VIIIb, included in this posterior region are often associated with motor function [Grodd et al., 2001]. However, the patterns of resting state connectivity of these lobules include prefrontal and more premotor regions as opposed to primary motor cortical connections [Bernard et al., 2012; Buckner et al., 2011], and it was recently suggested that this posterior motor representation serves different functions than the anterior cerebellar motor representation [Donchin et al., 2012]. Thus, although motor regions were included, their resting state associations with the prefrontal cortex and differing function suggest that they may show relationships with age that are more like the cognitive areas of this region, consistent with the quadratic posterior pattern seen here.
Overall, the differential relationships with age in other regions of the cerebellum highlight the notion that the cerebellum is not uniformly influenced by development and aging during adolescence and midlife. This finding is somewhat inconsistent with Ziegler et al. [2012] who showed a nonlinear relationship with age as measured using VBM in more anterior regions of the cerebellum. However, it is of note that their sample only looked at adulthood and later life, and they took a whole brain methodological approach, both of which may, at least in part, explain this difference.
The logarithmic relationships between cerebellar volume and age are consistent with normative development through adulthood, based on measures of the whole cerebellar hemispheres [Raz et al., 2005a]. Peak volume of the anterior region and total grey matter volume are reached during the early teen years and then begins to slowly decrease [Tiemeier et al., 2010]. The logarithmic pattern seen in our sample is likely capturing the start of these decreases, which continue during early adulthood, but eventually slow down. The linear relationship in Crus I is consistent with our prior work, although it is notable that we did not include middle age in our analyses [Bernard and Seidler, 2013]. To date, there has not been any work investigating Crus I in development, so its relationships with age are unclear. Together, our results provide important new information regarding the relationships between age and regional cerebellar volume during midlife, furthering prior results indicating smaller volume during later adulthood by demonstrating logarithmic and linear relationships with age [Bernard and Seidler, 2013; Raz et al., 2005a].
Cognitive Function and Relationships With Regional Cerebellar Volume
Consistent with prior work on cognitive function across the lifespan, we found eventual performance deficits across all of the cognitive tasks investigated, which relied on more fluid cognitive abilities [Craik and Bialystok, 2006; Schaie, 1994; Park et al., 2001; Willis and Schaie, 2005]. These negative linear relationships indicate very slowly decreasing performance from adolescence through middle age, and the inclusion of older adults would potentially indicate a relative plateau during midlife with a more precipitous drop‐off in performance during later life, consistent with prior findings [Willis and Schaie, 2005]. However, it is important to note that processing speed measures (digit‐symbol coding and Trails A) showed quadratic relationships with age indicative of increased performance, reaching a peak during the later 20s, followed by worse performance during middle age. This is consistent with developmental work showing increases in processing speed in children and adolescents [Kail, 1991] and declines in adulthood and later life [Salthouse, 1996]. Furthermore, we were unable to investigate the influence of education on these factors as all of the individuals in our sample are very highly educated. There was little variability, and those that were lower in education were younger and still enrolled in school. It certainly seems to be the case that education has an impact on cognitive function in later life [Ardila, 2000; Whalley et al., 2004] and understanding the interactions between age cognitive function, and education, especially during midlife is important for future work.
The close coupling between cerebellar and cerebral structural development, supported by our findings and those of others [Diamond, 2000; Lenroot et al., 2007; Tiemeier et al., 2010], is also important for understanding cognitive development. Interestingly, both processing speed and spatial working memory reach adult‐like maturity by mid adolescence [De Luca et al., 2003; Luciana et al., 2005; Luna et al., 2004], during the years when cerebellar volume is at its greatest [Tiemeier et al., 2010]. Thus, cerebellar development through adolescence and young adulthood is likely an important component to cognitive development, just as it may be important for declines in later life [Bernard and Seidler, 2014].
Importantly, we also found several associations between cognitive function and regional cerebellar volume, irrespective of age in our sample, providing key information regarding individual differences in performance with respect to brain anatomy, and further support for the role of the cerebellum in cognition. These relationships were relatively consistent with the known cerebellar functional topography with respect to the laterality of spatial processing and the anterior contributions to motor function (given the graphomotor contributions involved in processing speed) [Stoodley et al., 2012; Stoodley and Schmahmann, 2009]. However, we did not differentially test the laterality of these relationships, and thus only provide confirmatory evidence. Furthermore, these findings in general provide important information with respect to individual differences in performance and brain anatomy.
In several cases, the relationships between task performance and cerebellar volume were in the opposite direction of what we would have initially expected. Larger volume was associated with worse performance in several of our multiple regression models. In older and younger adults only, such counterintuitive findings were also seen [Bernard and Seidler, 2013]. Here, larger volume in the anterior cerebellum was associated with worse performance on the digit‐symbol coding task (processing speed), and larger left posterior cerebellum was associated with shorter spatial span. Post hoc follow‐up analyses of the posterior cerebellum, removing lobules VIIIa and VIIIb, which are associated with motor functions showed similar counterintuitive relationships, suggesting that the motor lobules are not driving this finding.
It seems to be the case that bigger is not better in the posterior cerebellum when it comes to cognitive performance. Similar findings have also been demonstrated in the hippocampus [Foster et al., 1999] where larger volume is associated with worse delayed recall. The authors suggest that there may be abnormal pruning in the hippocampus during development that results in these findings [Foster et al., 1999]. This type of counterintuitive finding belies the importance of in‐depth cross‐sectional studies, as they hold the potential to yield important new perspectives. It is possible that those with larger volume in the posterior aspects of the cerebellum did not go through a sufficient neural pruning process during development, which has adverse consequences for behavior and that is being seen here in our findings as well. However, our posterior region also includes cerebellar lobules that have been associated with the default mode network [Buckner et al., 2011], which shows decreased activity during task performance [Buckner et al., 2008]. While Buckner et al. [2011] linked both Crus I and Crus II to the default mode network, there are multiple studies linking these regions to task positive activation during cognitive tasks [Balsters et al., 2013; Chen and Desmond, 2005b; Stoodley et al., 2012] to also indicate strong involvement in task‐related processing. Additionally, prior resting state work has associated Crus I with frontoparietal networks [Bernard et al 2012], and this likely is contributing to some of the positive trends linking cognitive performance to Crus I volume. Crus II, however, is associated with the default mode network across studies [Buckner et al., 2011; Bernard et al., 2012], as was lobule IX. Lobule VIIb was also linked with association cortices [Buckner et al., 2011]. Given the strong presence of regions that are associated with the default mode network, it is possible that larger volume in this posterior cerebellar region is associated with the inability to deactivate these regions during task performance. This is certainly however speculative and future work would benefit from investigating these regions in association with internal mentation and mind wandering, both of which have been associated with the default mode network.
Finally, several multiple regression models evidenced significant associations with age but not regional cerebellar volume. We had initially expected to see relationships between these regions and performance in our sample. However, all of our participants were relatively high performing healthy individuals. One possibility is that the cerebellum is part of additional scaffolding relied on by older adults to maintain cognitive performance at higher levels [Park and Reuter‐Lorenz, 2009; Reuter‐lorenz and Park, 2010]. When individuals are performing well, they may not need to additionally rely on cerebellar regions for task performance, so small differences in regional volume may not yet be impacting performance.
Relatedly, we recently proposed that in advanced age, the structural changes in the cerebellum may result in dysfunctional and degraded internal models of behavior [Bernard and Seidler, 2014]. These internal model deficits may result in performance declines, as seen in the motor and cognitive domains in advanced age. Here, although regional cerebellar volumes are certainly smaller in the middle‐aged individuals, the internal models may be functioning well, such that these small morphological differences have not yet had an effect on behavior. As these individuals continue to age, the proposed internal models deficits will likely come into play.
Sex, Regional Cerebellar Volume, and Cognitive Function
During development, there are known sex differences in cerebellar volume trajectories [Tiemeier et al., 2010], and there is some evidence to indicate that this is also the case in aging [Raz et al., 2001; Rhyu et al., 1999], although more recent work has suggested that when controlling for TIV sex differences disappear in older adults (Jäncke et al., in press). As such, we completed exploratory post hoc analyses of sex to probe potential differences between males and females in regional cerebellar relationships with age, cognitive performance, and cerebellar‐behavior relationships. Primarily, we saw more linear relationships between age and regional volume in females, although the majority of these relationships were not statistically significant, perhaps in part due to a lack of statistical power. Furthermore, the quadratic relationships seen in the posterior cerebellum in the whole‐group analyses seem to be driven by females. Comparably, the patterns of cognitive performance were largely consistent, although often only trends in females. Cerebellar‐behavior relationships were not, however, found in females, although the relationship between regional volume, age, and processing speed was still seen in males. Thus, while there may not be any sex differences in volume in older adults when controlling for TIV (Jäncke et al., in press), males and females may still show different relationships between age and volume, particularly during adolescence and middle age, with an ultimate endpoint where later life volumes do not differ.
Two factors may contribute to the lack of significance in the females, and more moderate findings in males. First, it may be that we lacked power in the female sample, as it was about half the size of the male sample. In particular, we were especially lacking in older females (Fig. 1). Given this, our findings with respect to sex should in general be interpreted with caution. With that said, this is likely not the only contributing factor. We also must consider hormonal differences, and the potential impact of menopause and perimenopause, which is certainly a factor in our sample. During development, puberty impacts subcortical brain development [Goddings et al., 2013], and may contribute to the sex differences in cerebellar development [Tiemeier et al., 2010]. In older women, hormone replacement therapy postmenopause is associated with differences in brain volume, and may help prevent volumetric loss associated with menopause [Erickson et al., 2005; Erickson et al., 2007; Resnick et al., 2009]. In our sample, we did not have measures of menopausal status or hormone replacement usage and were, therefore, unable to address this interesting question. Future work investigating the cerebellum in midlife and later life would benefit from taking into account perimenopause and menopause, along with hormone replacement therapy to better understand their potential impact on this important brain structure. Furthermore, studies with matched sample sizes of males and females, as well as larger samples of older females are also necessary to better understand these findings, and mitigate potential concerns with respect to statistical power.
Limitations
There are several important limitations to this work that need to be considered. First, we used methods and regions based on our a priori hypotheses regarding regional volume and cognition. Other methods, such as VBM, would allow for a more data driven comparison of differences and would not be confined to our predefined search space (in this case, cerebellar regions). Future work taking advantage of VBM would aid our understanding of cerebellar volume and its relationships with age and cognition, and may further refine our knowledge regarding these associations.
Second, the data in this study were collected as part of a larger investigation into cognition and psychopathology, and therefore, cognitive measures were the focus of data collection. Although the Boulder sample does have some measures of motor performance and learning, this is only available for younger individuals. Prior work has implicated regional cerebellar volume in motor performance [Bernard and Seidler, 2013], and future work would benefit from investigating larger batteries of motor and cognitive function in one study. Relatedly, all of the participants here were age‐matched to a clinical population, and as such we did not have any individuals over the age of 65. However, the investigation of adolescence and middle age are especially important for understanding cerebellar development and senescence, and as such this work answers key open questions related to the relationships between regional cerebellar volume and age during this portion of the lifespan. Although we would expect to see additional declines in both volume and cognitive function in those over age 65, existing work allows us to infer further declines. Future work, especially longitudinal work including the whole lifespan, is however warranted. Additionally, this resulted in an oversampling of the 18–25 year old cohort. Although we were primarily interested in models with respect to age as opposed to age group comparisons, studies with larger older samples or more balanced sampling are needed to further investigate and confirm the patterns with age shown here.
In addition, we did not collect information related to advanced expertise and only have very basic data regarding occupation in our participants. An interesting body of literature on use dependent plasticity has indicated that there are changes in sensorimotor structures in musicians [e.g., Imfeld et al. 2009] and professional athletes [Hänggi et al., 2010]. Cerebellar volume may be impacted by such expertise, or perhaps above average intellectual/cognitive capabilities. Indeed in piano expert piano players, cerebellar volume is larger in comparison to controls [Hutchinson et al., 2003]. However, the investigations showing volumetric differences in skilled populations are typically looking at professionals with years of consistent practice and experience. Although many of our participants have likely had some sports or musical experience, it is highly unlikely that we have the number of participants with the extensive experience described in prior work looking at expertise [e.g., Imfeld et al 2009; Hänggi et al 2010] to have the power to detect such differences. Furthermore, many of our younger participants have not had time to reach such levels of expertise. This may introduce additional noise into our analyses, but it is unlikely that this is significantly impacting our results.
We did include a small sample of left and mixed handed individuals in our sample. Prior work has indicated cerebellar asymmetries in left and right‐handed individuals [Good et al., 2001; Snyder et al., 1995], although there are no handedness differences in cerebellar volume [Snyder et al., 1995]. Given that only eight people were either left or mixed handed, we did not statistically compare their volumes to the right‐handed sample due to issues of power. Numerically, the left and mixed handed group shows a smaller total cerebellar volume (corrected for total intracranial volume), but this was a difference of 0.5% volume, and the standard deviation of the right‐handed group was large (mean ± SD; right handed: 8.11 ± 1.01%; left handed: 7.65 ± 0.67%). Because we were interested in the relationships between regional volume and age/cognition, and are not doing direct comparisons of volume across groups, this small number of left/mixed handed individuals likely has little impact on our findings. Additionally, it adds to the representative nature of our sample, as approximately 10% of the population is left or mixed handed [Hardyck and Petrinovich, 1977], thus our sample is roughly consistent with the population as a whole.
Finally, it is of note that we used nonlinear models in many of our analyses, based largely off of our qualitative assessment of the data patterns. The fits used were chosen based on two factors. First, we consulted the existing literature in both adolescence and advanced age [e.g., Raz et al., 2005a, 2005b; Tiemeier et al., 2010; Ziegler et al., 2012]. These investigations indicated that there are likely nonlinear associations with age and the cerebellum during adolescence and across the adult lifespan. During development in particular, the posterior aspects of the cerebellum show a nonlinear increase (inverse‐U pattern). Coupled with the suggestion that the posterior cerebellum tracks the slower development of the prefrontal cortex [Diamond, 2000], we investigated the posterior cerebellum with a quadratic function. Although Ziegler et al. [2012] found nonlinear associations with the anterior cerebellum, multiple studies by Raz et al. [2005a, b, 2010] indicated that the volume of the cerebellar hemispheres shows a linear relationship with age. As such, this was applied to the anterior cerebellum and Crus I. We also based our decisions on our qualitative assessments of the patterns of data, which is more arbitrary and may induce bias. Whether or not these fits differ significantly in terms of variance explained from a linear fit is interesting to consider, but it is also important to note that these patterns do not appear linear indicating that in most cases the fits would not be ideal. We did, however, complete exploratory assessments of linear models in cases where we initially used nonlinear fits, and comparisons of the models indicate that there are no significant differences across the fits. Although this does not show that one fit is statistically better than the other, the fact that both models are significant (which was the case for the linear models) indicates that at a more basic level we are reporting noteworthy effects. However, in most cases the models we used originally accounted for a larger degree of variance than linear models (typically between 2 and 3% more variance was explained). With that said, although we see differential volume‐age relationships across the regions investigated, these findings should be considered cautiously as linear models also provide reasonable and statistically comparable fits.
Conclusions
Using a sensitive anatomical method to investigate regional cerebellar volume, we found that from adolescence to late middle age regional cerebellar volume relationships with age differ regionally. Furthermore, we characterized age‐related patterns of performance on a variety of cognitive tasks and provided further evidence that the cerebellum contributes to cognitive performance in a regionally specific manner across the lifespan. Taken together, these results represent an important step in characterizing the cerebellum and its role in cognitive function over a large portion of the lifespan. This understanding of regional volume‐age relationships and their relationship to cognition has important implications for our understanding of normal development and aging but may also serve as a key reference point for investigations into developmental and age‐related pathology.
Supporting information
Supplementary Information
Supplementary Information
REFERENCES
- Ardila A (2000): Age‐related cognitive decline during normal aging: The complex effect of education. Arch Clin Neuropsychol 15:495–513. [PubMed] [Google Scholar]
- Avants BB, Epstein CL, Grossman M, Gee JC (2008): Symmetric diffeomorphic image registration with cross‐correlation: Evaluating automated labeling of elderly and neurodegenerative brain. Med Image Anal 12:26–41. [DOI] [PMC free article] [PubMed] [Google Scholar]
- Balsters JH, Whelan CD, Robertson IH, Ramnani N (2013): Cerebellum and cognition: Evidence for the encoding of higher order rules. Cereb Cortex 23:1433–1443. [DOI] [PubMed] [Google Scholar]
- RH Benedict, D Schrelten, L Groninger, M Dobraski, B Shpritz (1996): Revision of the brief visuospatial memory test: studies of normal performance, reliability, and validity. Psychol Assessment 8:145–153. [Google Scholar]
- Bernard JA, Seidler RD (2013): Relationships between regional cerebellar volume and sensorimotor and cognitive function in young and older adults. Cerebellum 12:721–737. [DOI] [PMC free article] [PubMed] [Google Scholar]
- Bernard JA, Seidler RD (2014): Moving forward: Age effects on the cerebellum underlie cognitive and motor declines. Neurosci Biobehav Rev 42:193–207. [DOI] [PMC free article] [PubMed] [Google Scholar]
- Bernard JA, Seidler RD, Hassevoort KM, Benson BL, Welsh RC, Wiggins JL, Jaeggi SM, Buschkuehl M, Monk CS, Jonides J, Peltier SJ (2012): Resting state cortico‐cerebellar functional connectivity networks: A comparison of anatomical and self‐organizing map approaches. Front Neuroanat 6:31. [DOI] [PMC free article] [PubMed] [Google Scholar]
- Brandt J (1991): The Hopkins verbal learning test: development of a new memory test with six equivalent forms. The clinical neuropsychologist 5:125–142. [Google Scholar]
- Buckner RL, Andrews‐Hanna JR, Schacter DL (2008): The brain's default network: Anatomy, function, and relevance to disease. Ann N Y Acad Sci 1124:1–38. [DOI] [PubMed] [Google Scholar]
- Buckner RL, Krienen FM, Castellanos A, Diaz JC, Yeo BTT (2011): The organization of the human cerebellum estimated by intrinsic functional connectivity J Neurophysiol 106:2322–2345. [DOI] [PMC free article] [PubMed] [Google Scholar]
- Casey BJ, Giedd JN, Thomas KM (2000): Structural and functional brain development and its relation to cognitive development. Biol Psychol 54:241–257. [DOI] [PubMed] [Google Scholar]
- Chen SHA, Desmond JE (2005a): Temporal dynamics of cerebro‐cerebellar network recruitment during a cognitive task. Neuropsychologia 43:1227–1237. [DOI] [PubMed] [Google Scholar]
- Chen SHA, Desmond JE (2005b): Cerebrocerebellar networks during articulatory rehearsal and verbal working memory tasks. Neuroimage 24:332–338. [DOI] [PubMed] [Google Scholar]
- Craik FIM, Bialystok E (2006): Cognition through the lifespan: Mechanisms of change. Trends Cogn Sci 10:131–138. [DOI] [PubMed] [Google Scholar]
- CR De Luca, SJ Wood, V Anderson, J‐A Buchanan, TM Proffitt, K Mahony, C Pantelis (2003): Normative data from the Cantab. I: Development of executive function over the lifespan. Journal of Clinical and Experimental Neuropsychology 25:242–254. [DOI] [PubMed] [Google Scholar]
- Diamond A (2000): Close interrelation of motor development and cognitive development and of the cerebellum and prefrontal cortex. Child Dev 71:44–56. [DOI] [PubMed] [Google Scholar]
- Diedrichsen J (2006): A spatially unbiased atlas template of the human cerebellum. Neuroimage 33:127–138. [DOI] [PubMed] [Google Scholar]
- Diedrichsen J, Balsters JH, Flavell J, Cussans E, Ramnani N (2009): A probabilistic MR atlas of the human cerebellum. Neuroimage 46:39–46. [DOI] [PubMed] [Google Scholar]
- Donchin O, Rabe K, Diedrichsen J, Lally N, Schoch B, Gizewski ER, Timmann D (2012): Cerebellar regions involved in adaptation to force field and visuomotor perturbation. J Neurophysiol 107:134–147. [DOI] [PubMed] [Google Scholar]
- E KH, Chen SH, Ho MH, Desmond JE (2014): A meta‐analysis of cerebellar contributions to higher cognition from PET and fMRI studies. Hum Brain Mapp 35:593–615. [DOI] [PMC free article] [PubMed] [Google Scholar]
- Eckert MA, Keren NI, Roberts DR, Calhoun VD, Harris KC (2010): Age‐related changes in processing speed: Unique contributions of cerebellar and prefrontal cortex. Front Hum Neurosci 4:10. [DOI] [PMC free article] [PubMed] [Google Scholar]
- Erickson KI, Colcombe SJ, Raz N, Korol DL, Scalf P, Webb A, Cohen NJ, McAuley E, Kramer AF (2005): Selective sparing of brain tissue in postmenopausal women receiving hormone replacement therapy. Neurobiol Aging 26:1205–1213. [DOI] [PubMed] [Google Scholar]
- Erickson KI, Colcombe SJ, Elavsky S, McAuley E, Korol DL, Scalf PE, Kramer AF (2007): Interactive effects of fitness and hormone treatment on brain health in postmenopausal women. Neurobiol Aging 28:179–185. [DOI] [PubMed] [Google Scholar]
- Foster JK, Meikle A, Goodson G, Mayes a R, Howard M, Sünram SI, Cezayirli E, Roberts N (1999): The hippocampus and delayed recall: Bigger is not necessarily better? Memory 7:715–732. [DOI] [PubMed] [Google Scholar]
- Goddings A‐L, Mills KL, Clasen LS, Giedd JN, Viner RM, Blakemore S‐J(2013): The influence of puberty on subcortical brain development. Neuroimage 88:242–251. [DOI] [PMC free article] [PubMed] [Google Scholar]
- Good CD, Johnsrude I, Ashburner J, Henson RN, Friston KJ, Frackowiak RS (2001): Cerebral asymmetry and the effects of sex and handedness on brain structure: A voxel‐based morphometric analysis of 465 normal adult human brains. Neuroimage 14:685–700. [DOI] [PubMed] [Google Scholar]
- Green REA, Melo B, Christensen B, Ngo L‐A, Monette G, Bradbury C (2008): Measuring premorbid IQ in traumatic brain injury: An examination of the validity of the Wechsler Test of Adult Reading (WTAR). J Clin Exp Neuropsychol 30:163–172. [DOI] [PubMed] [Google Scholar]
- Grodd W, Hülsmann E, Lotze M, Wildgruber D, Erb M (2001): Sensorimotor mapping of the human cerebellum: fMRI evidence of somatotopic organization. Hum Brain Mapp 13:55–73. [DOI] [PMC free article] [PubMed] [Google Scholar]
- Hänggi J, Koeneke S, Bezzola L, Jäncke L (2010): Structural neuroplasticity in the sensorimotor network of professional female ballet dancers. Hum Brain Mapp 31:1196–1206. [DOI] [PMC free article] [PubMed] [Google Scholar]
- Hardyck C, Petrinovich LF (1977): Left‐handedness. Psychol Bull 84:385–404. [PubMed] [Google Scholar]
- Hoogendam YY, van der Geest JN, van der Lijn F, van der Lugt A, Niessen WJ, Krestin GP, Hofman A, Vernooij MW, Breteler MMB, Ikram MA (2012): Determinants of cerebellar and cerebral volume in the general elderly population. Neurobiol Aging 33:2774–2781. [DOI] [PubMed] [Google Scholar]
- Hutchinson S, Lee LH, Gaab N (2003): Cerebellar Volume of Musicians. Cereb Cortex 13:943–949. [DOI] [PubMed] [Google Scholar]
- Imfeld A, Oechslin MS, Meyer M, Loenneker T, Jancke L (2009): White matter plasticity in the corticospinal tract of musicians: A diffusion tensor imaging study. Neuroimage 46:600–607. [DOI] [PubMed] [Google Scholar]
- Ito M (2008): Control of mental activities by internal models in the cerebellum. Nat Rev Neurosci 9:304–313. [DOI] [PubMed] [Google Scholar]
- Jäncke L, Mérillat S, Liem F, Hänggi J: Brain size, sex, and the aging brain (in press). DOI: 10.1002/hbm.22619. [DOI] [PMC free article] [PubMed]
- Johnstone B, Callahan CD, Kapila CJ, Bouman DE (1996): The comparability of the WRAT‐R reading test and NAART as estimates of premorbid intelligence in neurologically impaired patients. Arch Clin Neuropsychol 11:513–519. [PubMed] [Google Scholar]
- Kail R (1991): Developmental change in speed of processing during childhood and adolescence. Psychol Bull 109:490–501. [DOI] [PubMed] [Google Scholar]
- Kanai R, Rees G (2011): The structural basis of inter‐individual differences in human behaviour and cognition. Nat Rev Neurosci 12:231–242. [DOI] [PubMed] [Google Scholar]
- Klein A, Andersson J, Ardekani BA, Ashburner J, Avants B, Chiang M‐C, Christensen GE, Collins DL, Gee J, Hellier P, Song JH, Jenkinson M, Lepage C, Rueckert D, Thompson P, Vercauteren T, Woods RP, Mann JJ, Parsey R V (2009): Evaluation of 14 nonlinear deformation algorithms applied to human brain MRI registration. Neuroimage 46:786–802. [DOI] [PMC free article] [PubMed] [Google Scholar]
- Krienen FM, Buckner RL (2009): Segregated fronto‐cerebellar circuits revealed by intrinsic functional connectivity. Cereb Cortex 19:2485–2497. [DOI] [PMC free article] [PubMed] [Google Scholar]
- Leiner HC, Leiner AL, Dow RS (1989): Reappraising the cerebellum: What does the hindbrain contribute to the forebrain? Behav Neurosci 103:998–1008. [DOI] [PubMed] [Google Scholar]
- Leiner HC, Leiner AL, Dow RS (1993): Cognitive and language functions of the human cerebellum. Trends Neurosci 16:444–447. [DOI] [PubMed] [Google Scholar]
- RK Lenroot, N Gogaty, DK Greenstein, EM Wells, GL Wallace, LS, Clasen et al. (2007): Sexual dimorphism of brain developmental trajectories during childhood and adolescence. NeuroImage 36:1065–1073. [DOI] [PMC free article] [PubMed] [Google Scholar]
- M Luciana, HM Conklin, CJ Hooper, RS Yarger (2005): The development of nonverbal working memory and executive control processes in adolescents. Child Development 76:697–712. [DOI] [PubMed] [Google Scholar]
- B Luna, KE Garver, TA Urban, NA Lazar, JA Sweeney (2004): Maturation of cognitive processes from late childhood to adulthood. Child Development 75:1357–1372. [DOI] [PubMed] [Google Scholar]
- Luft AR, Skalej M, Schulz JB, Kolb R, Bürk K, Klockgether T (1999): Patterns of Age‐related Shrinkage in Cerebellum and Brainstem Observed In Vivo Using Three‐dimensional MRI Volumetry. Cereb Cortex 9:712–721. [DOI] [PubMed] [Google Scholar]
- Ly M, Canu E, Xu G, Oh J, McLaren DG, Dowling NM, Alexander AL, Sager MA, Johnson SC, Bendlin BB (2014): Midlife measurements of white matter microstructure predict subsequent regional white matter atrophy in healthy adults. Hum Brain Mapp 35:2044–2054. [DOI] [PMC free article] [PubMed] [Google Scholar]
- MacLullich AMJ, Edmond CL, Ferguson KJ, Wardlaw JM, Starr JM, Seckl JR, Deary IJ (2004): Size of the neocerebellar vermis is associated with cognition in healthy elderly men. Brain Cogn 56:344–348. [DOI] [PubMed] [Google Scholar]
- Miller TD, Ferguson KJ, Reid LM, Wardlaw JM, Starr JM, Seckl JR, Deary IJ, Maclullich AMJ (2013): Cerebellar vermis size and cognitive ability in community‐dwelling elderly men. Cerebellum 12:68–73. [DOI] [PubMed] [Google Scholar]
- Park DC, Reuter‐Lorenz PA (2009): The adaptive brain: Aging and neurocognitive scaffolding. Annu Rev Psychol 60:173–196. [DOI] [PMC free article] [PubMed] [Google Scholar]
- Park DC, Polk TA, Mikels JA, Taylor SF, Marshu (2001): Cerebral aging: Integration of brain and behavioral models of cognitive function. Dialogues Clin Neurosci 3:151–165. [DOI] [PMC free article] [PubMed] [Google Scholar]
- Park MTM, Pipitone J, Baer LH, Winterburn JL, Shah Y, Chavez S, Schira MM, Lobaugh NJ, Lerch JP, Voineskos AN, Chakravarty MM (2014): Derivation of high‐resolution MRI atlases of the human cerebellum at 3T and segmentation using multiple automatically generated templates. Neuroimage 95C:217–231. [DOI] [PubMed] [Google Scholar]
- Ramnani N (2006): The primate cortico‐cerebellar system: Anatomy and function. Nat Rev Neurosci 7:511–522. [DOI] [PubMed] [Google Scholar]
- Raz N, Dupuis JH, Briggs SD, McGavran C, Acker JD (1998): Differential effects of age and sex on the cerebellar hemispheres and the vermis: A prospective MR study. AJNR Am J Neuroradiol 19:65–71. [PMC free article] [PubMed] [Google Scholar]
- Raz N, Williamson A, Gunning‐Dixon F, Head D, Acker JD (2000): Neuroanatomical and cognitive correlates of adult age differences in acquisition of a perceptual‐motor skill. Microsc Res Tech 51:85–93. [DOI] [PubMed] [Google Scholar]
- Raz N, Gunning‐Dixon F, Head D, Williamson A, Acker JD (2001): Age and sex differences in the cerebellum and the ventral pons: A prospective MR study of healthy adults. AJNR Am J Neuroradiol 22:1161–1167. [PMC free article] [PubMed] [Google Scholar]
- Raz N, Lindenberger U, Rodrigue KM, Kennedy KM, Head D, Williamson A, Dahle C, Gerstorf D, Acker JD (2005a): Regional brain changes in aging healthy adults: General trends, individual differences and modifiers. Cereb Cortex 15:1676–1689. [DOI] [PubMed] [Google Scholar]
- Raz N, Lindenberger U, Rodrigue KM, Kennedy KM, Head D, Williamson A, Dahle C, Gerstorf D, Acker JD (2005b): Regional brain changes in aging healthy adults: General trends, individual differences and modifiers. Cereb Cortex 15:1676–1689. [DOI] [PubMed] [Google Scholar]
- RM Reita, D Wolfson (1985): The Halstead‐Reitan neuropsychological test batter: Theory and clinical interpretation. Tuscon, AZ: Neuropsychology Press. [Google Scholar]
- Resnick SM, Espeland MA, Jaramillo S a, Hirsch C, Stefanick ML, Murray a M, Ockene J, Davatzikos C (2009): Postmenopausal hormone therapy and regional brain volumes: The WHIMS‐MRI Study. Neurology 72:135–142. [DOI] [PMC free article] [PubMed] [Google Scholar]
- Reuter‐lorenz PA, Park DC (2010): Human neuroscience and the aging mind: A new look at old problems. J Gerontol Psychol Sci 65B:405–415. [DOI] [PMC free article] [PubMed] [Google Scholar]
- Rhyu IJ, Cho TH, Lee NJ, Uhm CS, Kim H, Suh YS (1999): Magnetic resonance image‐based cerebellar volumetry in healthy Korean adults. Neurosci Lett 270:149–152. [DOI] [PubMed] [Google Scholar]
- Ridgway G, Barnes J, Pepple T, Fox N (2011): Estimation of total intracranial volume: A comparison of methods. Alzheimer's Dement J Alzheimer's Assoc 7:S62–S63. [Google Scholar]
- Salmi J, Pallesen KJ, Neuvonen T, Brattico E, Korvenoja A, Salonen O, Carlson S (2010): Cognitive and motor loops of the human cerebro‐cerebellar system. J Cogn Neurosci 22:2663–2676. [DOI] [PubMed] [Google Scholar]
- Salthouse TA (1996): The processing‐speed theory of adult age differences in cognition. Psychol Rev 103:403–428. [DOI] [PubMed] [Google Scholar]
- Schaie KW (1994): The course of adult intellectual development. Am Psychol 49:304–313. [DOI] [PubMed] [Google Scholar]
- Scott A, Courtney W, Wood D, de la Garza R, Lane S, King M, Wang R, Roberts J, Turner J a, Calhoun VD (2011): COINS: An innovative informatics and neuroimaging tool suite built for large heterogeneous datasets. Front Neuroinform 5:33. [DOI] [PMC free article] [PubMed] [Google Scholar]
- Snyder PJ, Bilder RM, Wu H, Bogerts B, Lieberman JA (1995): Cerebellar volume asymmetries are related ot handedness: A quantitative MRI study. Neuropsychologia 33:407–419. [DOI] [PubMed] [Google Scholar]
- Stoodley CJ, Schmahmann JD (2009): NeuroImage functional topography in the human cerebellum: A meta‐analysis of neuroimaging studies. Neuroimage 44:489–501. [DOI] [PubMed] [Google Scholar]
- Stoodley CJ, Valera EM, Schmahmann JD (2012): Functional topography of the cerebellum for motor and cognitive tasks: An fMRI study. Neuroimage 59:1560–1570. [DOI] [PMC free article] [PubMed] [Google Scholar]
- Tamnes CK, Walhovd KB, Grydeland H, Holland D, Østby Y, Dale AM, Fjell AM (2013): Longitudinal working memory development is related to structural maturation of frontal and parietal cortices. J Cogn Neurosci 25:1611–1623. [DOI] [PubMed] [Google Scholar]
- Tiemeier H, Lenroot RK, Greenstein DK, Tran L, Pierson R, Giedd JN (2010): NeuroImage Cerebellum development during childhood and adolescence: A longitudinal morphometric MRI study. Neuroimage 49:63–70. [DOI] [PMC free article] [PubMed] [Google Scholar]
- Weier K, Fonov V, Lavoie K, Doyon J, Collins DL (2014): Rapid automatic segmentation of the human cerebellum and its lobules (RASCAL)‐Implementation and application of the patch‐based label‐fusion technique with a template library to segment the human cerebellum. Hum Brain Mapp 35:5026–5039. [DOI] [PMC free article] [PubMed] [Google Scholar]
- Wechsler D (1997): Wechsler Adult Intelligence Scale, 3rd ed (WAIS–III). San Antonio, TX: The Psychological Corporation. [Google Scholar]
- Wechsler D (2008): Wechsler adult intelligence scale–Fourth Edition (WAIS‐IV). San Antonio, TX: NCS Pearson. [Google Scholar]
- Whalley LJ, Deary IJ, Appleton CL, Starr JM (2004): Cognitive reserve and the neurobiology of cognitive aging. Ageing Res Rev 3:369–382. [DOI] [PubMed] [Google Scholar]
- Whitney KA, Shepard PH, Mariner J, Mossbarger B, Herman SM (2010): Validity of the Wechsler Test of Adult Reading (WTAR): Effort considered in a clinical sample of U.S. military veterans. Appl Neuropsychol 17:196–204. [DOI] [PubMed] [Google Scholar]
- Wilkinson GS, Robertson GJ (2006): Wide Range Achievement Test (WRAT4) [Software and program kit]. Psychological Assessment Resources, Lutz. [Google Scholar]
- Willis SL, Schaie KW (2005): Cognitive trajectories in midlife and cognitive functioning in old age In: Willis SL, Martin M, editors. Middle Adulthood: A Lifespan Perspective. Thousand Oakes: Sage; pp 243–275. [Google Scholar]
- Woodruff‐pak DS, Iii RWV, Ewers M, Coffey J, Boyko OB, Lemieux SK (2001): MRI‐assessed volume of cerebellum correlates with associative learning. Neurobiol Learn Mem 357:342–357. [DOI] [PubMed] [Google Scholar]
- Ziegler G, Dahnke R, Jäncke L, Yotter RA, May A, Gaser C (2012): Brain structural trajectories over the adult lifespan. Hum Brain Mapp 33:2377–2389. [DOI] [PMC free article] [PubMed] [Google Scholar]
- Ziegler G, Dahnke R, Winkler AD, Gaser C (2013): Partial least squares correlation of multivariate cognitive abilities and local brain structure in children and adolescents. Neuroimage 82:284–294. [DOI] [PubMed] [Google Scholar]
Associated Data
This section collects any data citations, data availability statements, or supplementary materials included in this article.
Supplementary Materials
Supplementary Information
Supplementary Information