

Abstract
Bone grafting procedures in the United States rely heavily upon autografts and allografts, which are donor-dependent, cause donor site pain, and can transmit disease. Synthetic bone grafts can reduce these risks; however, synthetics lack the bone differentiating (osteoinductive) abilities of auto- and allografts. Achieving innate osteoinductive properties of synthetics through surface modifications is currently under investigation. This study focuses on nanofibers, with emphasis on how fiber diameter and the potential curvature sensor POR1 affect the activation of the signalingmoleculesRac1 and Arf1, and leading to expression of alkaline phosphatase (ALP), an osteoinductive marker. Diameters of 0.1, 0.3, and 1.0 μm were compared against a flat control. The highest level of Rac1 activation was achieved on the smallest fibers (0.1 μm), a trend that was long in POR1 knockdowns. This supports the hypothesis that on small nanofibers, POR1 favorably binds to highly curved cell membranes, which allows Rac1 to subsequently dissociate and activate. When the curvature is insufficient to bind POR1, POR1 binds to inactive Rac1 and competitively inhibits its activation. Arf1 activation followed an opposite trend, with the largest nanofibers exhibiting the highest activity. This trend reinforces the known interaction between Rac1 and Arf1 through the GIT/PIX complex, an Arf1 GAP and Rac1 GEF, respectively. Large, (1.0μm), nanofibers demonstrated the highest ALP activity, indicating that ALP expression is inversely dependent on Rac1 activation. Knockdown of POR1 resulted in increased ALP activity across the substrates but without regard to the curvature sensing trend seen previously. Thus, POR1 senses curvature and increases Rac1 activity, which negatively regulates bone differentiation.
Introduction
Nearly one million bone grafting procedures are performed annually in the United States, totaling to millions of dollars in medical costs.1–3 The three most widely used classes of graft materials are autografts, allografts, and synthetic grafts.1 Autografts—self donated tissues—are the current gold standards of graft materials and are the only material to exhibit all three characteristics of an ideal bone graft: osteoconduction, osteogenesis, and osteoinduction.4 Osteoconduction describes the ability of the graft to allow de novo blood vessel and bone formation into the graft. Osteogenesis is when bone cells create new bone from within the graft. Osteoinduction is the ability of the graft to induce the differentiation of local mesenchymal stem cells into osteoblasts.4 However, limited availability and donor-site morbidity limit the use of autografts.5 There is also an increased risk of infection since both the donor and recipient sites are exposed during the autograft operation.1 Additionally, the degree of osteogenesis is heavily dependent upon the number of osteoblast precursor cells that survive transplantation. Despite these drawbacks, autografts are still used in 48% of all bone grafting procedures.3
Allografts—tissue donated from another human— are used in 32% of grafting procedures and possess two of the three ideal characteristics of a graft: osteoinduction and osteoconduction (osteogenesis is lost during the decellularization of the grafts, a necessary step to minimize the recipient's immune response).3 Even after decellularization, there is still the potential of immune rejection of the foreign material. Fracture rate is one of the largest problems associated with allografts and has been reported to be as high as 19%. Bacterial infections have also been reported in 10% of large allografts, and, although rare, viral transmissions of HIV, hepatitis B, and hepatitis C have been reported.1,6 Two advantages of allografts are that only a single surgery is required and there is no risk of donor site morbidity.1
Despite the advantages of auto- and allografts, both are limited by their dependence on donor material. Development of a synthetic biomaterial for use in bone graft scaffolds would be advantageous since it would not be subjugated to donor shortages, have no increased risk of infection, no donor site pain/morbidity, and no risk of disease transmission. Currently, synthetic bone grafts only account for 13% of the bone graft market and are only osteoconductive.1–3,7 Like allografts, osteogenesis can only be achieved if the graft is seeded with the recipient's osteoblasts prior to implantation. Recruitment of local mesenchymal stem cells and their subsequent differentiation into osteoblasts would also solve this problem. However, the current method of inducing this differentiation, via growth factors such as bone morphogenetic proteins (BMPs), is not a cost-effective solution. A single treatment cycle of BMPs can have a cost exceeding $5,000.6
One solution to eliminating the use of growth factors is to make the bone grafts innately osteoinductive via their surface geometry. As highlighted in a review by Ozdemir et al,8 research has shown that cells are sensitive to and are capable of detecting the geometry of their substrates. Nanofibers are one of the few types of geometries which have shown to be efficacious at yielding an osteoinductive response. Numerous studies have demonstrated that nanofibers are capable of increasing levels of several marker proteins for bone differentiation, specifically alkaline phosphatase, calcium phosphate mineralization, osteocalcin, and osteopontin.8–12 The exact mechanism of how nanofibers increase these levels has yet to be determined, although progress is being made. Jaiswal et al. looked at how modulating the fiber diameter from 2.5 to 0.5 μm affects the MAPK cell-signaling pathways.13 It was discovered that fibers with a diameter of ∼0.9 μm had the highest levels of p38 activation, indicative of an osteoinductive response, and decreased ERK activity, indicative of decreased proliferation. Ozdemir et al. found that nanofibers with diameters of 1.153 ± 0.310 μm not only increased cell stiffness but also increased early osteogenic differentiation via cytoskeletal reorganization through RhoA, ROCK, and MyosinIIa signaling pathways.14
Another means by which nanofibers regulate an osteoinductive response may be due to the ability of cells to sense curvature. Originally hypothesized by Vogel and Sheetz,15 it was believed that cell curvature can result in intracellular curvature sensing involving vesicle stabilizing proteins. In the Vogel and Sheetz review, the ability of cells to respond to surface curvature was evaluated in detail.15 Summarizing the review: sufficiently curved surfaces will result in the cell bending around the structure, which in turn will recruit various vesicle stabilizing proteins, specifically POR1 (arfaptin2). POR1 binds inactive GDP bound Rac1 in an either-or relationship with a curved surface. Rac1 is a small GTPase signaling molecule within the Rho super family, that has been associated with endocytosis, cytoskeletal rearrangement, vesicle transport, focal adhesion turnover, lamellipodial extension, and proliferation.16–19 Should POR1 bind to the curved cell membrane, it may release Rac1, allowing it be activated by a guanine nucleotide exchange factor (GEF). The relationship between POR1, membrane curvature, and Rac1 activation is detailed in literature through the intermediate Arf1, a small GTPase that facilitates binding of POR1 to curved membranes as well as the activation of Rac1.20–23 The GTPase-activating protein (GAP) for Arf1 has been shown to associate and interact with the GEF of Rac1.24 Furthermore the Arf1GAP is a known curvature sensor and can bind to curved membranes.25–27
A preliminary TEM image to determine whether cell membranes wrap around nanofibers is presented in Figure 1, which lends support to Vogel and Sheetz's hypothesis in that when substrate architecture becomes sufficiently small, the cell will curve around its substrate, leading to intracellular curvature. In Figure 1A, the nanofiber (falsely colored red) is approximately 1.3 μm, and in 1B the nanofibers are 0.8 μm and 0.4 μm. On the larger fibers in A, the cells (colored purple) lie tangentially to the curvature of the nanofiber, whereas on the smaller fibers in B, the cells curve around the fibers. This suggests that cells may be able to sense and respond to the degree of curvature of their substrate.
Figure 1.
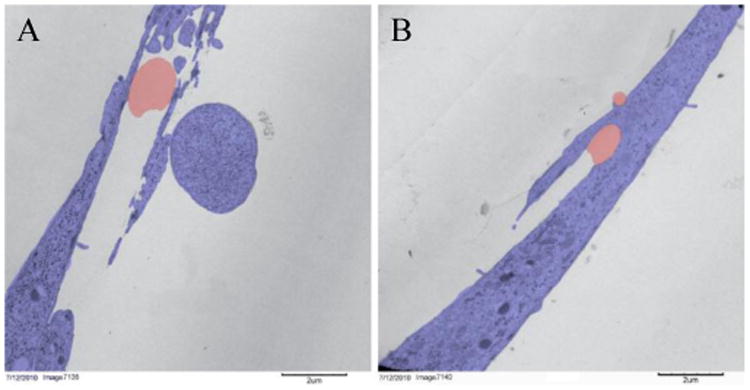
False colored TEM image of cells (purple) on nanofibers (red). Cells lie flat on top of large nanofibers (A) and wrap around small nanofibers (B).
This study seeks to determine if the vesicle stabilizing protein POR1 is indeed capable of sensing cell curvature and if its curvature sensing leads regulates osteoinduction in response to nanofiber diameter. Unlike previous experiments, this study focuses on true nanofibers, defined as fibers whose average diameter is less than 0.1 μm, which is also the vesicle diameter that demonstrates the highest affinity to POR1. It is hypothesized that nanofibers with a cross-sectional diameter of 0.1 μm will result in elevated activation of Rac1 as a result of POR1 curvature sensing. The role of Arf1 on Rac1 activation will also be investigated. ALP activity will serve as the endpoint to determine if change in Rac1 activity has osteoinductive effects.
Materials and Methods
Nanofibers Fabrication and Characterization
All nanofibers were electrospun onto glass coverslips coated with either polyHEMA or Sigmacote to prevent cell adhesion to the glass subsurface. The final solutions and electrospinning conditions can be found in Table 1. Temperature and humidity at the time of electrospinning were recorded to improve repeatability. Poly (L-lactic acid) (PLLA) with an average molecular weight of 650 kDa was obtained from Purac under the name Purasorb PL 65. PLLA was chosen as the polymer because it is FDA approved for human use and is biodegradable, both desirable traits of a material to be used in a regenerative bone graft. All solvents were obtained neat from Sigma-Aldrich or VWR. Solutions were heated to accelerate the dissolution of PLLA. To determine the effect of nanofiber size on Rac1 activity, three sizes of nanofibers were fabricated: small, medium, and large. Control slides were made by coating glass slides with 1% PLLA (wt/vol) in chloroform.
Table 1.
Electrospinning conditions to generate the final nanofibers: Condition 1 lists components of the polymer solutions, Condition 2 lists the physical parameters of electrospinning, and Condition 3 lists the environmental conditions at the time of electrospinning.
| Nanofiber Size | Electrospinning Conditions |
|---|---|
| Small |
|
| Medium |
|
| Large |
|
Large and medium nanofibers were imaged using a FEI Quanta 200 Environmental SEM Quanta. Small nanofibers were imaged using a FEI NanoSEM 630 FESEM for improved resolution. Gold was sputter coated onto the nanofibers prior to imaging. ImageJ was used to measure the diameters of the nanofibers.
Cell Staining
MC3T3-E1 S4 cells (passage 35) were seeded at 15% confluence onto UV-sterilized control and nanofiber coverslips. Twenty-four hours after seeding, the cells were fixed and immunostained. Protease and phosphatase inhibitors were used in the initial washing steps to prevent deactivation of Rac1. The following antibodies were used to determine localization of active and total Rac1: New East Biosciences anti-active Rac1-GTP mouse monoclonal antibody (dilution 1:1,000) and Santa Cruz Rac1 rabbit polyclonal antibody (1:200). To ensure cells were adhering to the fibers and not the underlying glass coverslip, the cells were stained with Sigma Aldrich vinculin mouse monoclonal antibody clone hVIN-1 (1:400), DAPI (1:1,000), and phalloidin (1:500). Immunostained slides were then imaged using a 40× water-immersion objective on a Leica DM5500 upright microscope.
POR1 Knockdown and Active Rac1 Quantification
MC3T3-E1 S4 cells were transfected with POR1 siRNA in accordance with the guidelines from the supplier, Santa Cruz Biotechnology. Either 80nM of control siRNA, 20nMof POR1 siRNA, or 80nM of POR1 siRNA with 60 μL of siRNA transfection reagent was added serum-free siRNA transfection medium to a final volume of 10 mL. Cells were incubated in this mixture for seven hours. Then, 12 mL of MEM-alpha with 20% FBS (v/v) was added and the cells were left to incubate overnight.
Transfected cells were seeded into 6-well plates containing coverslips of the small, medium, or large nanofibers and the control. Twenty-four hours after seeding the cells and coverslips were washed with cold PBS, transferred to a new 6-well plate, and lysed in 100 μL of protease-inhibited lysis buffer from the Cytoskeleton, Inc. G-LISA kit. The 6-well plates were then snap frozen using liquid nitrogen. The remainder of the assay was completed as per directed by the G-LISA instruction manual. A PicoGreen assay was used to measure DNA levels for normalization, as directed by the G-LISA kit. This will determine the amount of active Rac1 as normalized by the total number of cells present and not the amount of protein made. G-LISA was the chosen assay for this experiment because it is more reliable and sensitive than a pull-down assay.
The knockdown was verified using Western Blot. Lysates of cells treated with either control or POR1 siRNA were loaded into a 10% polyacrylamide gel and were separated at 130V for 6.5 hours. The proteins were transferred to a membrane and were probed for POR1 (1:500 v/v dilution in TBST) and α-tubulin (1:1,000 v/v dilution in TBST). The labeled membranes were imaged and quantified using aLi-COR Odyssey Infrared Imaging System.
Quantification of Arf1 Activity
The samples from the 24-hour Rac1 activation assay were used to measure Arf1 activation. 10 μL of the samples were loaded into an Arf1 G-LISA obtained from Cytoskeleton, Inc. The remainder of the assay was completed as per directed by the G-LISA instruction manual. To determine how much Arf1 was active relative to the number of cells, a PicoGreen assay was used to measure DNA levels for normalization.
Quantification of Alkaline Phosphatase Activity and Rac1 Inhibition
MC3T3-E1 S4 cells were treated with siRNA to knockdown POR1 as described previously. An additional control was included to examine the role of Rac1 independent of POR1. This was accomplished by daily supplementation of the media of half the control siRNA cells on all 4 substrates with the Rac1 inhibitor NSC23766 at a final concentration of 50μM. After 3 days cells were lysed and frozen at -80°C until analysis. An alkaline phosphatase fluorimetric assay kit was used to quantify the levels of alkaline phosphatase following the protocol of the supplier, GeneTex, Inc. This quantification was dependent on the cleavage of the phosphate present on the non-fluorescent substrate, 4-methyllumelliferyl phosphate (MUP), resulting in an intensely fluorescent product. The reaction was carried out by adding 20μL of sample to 110μL of buffer containing 75nM MUP and incubating at room temperature for 60 minutes. The reaction was stopped by adding 20 μL of stop solution. The fluorescence of reacted samples was read using a TECAN plate reader set to acquire emission at 440nm when excited at 360nm. Background was determined by including a sample that had the stop solution added prior to the substrate solution. Corrected fluorescence was normalized to DNA, which was quantified using PicoGreen. Time points of 1 and 3 days were used with each sample group having an n=6.
Statistical Analysis
Outliers were removed from the data sample if they failed the 1.5 inter quartile range (IQR) test (i.e. if value was less than Q1-1.5*IQR or greater than Q3+1.5*IQR). A one-way analysis of variance (ANOVA) with a Tukey-Kramer post hoc test was conducted on the outlier-free data set to determine statistical significance between samples.
Results
Nanofiber Characterization
The nanofiber solutions listed in Table 1 resulted in small nanofibers with a diameter of 0.0800.040 μm, medium nanofibers with a diameter of 0.2700.053 μm, and large nanofibers with a diameter of 1.0480.353 μm. Hence forth, these sizes will be referred to as 0.1, 0.3, and 1.0 μm, respectively. Figure 2 shows the distribution of fiber diameters for each fiber type. Images of the three fiber types at 2,000× magnification can be seen in Figure 3A-C, along with a 112,742× magnification of the small nanofibers in Figure 3D. Although bead-free fibers were the ideal target, electrospinning conditions could not be found that yielded nanofibers with a diameter of <0.1 μm without beads. Average bead sizes approached 1 μm. The large and medium fibers were relatively bead-free. A one-way analysis of variance (ANOVA) test with a Tukey-Kramer post-hoc test determined that the fiber diameters were significantly different.
Figure 2.

Distribution of nanofiber diameters for each fiber type.
Figure 3.
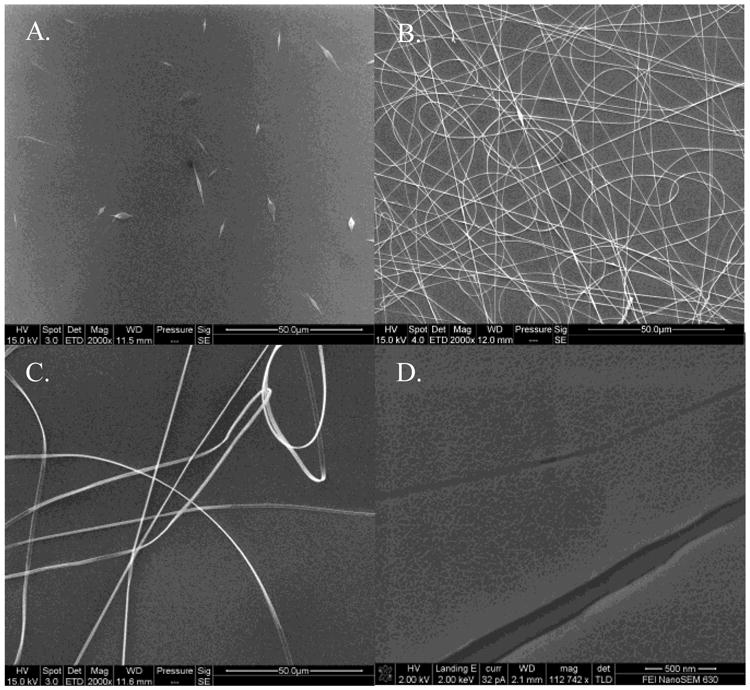
Environmental SEM images of small (A), medium (B), and large (C) nanofibers at 2,000× magnification with a scale bar of 50.0 μm. Field Emission SEM image of the small nanofibers at 112,742× magnification with a scale bar of 500 nm (D). The scaled appearance of the fibers and background is the result of the gold sputter coating. The two fibers shown are approximately 150 nm and 40 nm with the gold coating included.
The Localization of Proteins Immunofluorescence
Immunostaining for active and total Rac1 on small, medium, and large nanofibers as well as control surfaces are depicted as heat maps in Figures 4A-D sequentially. Active Rac1 was normalized by total Rac1; with warmer colors indicating increased activity and cooler colors indicating the presence of total (inactive) Rac1. ImageJ was used to execute image calculations. Briefly, the total Rac1 image was first used to create a mask. The mask was then applied to both the total and active Rac1 images to eliminate the background. Finally, the active Rac1 image was divided by the total Rac1 image. Active Rac1 was shown to localize along the entire length of nanofibers 0.1 μm in diameter, as evidenced by the line of active Rac1 passing through the nucleus (marked by the arrow in Figure 4A). On the other surfaces, active Rac1 did not pass through the nucleus in such a manner. In controls, the leading edge of migrating cells were found to be rich in active Rac1 (arrowhead in Figure 4D). On nanofiber adherent cells, the regions of the cell bound to nanofibers were rich in active Rac1 (arrowheads in Figures 4A-C).
Figure 4.
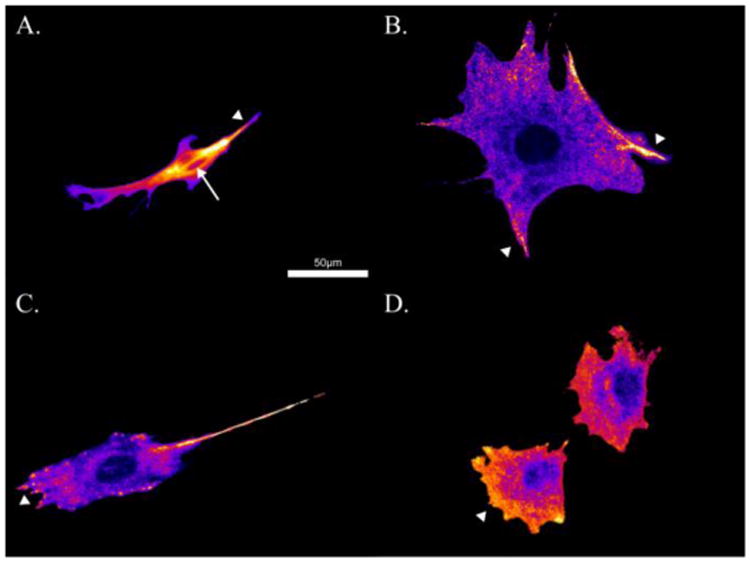
Ratio of active Rac1 relative to total Rac1 on small nanofibers (A), medium nanofibers (B), large nanofibers (C), and control surfaces (D). Warmer colors indicate regions of increased active Rac1 colocalized relative total Rac1 (arrowheads). Note the localization of active Rac1 through the nucleus in A (arrow).
To ensure that the cells were only binding to the nanofibers and not to the underlying substrate, an additional staining for vinculin, a focal adhesion protein, was performed. As seen in Figure 5D, when the cell is adhered to a flat PLLA control surface the vinculin is localized to clusters around the periphery of the cell. In 5A-C, where the cell is adhered to nanofibers, the vinculin is localized to the nanofibers. This demonstrates that the cells are only adhering to the nanofibers and not to the underlying surface.
Figure 5.
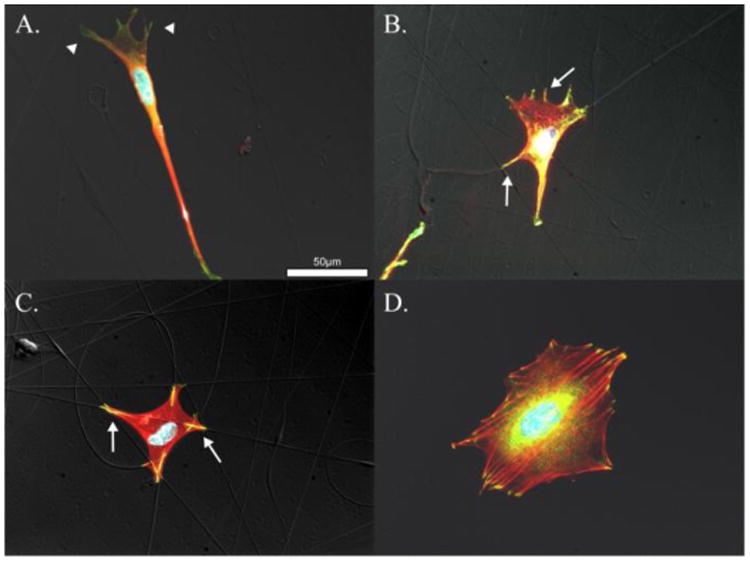
Vinculin (green), actin (red), and DAPI (blue). Cells attached to small nanofibers, A., medium nanofibers, B., large nanofibers, C., and control surfaces D. Vinculin colocalized with actin appears yellow and indicates mature focal adhesions formed along nanofibers indicated by arrows in B. and C. Poorly formed nascent focal adhesions are evident in A. and indicated by arrowheads.
Rac1 Activation
The results of the active Rac1G-LISA, normalized against DNA from the PicoGreen assay, are shown in Figure 6. The control siRNA cells seeded on small nanofibers (0.1 μm) had significantly more active Rac1 than all other samples with the exception of the control cells on medium nanofibers (0.3 μm). This trend was eliminated when POR1 was knocked out. Western Blots confirmed that POR1 production was approximately halved in cells transfected with POR1 siRNA compared to the control. The error bars on the graphs are positive and negative standard deviation.
Figure 6.
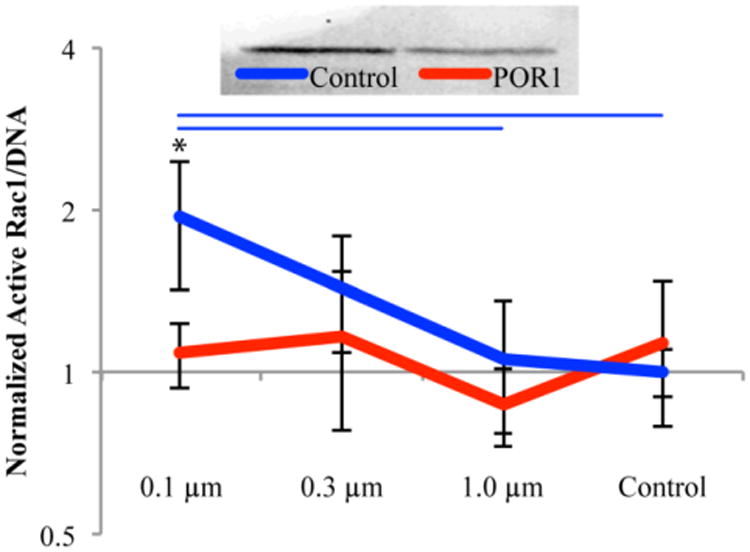
Western blot demonstrating knockdown of POR1 which was found to be approximately 50% based on the ratio of POR1 to Tubulin (top). Rac1 activation as a function of fiber diameter, 24 hours after seeding, normalized by DNA (bottom). All values were normalized against the control siRNA on control surfaces. Blue bars indicate significant difference between substrates within control siRNA treatment and * represents significance between siRNA treatments on the same substrate, p<0.05; n = 6, outliers removed
Arf1 Activation
Active Arf1 as normalized by DNA can be seen in Figure 7. The control siRNA cells on large nanofibers (1.0 μm) had significantly more Arf1 activation than all other control siRNA cells. This trend was lost when POR1 was knocked down. Error bars on the graphs are positive and negative standard deviation.
Figure 7.

Arf1 activation as a function of fiber diameter, 24 hours after seeding, normalized by DNA (bottom). All values were normalized against the control siRNA on control surfaces. Color coded bars indicate significant differences between substrates within control and POR1 siRNA samples whereas * represents significance between siRNA treatments on the same substrate, p<0.05; n = 6, outliers removed
ALP Activity
Levels of ALP activation can be found for three days post seeding in Figure 8. A trend opposite to that of Rac1 activation can be seen in the ALP activation data. The large nanofibers (1.0 μm) and medium (0.3μm) nanofibers had the significantly higher levels of ALP activation at three days with control siRNA samples as compared to small (0.1μm) nanofibers and control surfaces. Treatment with 20nM POR1 siRNA (low siRNA) resulted in an increase in ALP expression on the small nanofibers to a level that was significantly higher than the material control and no longer different than either the large or medium nanofibers receiving the same siRNA treatment. Treatment with 80nM POR1 siRNA (high siRNA) further magnified this trend with all three fiber substrates being significantly higher than the material control. Likewise, large and small nanofibers also demonstrated a significant increase in ALP activity from the control siRNA on large and small nanofibers respectively. To determine if this trend in ALP expression was through POR1 affecting the activation of Rac1, an inhibitor of Rac1 (NSC23766) was used. The inhibitor demonstrated a similar effect as the 80nM POR1 siRNA, which validates the proposed geometry sensing whereby POR1 releases Rac1, allowing it to be activated, in response to small nanofibers. This increase in Rac1 activation prevents early osteoblastic differentiation.
Figure 8.
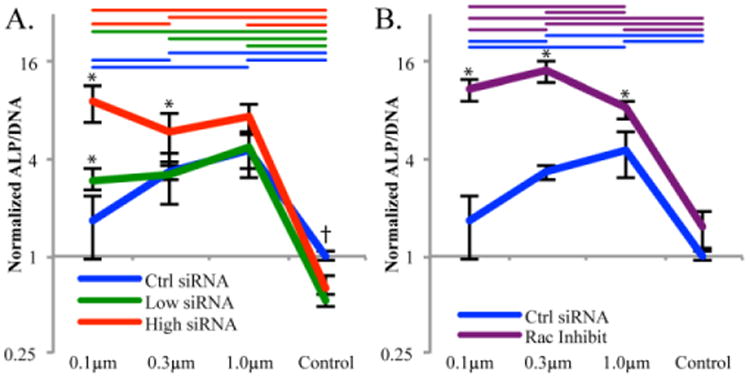
ALP/DNA after 3 days of growth. All samples normalized to the control siRNA cells on the control surface. A. demonstrates the effect that either a low or high concentration of siRNA had over the geometry sensing trend. B. demonstrates the effect of the Rac1 inhibitor NSC23766 on the geometry sensing trend. Colored coded bars indicate significance, p<0.05, between substrates with the same siRNA/Rac1 inhibitor, whereas * represents significance between siRNA or inhibitor and the control on the same substrate and † represents significance between the control treatment and both siRNA treatments. n = 6, outliers removed.
Discussion
Results from immunofluorescence studies indicate that active Rac1 localizes solely on the leading edge of migrating cells and on protrusions from the cell body in control, large nanofiber, and medium nanofiber samples. There appeared to be no localization along nanofibers outside of these regions. This result is expected and demonstrates that the Rac1 activation patterns consistent with mesenchymal, lamellipodial-driven migration. These results were consistent with previous studies of Rac1 localization.28 Images of the small nanofibers show that active Rac1 localizes along nanofibers as evidenced by the line of active Rac1 extending through the nucleus of the cell (Figure 4A). In all other samples the nucleus was void of active Rac1 even when a fiber was present. These results support the hypothesis that POR1 acts as a geometry sensor capable of localizing along the nanofibers with diameters less than 0.1 μm.
Literature from the original discovery of POR1 by Van Aelst et al., indicated that POR1 binds to Rac1 only when it is in its active state.29 However, numerous studies carried out since then have demonstrated conclusively both from the standpoint of structural biology and biochemical evaluation that POR1 binds with inactive Rac1.23,30 Based on the results presented herein, the elevated Rac1 levels in response to nanofibers with diameters of 0.1μm is entirely a function of POR1. When POR1 is removed with siRNA, all the samples demonstrate Rac1 activation levels equal to that of the control surface.
Examining literature evidence for mediators of Rac1 activation that interact with POR1 has produced the small GTPase Arf1.20–22 Arf1 promotes binding of POR1 to membranes and also promotes the activation of Rac1 through the GIT/PIX complex.24 GIT is the GTPase-activating protein (GAP) for Arf and is responsible for the conversion of Arf-GTP to Arf-GDP. Active Arf1 (i.e. Arf1-GTP) is the facilitating molecule that allows POR1 to bind to membranes.22 PIX is the guanine nucleotide exchange factor (GEF) for Rac1 and is responsible for the conversion of Rac1-GDP to Rac1-GTP. Through the interaction of GIT and PIX, it can be expected that as the activation of Rac1 increases that Arf1 activation will decrease and vice versa. This is the trend seen in Figures 6 and 7 when POR1 is present in the cell. When POR1 is knocked down, the trend is no longer present as inactive Rac1 is no longer localized to the cell membrane via POR1.
Arf1 activation on control surfaces does not follow the same trend as would be expected. This phenomenon can be explained by the role of Arf1 at the Golgi complex in the production of new proteins for focal adhesion. Research has shown that the maturity of focal adhesions varies greatly between nanofibers and flat surfaces; specifically, nanofiber focal adhesions tend to be larger, more stable, and more mature than focal adhesions on control surfaces, which tend to be smaller and have a higher turnover rate.13,14 Maturity of nanofiber focal adhesions is evidenced by the presence of zyxin and increased activation of RhoA, which are not found on nascent focal adhesions.13,14 The Golgi is responsible for processing of focal adhesion proteins, and Arf1 and POR1 play a role in the stabilization of their transport vesicles.31 Once activated by GEFs at the Golgi, Arf1 supports the transport of proteins to the focal adhesion and is then inactivated by GAPs, such as ASAP1, at focal adhesions.32,33 Due to the high turnover rate of focal adhesions on flat surfaces, many adhesion proteins are required, and thus Arf1 inactivation occurs during the delivery of these proteins. The role of Arf1 in migration on flat (control) surfaces has been demonstrated previously and shows a decrease in migration when expression levels are reduced, which is expected since decreased Arf1 levels would disrupt focal adhesion protein delivery.20 POR1, as a vesicle trafficking protein, plays a role in this process by assisting in vesicle stabilization. When POR1 is removed from the system, the budding of transport vesicles is disrupted, and active Arf1 accumulates near the Golgi. Furthermore, the stability of the nanofiber focal adhesions means that the ArfGAP at the focal adhesion is less active than the one at its control surface counterparts. This, in turn, leads to more active Arf1. Finally, as nanofiber size decreases further, POR1's curvature sensing abilities allow it to bind to the cell membrane, thus increasing the local concentration of Rac1, which interacts with the GIT/PIX complex to activate Rac1 and inactivate Arf1.
A detailed mechanism has been formulated for the POR1 geometry sensor, as seen in Figure 9; wherein, POR1 locally increases Rac1 levels to the plasma membrane wrapped around the nanofiber. A local increase in Rac1 results in a local increase in active Rac1 through Arf1, which is in addition to the endogenous Rac1 activation levels. This describes why there is increased POR1-dependent activation of Rac1 on 0.1μm fibers. Additionally, there was an increasing trend in Rac1 activation demonstrated on the 0.3μm fibers which was not significant. POR1 binds, albeit poorly, to membranes with 0.3μm diameters as well. This supports the theory that cells can indeed sense their substrates via mechanisms involving vesicle stabilizing proteins. In this instance, the more tightly curved the membrane/underlying surface, the more POR1 binds and promotes Rac1activation. This is why Rac1 activity was greatest on the small nanofibers.
Figure 9.
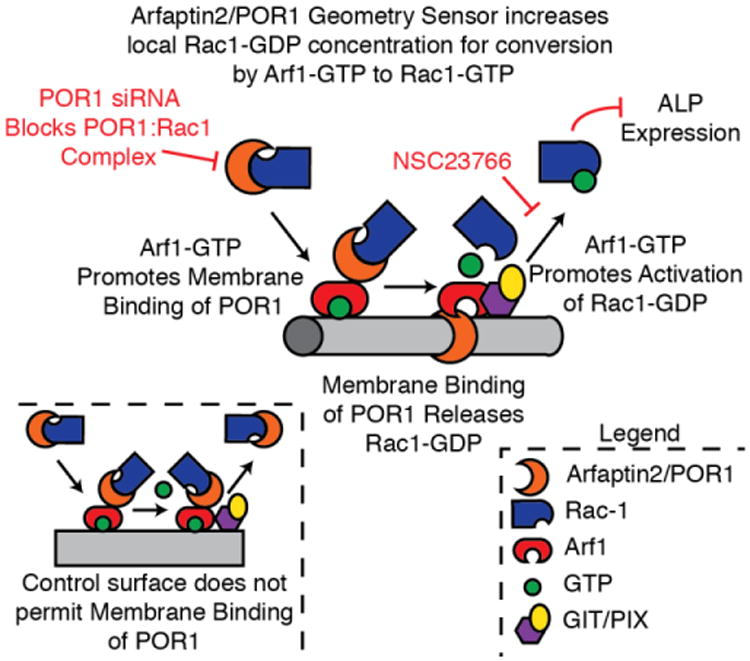
The proposed mechanism for POR1 (arfaptin2) and Arf1 and their role in the activation of Rac1.
Despite the increased activation of Rac1 in small nanofibers, data from ALP activation does not indicate that increased Rac1 activity leads to increased ALP activity. Instead, the data points to a different mechanism, one in which Rac1 negatively regulates osteoinduction. This supports the results of Onishi et al. who reported that the inhibition of Rac1 led to increased osteoblastic differentiation through a BMP-2-induced pathway.34 Rather than use a transfection like Onishi, this paper was able to achieve the same results of controlling Rac1 signaling through geometry sensing alone.
Though excessive curvature seems to diminish the effects of nanofiber's osteoinductive properties, some degree of curvature does result in increased ALP activity. This supports literature that indicates medium to large diameter nanofibers are effective at promoting an osteoinductive response.9,11,12 In this study, nanofibers with a diameter of approximately 1.0 μm yielded the highest levels of ALP activity when POR1 function was intact. When POR1 was knocked down, active Rac1 decreased, and ALP activity increased in all fiber types indicating that Rac1 has a negative role in ALP activation. This response was dose-dependent on the amount of siRNA added. As more siRNA was added the geometry sensing trend seen in the control samples gradually diminished. The ability to sense geometry was also lost when Rac1 was directly inhibited via NSC23766. Addition of the Rac1 inhibitor resulted in significant increases in ALP activity, again demonstrating Rac1's negative role in ALP activity. This supports the theory that Rac1 and POR1 are both integral to the geometry sensing process and each play a role in expression of the early bone marker, ALP.
Curvature plays an osteoinductive role beyond decreased Rac1 activity as evidenced by large nanofibers having the greatest amount of ALP activity despite the control surfaces having the least Rac1 activation. Perhaps a diameter of 1.0 μm may be ideal for another signaling molecule that is involved with a pathway that leads to osteoinduction. This correlates well with previous studies which have shown that nanofibers with diameters greater than 1 μm result in higher levels of ALP activity through a RhoA/ROCK-dependent mechanism.14 These protein complexes are associated with focal adhesions, which tend to be larger and more mature on larger nanofibers than on smallerones. Taken together, the results demonstrate that cells are capable of sensing curved fibrous geometries through two mechanisms. One involves focal adhesions on larger fibers which lead increased differentiation, and the other involves the vesicle stabilizing protein POR1 which results in decreased differentiation and upregulatedRac1 activation. Future experimentation could be conducted to determine what specific protein is responsible for the large nanofiber mechanism, as well as looking at longer time points for ALP and Rac1 activation and seeing if the mechanism translates to more clinically relevant cell lines such has human mesenchymal stem cells.
Conclusions
In this study the effects of nanofiber diameter and POR1 on Rac1 activation and early osteoinduction were examined. Immunofluorescence imaging indicated that active Rac1 localizes along the leading edges of migrating cells, matching literature evidence on Rac1 activation in the typical mesenchymal migration observed on flat surfaces, and in cellular protrusions between neighboring cells. On the smallest nanofibers, active Rac1 was found to localize along the length of the nanofibers. This localization, combined with the increased levels of Rac1 activation on small nanofibers, supports the theory that cells can sense the curvature of their substrates through vesicle stabilizing proteins, such as POR1. POR1 appears to have an active role in this process as its knockdown reduced diameter-dependent Rac1 activation to control levels. The levels of Arf1 activity had a trend opposite to the activity of Rac1, as explained by the GIT/PIX complex. Once again, when POR1 is removed from the system, this trend ceases to exist. These results validate the hypothesis put forth by Viola Vogel and Michael Sheetz that POR1 binds to inactive Rac1, increases the local Rac1 concentration when POR1 unbinds Rac1 to bind the curved membrane, and results in increased local Rac1 activation. Despite the ability of cells to sense their substrate and increase their levels of Rac1 activation, higher Rac1 levels did not correlate with an increase in osteoinduction as measured by ALP activity. On larger nanofibers (1.0 μm) where Rac1 activity was significantly lower than that of the small nanofibers, the amount of ALP activity was the highest of all fiber diameters tested. The knockdown of POR1 led to increased ALP activity in an siRNA dose-dependent manner; however, the differences between fiber groups were diminished. Chemical inhibition of Rac1 demonstrated a similar response as POR1 knockdown on nanofibers, further illustrating its negative role in ALP expression in response to nanofiber architectures. These results coupled with earlier results examining the GTPase RhoA demonstrate that on large nanofibers ALP expression is increased due to increased RhoA activation; however, as fiber diameter decreases POR1 geometry sensing leads to increased Rac1 activation and inhibition of early osteoinduction and ALP expression.14
Insight Box.
Though cell curvature sensing has been widely reported, the means by which cells achieve “sensation” is largely unknown. Using a variety of techniques, the authors have investigated one mechanism to explain this phenomenon: the relationship between the small GTPase Rac1 and the vesicle-stabilizing protein POR1. Polymer nanofibers of varying diameter were used to modulate the activity of these proteins, with specific interest on how levels of the osteoinductive marker alkaline phosphatase were altered. Results of this study could be used to influence future designs of synthetic bone grafts in order to improve their osteoinductive potential and provide insight into fundamental mechanisms underpinning the cellular response to extracellular matrix, a structure composed of nanofibers that present diameters across the range investigated.
Acknowledgments
The authors would like to thank Tugba Ozdemir for her insights and discussions on the research topic and Julie Anderson for her role in FE-SEM imaging. This work was supported by the National Institutes of Health grant R03AR065192.
References
- 1.Moore WR, Graves SE, Bain GI. ANZ J Surg. 2001;71:354–361. [PubMed] [Google Scholar]
- 2.Bucholz RW. Clin Orthop Relat Res. 2002:44–52. doi: 10.1097/00003086-200202000-00006. [DOI] [PubMed] [Google Scholar]
- 3.D. Moore, Orthobullets.com, 2013.
- 4.Greenwald AS, Boden SD, Goldberg VM, Khan Y, Laurencin CT, Rosier RN. American Academy of Orthopaedic Surgeons. Vol. 70 New Orleans: Louisiana; 2003. [Google Scholar]
- 5.Kim DH, Rhim R, Li L, Martha J, Swaim BH, Banco RJ, Jenis LG, Tromanhauser SG. Spine J. 2009;9:886–92. doi: 10.1016/j.spinee.2009.05.006. [DOI] [PubMed] [Google Scholar]
- 6.Jahangir AA, Nunley RM, Mehta S, Sharan A. Am Acad Orthop Surg Now. 2008 [Google Scholar]
- 7.Miron R, Zhang Y. J Dent Res. 2012;91:736–44. doi: 10.1177/0022034511435260. [DOI] [PubMed] [Google Scholar]
- 8.Ozdemir T, Higgins AM, Brown JL. Curr Pharm Des. 2013;19:3446–55. doi: 10.2174/1381612811319190010. [DOI] [PubMed] [Google Scholar]
- 9.Kim HW, Song J, Kim H. J Biomed Mater Res A. 2006;79:698–705. doi: 10.1002/jbm.a.30848. [DOI] [PubMed] [Google Scholar]
- 10.Yoshimoto H, Shin YM, Terai H, Vacanti JP. Biomaterials. 2003;24:2077–2082. doi: 10.1016/s0142-9612(02)00635-x. [DOI] [PubMed] [Google Scholar]
- 11.Ruckh TT, Kumar K, Kipper MJ, Popat KC. Acta Biomater. 2010;6:2949–59. doi: 10.1016/j.actbio.2010.02.006. [DOI] [PubMed] [Google Scholar]
- 12.Brown JL, Peach MS, Nair LS, Kumbar SG, Laurencin CT. J Biomed Mater Res A. 2010;95:1150–8. doi: 10.1002/jbm.a.32934. [DOI] [PubMed] [Google Scholar]
- 13.Jaiswal D, Brown JL. J Biomed Mater Res A. 2012;100:2921–8. doi: 10.1002/jbm.a.34234. [DOI] [PubMed] [Google Scholar]
- 14.Ozdemir T, Xu LC, Siedlecki C, Brown JL. Integr Biol. 2013;5:1407–1416. doi: 10.1039/c3ib40068a. [DOI] [PubMed] [Google Scholar]
- 15.Vogel V, Sheetz M. Nat Rev Mol Cell Biol. 2006;7:265–75. doi: 10.1038/nrm1890. [DOI] [PubMed] [Google Scholar]
- 16.Ridley AJ. Trends Cell Biol. 2006;16:522–9. doi: 10.1016/j.tcb.2006.08.006. [DOI] [PubMed] [Google Scholar]
- 17.Bustelo XR, Sauzeau V, Berenjeno IM. Bioessays. 2007;29:356–370. doi: 10.1002/bies.20558. [DOI] [PMC free article] [PubMed] [Google Scholar]
- 18.Habermann B. EMBO Rep. 2004;5:250–5. doi: 10.1038/sj.embor.7400105. [DOI] [PMC free article] [PubMed] [Google Scholar]
- 19.Boureux A, Vignal E, Faure S, Fort P. Mol Biol Evol. 2007;24:203–216. doi: 10.1093/molbev/msl145. [DOI] [PMC free article] [PubMed] [Google Scholar]
- 20.Lewis-Saravalli S, Campbell S, Claing A. Cell Signal. 2013;25:1813–9. doi: 10.1016/j.cellsig.2013.05.011. [DOI] [PubMed] [Google Scholar]
- 21.Shin OH, Exton JH. Methods Enzymol. 2005;404:359–67. doi: 10.1016/S0076-6879(05)04031-0. [DOI] [PubMed] [Google Scholar]
- 22.Ambroggio EE, Sillibourne J, Antonny B, Manneville JB, Goud B. PLoS One. 2013;8:e62963. doi: 10.1371/journal.pone.0062963. [DOI] [PMC free article] [PubMed] [Google Scholar]
- 23.Shin OH, Exton JH. Biochem Biophys Res Commun. 2001;285:1267–73. doi: 10.1006/bbrc.2001.5330. [DOI] [PubMed] [Google Scholar]
- 24.Premont RT, Perry SJ, Schmalzigaug R, Roseman JT, Xing Y, Claing A. Cell Signal. 2004;16:1001–11. doi: 10.1016/j.cellsig.2004.02.002. [DOI] [PubMed] [Google Scholar]
- 25.Drin G, Casella JF, Gautier R, Boehmer T, Schwartz TU, Antonny B. Nat Struct Mol Biol. 2007;14:138–46. doi: 10.1038/nsmb1194. [DOI] [PubMed] [Google Scholar]
- 26.Bigay J, Casella JF, Drin G, Mesmin B, Antonny B. EMBO J. 2005;24:2244–53. doi: 10.1038/sj.emboj.7600714. [DOI] [PMC free article] [PubMed] [Google Scholar]
- 27.Bigay J, Gounon P, Robineau S, Antonny B. Nature. 2003;426:563–6. doi: 10.1038/nature02108. [DOI] [PubMed] [Google Scholar]
- 28.Kraynov VS, Chamberlain C, Bokoch GM, Schwartz MA, Slabaugh S, Hahn KM. Science (80-) 2000;290:333–7. doi: 10.1126/science.290.5490.333. [DOI] [PubMed] [Google Scholar]
- 29.Van Aelst L, Joneson T, Bar-Sagi D. EMBO J. 1996;15:3778–86. [PMC free article] [PubMed] [Google Scholar]
- 30.Tarricone C, Xiao B, Justin N, a Walker P, Rittinger K, Gamblin SJ, Smerdon SJ. Nature. 2001;411:215–9. doi: 10.1038/35075620. [DOI] [PubMed] [Google Scholar]
- 31.Donaldson JG, Honda A, Weigert R. Biochim Biophys Acta - Mol Cell Res. 2005;1744:364–73. doi: 10.1016/j.bbamcr.2005.03.001. [DOI] [PubMed] [Google Scholar]
- 32.Turner CE, Brown MC, Perrotta JA, Riedy MC, Nikolopoulos SN, Mcdonald AR, Bagrodia S, Thomas S, Leventhal PS. J Cell Biol. 1999;145:851–863. doi: 10.1083/jcb.145.4.851. [DOI] [PMC free article] [PubMed] [Google Scholar]
- 33.Turner CE, West KA, Brown MC. Curr Opin Cell Biol. 2001;13:593–599. doi: 10.1016/s0955-0674(00)00256-8. [DOI] [PubMed] [Google Scholar]
- 34.Onishi M, Fujita Y, Yoshikawa H, Yamashita T. Cell Death Dis. 2013;4:e698. doi: 10.1038/cddis.2013.226. [DOI] [PMC free article] [PubMed] [Google Scholar]