

Abstract
Mass cytometry is developing as a means of multiparametric single cell analysis. Here, we present an approach to barcoding separate live human PBMC samples for combined preparation and acquisition on a CyTOF® instrument. Using six different anti-CD45 antibody (Ab) conjugates labeled with Pd104, Pd106, Pd108, Pd110, In113, and In115, respectively, we barcoded up to 20 samples with unique combinations of exactly three different CD45 Ab tags. Cell events carrying more than or less than three different tags were excluded from analyses during Boolean data deconvolution, allowing for precise sample assignment and the electronic removal of cell aggregates. Data from barcoded samples matched data from corresponding individually stained and acquired samples, at cell event recoveries similar to individual sample analyses. The approach greatly reduced technical noise and minimizes unwanted cell doublet events in mass cytometry data, and reduces wet work and antibody consumption. It also eliminates sample-to-sample carryover and the requirement of instrument cleaning between samples, thereby effectively reducing overall instrument runtime. Hence, CD45-barcoding facilitates accuracy of mass cytometric immunophenotyping studies, thus supporting biomarker discovery efforts, and should be applicable to fluorescence flow cytometry as well.
Keywords: mass cytometry, CyTOF, barcoding, immunophenotyping, biomarker, immunomonitoring, human, blood, leukocytes, lymphocytes, cytometry, CD45, palladium, EDTA
Introduction
Phenotypic and functional assessments of leukocytes are frequently used by clinicians and researchers to analyze the state of the immune system, to detect specific aberrations, and for biomarker discovery. Mass cytometry, a hybrid technology permitting single-cell cytometry based on a mass spectrometric readout, allows for massively multiparametric single-cell analysis (1, 2). The technology is capable detecting more than 35 markers of interest as well as dead cell exclusion and DNA detection (used to identify intact cell events), thereby more than doubling the number of analytes typically measured by conventional flow cytometry (3, 4). Mass cytometry can thus be a key technology to recent efforts to systematically study the human immune system (5) in the context of health, aging, vaccination, immunopathology, and medical treatment.
Conventional flow cytometry is subject to large-scale standardization efforts with the aim of enhancing comparability of data that are raised in different contexts (6, 7). For mass cytometry, variability in the machine performance (1) as well as in the sample preparation and staining procedure can be partially overcome by daily tuning of the CyTOF® mass cytometer (8) and by using normalization beads (9). However, standardization of mass cytometry experiments that involve the comparison of multiple samples or stimulation conditions, should ideally based on exactly identical conditions for sample preparation and acquisition. Running a series of individual samples as a composite barcoded sample eliminates concerns regarding potentially different conditions during sample preparation and acquisition, eliminates sample–to-sample carryover problems, and reduces reagent consumption (10, 11).
Cell barcoding is achieved by using mass-tagged thiol- or amine-reactive barcode reagents (12–16), which require cell fixation and at least partial permeabilization of the cell membrane.
In contrast, we here describe a sample barcoding approach for human peripheral blood mononuclear cells (PBMC) using cell surface CD45 staining to allow barcoding of live cells prior to surface staining. Six differently mass-tagged CD45 antibodies were used to barcode up to 20 PBMC samples in a combinatorial fashion prior to their joint surface and intracellular staining with immunophenotyping Ab, fixation, permeabilization, and sample acquisition on the CyTOF® instrument.
Four out of the six barcoding antibodies are labeled with Pd isotopes which are detected outside the mass range normally used for analyte-specific probes. In contrast to a previous approach to label Ab with Pd that led to reagents that stain dead cells (17), we used isothiocyanobenzyl-EDTA (SCN-Bn-EDTA) to achieve labeling of Ab with Pd (14, 16).
Single sample data extracted from the acquired composite sample reproduced results from separately stained and acquired samples, and Boolean data deconvolution permitted electronic removal of cell aggregates containing cell events with two or more different barcodes.
Materials and Methods
Reagents
Millipore filtered deionized water (“water”) was used as sample carrier and to prepare 1x PBS from 10x PBS (Rockland, Gilbertsville, PA) and CyPBS/0.1% BSA (Sigma) (“CyPBS/BSA”) buffer that was used as staining and washing media for PBMC. For some experiments, CyPBS/BSA was supplemented with 0.05% v/v sodium azide (Teknova, Hollister, CA) and 2 mM EDTA (Hoefer Inc., Holliston, MA). Buffers were filtered over 0.22 μm membranes (PALL, Ann Arbor, MI, or EMD Millipore, Billerica, MA). Unlabeled, carrier protein-free antibodies (Table SI) were purchased from Biolegend (San Diego, CA), BD Biosciences (San Jose, CA), Santa Cruz Biotechnology (Dallas, TX), R&D Systems (Minneapolis, MN) and Miltenyi Biotech (San Diego, CA). In-house conjugations were carried out using MAXPAR® kits (Fluidigm, Sunnyvale, CA) according to the manufacturer’s instructions. This includes CD45-In113 and CD45-In115 barcoding agents. Highly isotopically-enriched metal salts not available through Fluidigm were purchased from Trace Sciences (Richmond Hill, ON, Canada). Antibodies were diluted to working concentrations in CyPBS/BSA and filtered over 0.1 μm spin filters (Amicon, Millipore, Billerica, MA).
PBMC
PBMC were prepared from whole blood or from TrimaAccel® leukoreduction system (LRS) chamber content (Terumo BCT, Lakewood, CO) obtained from Stanford Blood Center by gradient centrifugation over Ficoll medium (GE Healthcare, Uppsala, Sweden), washed and cryopreserved according to standard procedures (http://iti.stanford.edu/himc/documents/SOP-PBMCDirectFicollHeparinv1-4-1.pdf). Frozen PBMC were kept in vapor phase liquid nitrogen for longer-term storage. For experiments, PBMC samples were thawed in a 37°C water bath and washed twice in RPMI 1640 (HyClone®, Thermo Scientific, Waltham, MA) supplemented with 10% FBS (Atlanta Biologicals, Flowery Branch, GA) in 15 mL Falcon tubes (BD Biosciences), penicillin and streptomycin and 10U/mL benzonase (Sigma), resuspended in PBS, and kept on ice for further use. PBMC were counted and checked for viability using a Vicell counter (Beckman Coulter, Brea, CA). PBMC viability was typically >95%. Blood sample donors were enrolled under IRB protocol #31256.
Pd barcoding reagents
SCN-Bn-EDTA was loaded with Pd ions as described (14, 16). 10 mg SCN-Bn-EDTA (Dojindo, Santa Clara, CA) chelator were dissolved in 1 mL “L” buffer (Fluidigm) by vortexing and warming in a water bath. To load the chelator with Pd ions, 28.5 μL 100 mM solution of isotopically-enriched Pd nitrate (Trace Sciences, Richmond Hill, ON, Canada) in 5 N HCl were added to the 22.8 mM SCN-Bn-EDTA solution to achieve a molar chelator:metal ratio of 2:1. After mixing and incubation for one minute, aliquots were snap-frozen in liquid nitrogen and lyophilized overnight in a benchtop freeze-dryer (Labconco, Kansas City, MO, USA). Lyophilized products were dissolved in DMSO (Sigma) to yield a 10 mM solution and were kept at −20°C until use.
50 μg CD45 Ab (clone HI30, Biolegend, San Diego, CA) were washed 2–3 times with 350 μL CyPBS over a 30kDa spin filter (Amicon, EMD Millipore, Billerica, MA), for 10 min at 4°C and 17,500 × g. Pd-loaded SCN-Bn-EDTA stock was thawed and 6.4 μL were added to the Ab dissolved in a total of 313 μL PBS, mixed by pipetting and incubated for 1 h at 37°C in a water bath.
The conjugate was washed at least three times with 300 μL CyPBS over a 30kDa spin filter for 10 min at 4°C and 17,500 × g, then transferred to a 1.6 mL microcentrifuge tube. Protein concentration was quantified by Nanodrop (Thermo Fisher, Waltham, MA, USA) at 280 nm and Ab stabilizer (Candor Biosciences, Wangen, Germany) was added to the Ab preparation to a final concentration of 50%. Ab were kept at 4°C.
The kinetics of Ab labeling with Pd-loaded SCN-Bn-EDTA were investigated in a time course experiment, revealing that most labeling occurs within few minutes after mixing (Figure S1A). Few if any metal ions bound non-specifically to the Ab, as washing the Ab conjugate with counter chelators (3 washes with 300 μL each wash over a 30kDa spin filter with 5 mM nitrilotriacetic acid (NTA, Sigma) or 44 mM N-(2-hydroxyethyl)iminodiacetic acid (HIDA, Dojindo) did not suppress the signal of a CD45-Pd106 staining (Figure S1B). This confirms that Pd-labeling of Ab was achieved by Pd ions complexed by EDTA with high affinity rather than by non-specific, low(er) affinity interactions.
Barcoding and immunophenotyping of PBMC
Individual CD45 Ab conjugates were diluted in CyPBS/BSA to 3x the working concentration (2–5 μg/mL) in the final barcoding reaction on 0.1 μm spin filters. An example titration experiment is shown in Figure S1C for CD45-Pd106. After centrifugation (17,500 × g, 10 min, cooled benchtop centrifuge, Eppendorf), filtered Ab were used to prepare up to 20 barcoding mixes in a 96 U-bottom well polystyrene microtiter plate (Corning).
For barcoding, 7.5×10⁵ cells from individuals PBMC samples were pelleted in cavities of a 96-well polypropylene V-bottom 2 mL-deep-well block (Corning, Tewksbury, MA, USA) and stained with 20 μL of premade combinations of 0.1 μm filtered CD45 Ab for 20 min at 4°C. For some reagent validation experiments, 1.5 mL polypropylene Eppendorf tubes (Eppendorf, Hauppauge, NY, USA) were used as reaction vessels. Afterwards, PBMC were washed twice in 1 mL CyPBS/BSA, resuspended in CyPBS/BSA, combined into a single well, spun down (10 min, 483 × g), and subjected to staining with a 50 μL surface Ab cocktail for 45 min at 4°C.
Afterwards, the sample convolute (up to 1.5×10⁷ cells) was washed twice in 1 mL CyPBS/BSA, once in CyPBS, and subjected to a protocol for dead cell identification modified from Fienberg et al. (18) Briefly, cisplatin (Enzo, Farmingdale, NY) 100 mM stock solution in DMSO was thawed and diluted to 25 μM solution in CyPBS. Cell pellets were resuspended in 100 μL of cisplatin solution for 1–2 min (in one experiment, 5 min) and the reaction was stopped by mixing with 1 mL RPMI1640/15% FBS and centrifuging at 800 × g for 10 min. Cells were then washed once in 1 mL CyPBS/BSA, once in 1 mL CyPBS, and fixed for 20 min at room temperature in 100 μL 2% formaldehyde solution freshly diluted with CyPBS from 16% stock ampules (EMS, Hatfield, PA, or Alfa Aesar, Ward Hill, MA). PBMC were then washed twice (10 min, 800 × g) in 1 mL CyPBS/BSA and permeabilized in 100 μL 1x saponin solution freshly made with CyPBS from 10x concentrate (1% saponin concentration, Affymetrix, Santa Clara, CA) for another 20 min at room temperature. After washing PBMC once in CyPBS/BSA, the pellet was resuspended with a 50 μL cocktail containing Ab against intracellular targets diluted in CyPBS/BSA and filtered through 0.1 μm spin filter prior to use. After 20 min incubation at 4°C, cells were washed in CyPBS/BSA and stored overnight at 4°C in CyPBS/BSA. The next day, cells were washed in CyPBS prior to 20 min incubation at room temperature with Iridium intercalator (Fluidigm) diluted in CyPBS per manufacturer’s instructions. Thereafter, PBMC were washed twice in 1 mL CyPBS/BSA, optionally once in CyPBS and twice in 500 μL water. For acquisition of barcoded cell samples on CyTOF®, PBMC were resuspended in 1 mL water supplemented with EQ™ Four element calibration beads (Fluidigm), and 100 μL portions of the suspension were further diluted 1:20 v/v with bead/water solution prior to filtering through a 35 μm mesh and injecting into the instrument in 500 μL volumes. Supernatants were aspirated using a pipette or vacuum manifold throughout the protocol.
Additional PBMC samples used for validation of Ab and head-to-head comparisons were processed in a similar way, using 20 μL staining volumes of Ab cocktail instead of 50 μL volumes.
Mass cytometry
The CyTOF® instrument (version 1, Fluidigm) was started, tuned, and cleaned as described before on a daily basis (8), using tuning and wash solution (Fluidigm). Ultrapure argon was supplied by Praxair (Danbury, CT). The spray chamber was cleaned daily with water and dried with lab air. Cells were injected as a single-cell suspension in water or water supplemented with EQ™ Four element calibration beads (Fluidigm) after filtration through a 35 μm nylon mesh (cell strainer cap tubes, BD, San Jose, CA) immediately prior to acquisition. Data were acquired in Dd ‘internal’ calibration mode, with noise reduction turned off and lower and upper cell length parameter values set to 10 and 75, respectively. FCS files were generated by CyTOF® instrument control software v5.1.602 (Fluidigm), which also served to control the instrument. Calibration bead signals were used to monitor the detector performance over the runtime. Since no major variation was noted (Figure 3A) we chose not to normalize the data using calibration beads. Samples were injected into the sample loop in portions of 500 μL every ~8 min and cells were filtered over a 35 μm mesh prior to every other injection. 1 mL and 3 mL syringes (Henke Sass Wolff, NORM-JECT, Tuttlingen, Germany) were used to inject samples or accessory liquids.
Figure 3. Boolean deconvolution of the barcoded sample convolute.

Representative analysis of a convolute of barcoded samples. 20 different PBMC samples were CD45-barcoded as illustrated in Figure 2, combined and further processed and acquired as one single sample. (A) Over the acquisition time of the barcoded sample convolute, signal intensities were stable as demonstrated for three different mass channels reflecting the expression of HLA-DR, CD20, and CD14. The channel used for HLA-DR detection was also occupied by normalization beads containing 175Lu, which appear as a horizontal streak at a signal intensity of ~5000. (B) Of all acquired events, beads were excluded from the analysis and only nucleated (DNA-‘positive’) cell events were further analyzed. After strict gating for nucleated events excluding events showing either very high or low 193Ir/191Ir signals resulting from staining with an Ir-loaded DNA intercalator, analysis was additionally restricted to events with a cell length parameter value lower than 50. (B) The remaining cell events were gated according to CD45 signals in six different channels and split into ‘positive’ and ‘negative’ subsets. (D) Annotated screenshot from a FlowJo workspace illustrating the deconvolution of data. After initial gating as shown in (A) and bivariate gating in CD45 channels (B), Boolean gates were generated to reflect all possible barcode combinations, 20 of which were actually used (“Slot01..Slot20”), leaving 44 unused or ‘illegal’ barcodes (“Z01..Z44”). Plus and Minus signs were used in each line to identify the actual barcode combination in an ascending order of the mass label (104-106-108-110-113-115).
Data analysis and presentation
FlowJo software (v. 9.6.4 – 9.7.6, Treestar, OR, USA) was used to concatenate, deconvolute, analyze, and display data, with log parameter ranges set to 20,000, axes displaying 5 log decades and width basis set to −20.
Data from barcoded composite samples were deconvoluted using a Boolean gating strategy based on bivariate distribution of cells over signal intensities of CD45 staining used for barcoding. In experiments used for Figure 1, sample-to-sample carry-over events were electronically excluded from analyses, by electronic exclusion of events which showed bright signals in mass detection channels which were not used in the particular experiment. For some analyses, deconvoluted data were exported by FlowJo and re-imported as single files. In case of unintended interruption of mass cytometry measurements, multiple FCS files were collected per sample, which were concatenated using FlowJo. Cell frequencies and signal intensities were determined using FlowJo, CV were calculated in MS Excel using CV=STDEV(dataset)/abs(average(dataset)). GraphPad Prism 6 (GraphPad Software, San Diego, CA) was used to analyze data. Excel for Mac 2011 v14.4.4 (Microsoft, Redmond, WA) was used to generate heatmaps. ChemBioDraw v13.0 (Perkin Elmer, Waltham, MA) was used for the illustration in Figure 1A, Powerpoint (Microsoft) and Illustrator CS4 (Adobe, San Jose, CA) for assembling figures.
Figure 1. Production and validation of CD45 Ab conjugates used for barcoding.

(A) Workflow for the generation of Pd-labeled CD45 antibodies using isothiocyanobenzyl-EDTA. The blue box reflects isothiocyanobenzyl-EDTA, the structure of which is depicted in the blue insert. (B) CD45 antibody retains specificity after Pd-labeling. PBMC were stained with CD45-Pd106 with or without prior incubation with excess unlabeled CD45 antibody and analyzed by mass cytometry. Numbers reflect geometric mean signal intensities. (C) PBMC were stained with one or combinations of up to three different CD45 Abs labeled with the indicated metal ions. Numbers reflect geometric mean signal intensities. The background visible in the ‘unstained’ control for CD45-In115 results from isotopic impurity of In113 used in the staining with CD45-In113.
Results
Pd-labeling of CD45 antibodies
In the interest of maintaining the number of cytometric channels for analytes of interest, we chose to make reagents that permit the exploitation of hitherto unused mass detection channels of the CyTOF® instrument. Different from a previous approach to generate Pd-labeled Ab (17), we utilized isothiocyanobenzyl-EDTA (SCN-Bn-EDTA), an amine-reactive compound carrying EDTA as a metal ion chelating moiety, to generate a series of CD45 antibodies labeled with highly isotopically pure palladium ions (Pd104, Pd106, Pd108, Pd110) (Figure 1A). SCN-Bn-EDTA was loaded with Pd ions in aqueous solution at 0.5 equivalents, lyophilized, and redissolved in DMSO for long-term storage at −20°C (14, 16). The Pd-loaded compound was used to label CD45 Abs by targeting the Ab’s primary amines (detailed in Materials & Methods). Inhibition of the CD45-Pd conjugate signals by pre-incubation of PBMC with excess unlabeled CD45 Ab or differently labeled CD45 Ab prior incubation with CD45-Pd conjugates demonstrates that Pd-labeled CD45 Abs retained their specificity for CD45 (Figure 1B, S1D,E). Ab labeling with In113 and In115 was carried out using MAXPAR® labeling kits. As expected, staining of PBMC with combinations of two and three different CD45 conjugates resulted in reductions of signal intensities, yet still permitted separation of CD45+ cells (Figure 1C). For the final barcoding protocol, a total of six different CD45 Ab conjugates were used; four Pd-labeled as well as In113- and In115-labeled CD45 Abs.
Barcoding strategy and procedure
Based on those six available CD45 Ab conjugates, up to 26=64 samples could theoretically be barcoded using distinct combinations of the antibodies. Instead of using all 64 combinations for barcoding, we chose to restrict barcodes to combinations of three and only three labels for each barcoded sample as in Zunder et al. (16), yielding 20 unique combinations (Figure 2B). This has the advantage of equalizing CD45 staining intensities, since all samples are stained with exactly three distinct CD45 conjugates. It also decreases the chances of misidentification of a cell’s barcode, due to dim staining with one or more CD45 antibodies; such cells would be eliminated in the three-and-only-three scheme, rather than being attributed to an incorrect barcode. A corollary of this is that cell aggregates assigned to two or more distinct barcodes are also eliminated, rather than being attributed to an incorrect barcode.
Figure 2. Barcoding strategy.
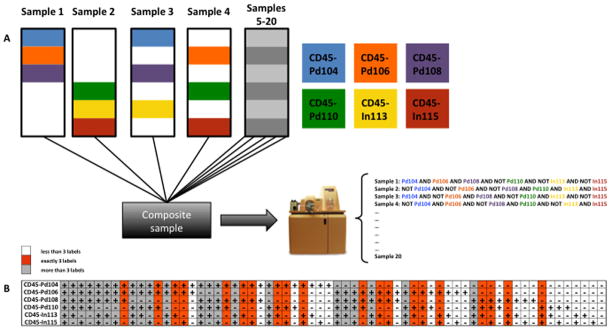
(A) Scheme illustrating the combinatorial sample barcoding approach using six different CD45 Ab conjugates. (B) Among the total of 26 possible combinations, only barcodes with exactly three labels were used (orange), all other combinations with more (grey) or less CD45 labels (white) are not used and events populating unused or “illegal” barcode slots are excluded from the analyses as illustrated in Figure 3.
PBMC were barcoded by incubation with unique, premixed combinations of three different CD45 conjugates, then washed, combined, and further processed together as one single sample. Labeling of CD45+ cells with CD45 Ab was stable during washing, fixation and permeabilization steps, as demonstrated before for CD45 and other surface markers (1). Upon data acquisition on the CyTOF® instrument, significant variation in signal intensities were not noted (Figure 3A). FCS files were exported and deconvoluted using a Boolean gating strategy designed in FlowJo software, based on the combinations of ‘present’ and ‘absent’ CD45 signals shown by each individual cell. These Boolean gates were created after gating on DNA-containing cells, exclusion of beads (9), and gating on a “cell length” window set to ~15–50 (Figure 3B,C). Assuming equal contributions of each sample to the total number of cell events in the composite sample, frequencies of CD45+ cells should be 50% in each barcoding channel, which was confirmed with slight deviations (44.1% – 51.5%). The Boolean deconvolution allowed for retrieval of the barcoded samples, which could be exported as single FCS files for further analysis, if desired. Deconvolution also resulted in the electronic removal of events that did not fit into any of the barcoding slots, i.e. all events carrying either more than or less than exactly three CD45 labels (Figure 3D).
Samples properties are maintained in the CD45 barcoding protocol
We performed three experiments with sets of 20, 14, and 20 individual PBMC samples, respectively, which were stained and run as either separate samples or as a composite of barcoded samples (Table I). After initial data deconvolution (composite samples) or simple gating for CD45+ cells (non-barcoded samples, Figure S2), staining patterns were inspected, and frequencies of major cell subsets were determined by manual gating. Signal intensities across mass channels used for Ab analytes of the gated cells were also analyzed. This was done in corresponding datasets from individual and barcoded measurements. Overall, CD45-barcoding improved consistency of the staining pattern across barcoded samples compared to individually run samples (Figure 4A), making manual gating of barcoded sample data less time consuming, as gates rarely required adjustment. Frequency and signal intensity data showed good to excellent correlation between barcoded and non-barcoded samples in all three experiments. Figure 4 illustrates an example of B cell data. Relative frequencies of CD20+ B cells among CD45+ cells determined in the barcoded samples largely matched those from non-barcoded samples. Correlation of cell frequency data was maintained when IgA+ and IgD+ subsets of B cells were analyzed, representing a smaller and a larger subpopulation of CD20+ B cells, respectively (Figure 4B). In one experiment, frequencies of ‘type 2’ BDCA-3+ myeloid dendritic cells (19) (BDCA-3+ mDC, CD45+BDCA-3+) as well as basophils (CD3−CD20−CD33−CD14−CD123+SyklowHLADR−) and CD3-CD20−CD33−CD14−CD123+SykhighHLA-DR+ plasmacytoid dendritic cells (pDC), were analyzed in order to address data reproducibility of extremely rare cell subsets. Despite their low frequencies among total CD45+ cells (at average <0.01% for BDCA-3+ mDC, <0.5% for basophils, <0.4% for pDC), data were well correlated (Spearman correlation analysis, BDCA-3+ mDC, r=0.81, p<0.0001; basophils, r=0.64, p=0.002 and pDC, r=0.78, p<0.0001). Also, distinctive features of individual PBMC samples such as exceptionally low expression of CD33 by monocytes can be reliably traced and reproduced in the barcoded sample data (Figure S3; for example, sample #10 in Figure S3A).
Table I.
Runtime and cell recoveries in three CD45 barcoding validation experiments
| No of samples barcoded | number of cell events acquired* | runtime of the barcoded convolute** | cells recovered per barcoded sample | |
|---|---|---|---|---|
| Experiment 1 | 20 | 1,676,767 | 198min | 45,139 (28,140–58,559) |
| Experiment 2 | 14 | 1,420,057 | 183min | 33,013 (9,060–61,348) |
| Experiment 3 | 20 | 2,235,999 | 220min | 51,193 (5,891–92,027) |
This number reflects “DNA+” events, calibration beads and debris excluded.
In all three experiments, the acquisition was terminated while more than 50% of the sample was left.
Figure 4. Data recovered from CD45-barcoded and then deconvoluted samples recapitulate data of non-barcoded PBMC samples.

14 or 20 unique PBMC samples were CD45-barcoded and combined into one single sample. Aliquots of the identical samples were processed as individual samples. Both individual samples and the CD45-barcoded sample convolute were stained with the identical Ab cocktail using the same protocol in each experiment (except for an additional water wash of the barcoding sample prior to injection). They were acquired on the same day on the same mass cytometer. Results from three independent experiments are shown. (A) Histogram overlays depict CD20 expression of all individually acquired samples in a particular experiment (left, colored histograms) and the corresponding CD45-barcoded and deconvoluted samples (right, colored histograms). The bold black histogram is identical in each pair of corresponding plots and depicts the CD20 expression of all barcoded samples together. (B) Frequencies of CD20+ B cells among CD45+ cells as well as frequencies of IgA+ and IgD+ B cells among CD20+ B cells were determined as shown in the dotplots on top of the figure in both CD45-barcoded/deconvoluted as well as individually processed and run samples. The graphs compare cell frequencies obtained in barcoded vs. individual measurements for each of the three experiments. Each dot represents a unique PBMC sample. R and p values resulting from Spearman correlation analyses as well as slopes resulting from linear regression (with the line forced through x=0, y=0) are included along with each graph. (C) Median signal intensities for various surface or intracellular markers were determined in total CD20+ B cells, IgA+ B cells, and IgD+ B cells in barcoded and corresponding individual samples. R and p values from Spearman correlation analyses between barcoded and individual samples were used to generate heatmaps, where red color indicates high r values or low p values, respectively. Data were grouped according to whether or not a particular marker is commonly expressed by human peripheral blood B cells. Within both groups, data are sorted from left to right according to ascending atomic mass of the reporter metal used.
Signal intensities were determined in several subsets of monocytes, T cells, and B cells. Figure 4C depicts correlation analyses for total, IgA+, and IgD+ B cells for several molecules that are known to be expressed by, or absent from, B cells. Good correlations between barcoded and individually measured sample data were seen for antibodies detecting antigens that are known to be expressed by B cells (such as HLA-DR, CD19, CD20, CD32, CD85j, and Syk), but generally not for unused channels (Cd112, Eu151; not shown) or unrelated markers (e.g., CD33, CD3, CD4, CD8, CD28, CD161, TCRγδ, CD45RO, or CD16) (Figure 4C). Of note, signal intensity correlations in IgA+ B cells were good and comparable to that of more abundant cell subsets, despite the scarcity of IgA+ B cell events, at average (representing 0.41% – 0.57% of total CD45+ cells, or between 146 and 325 cell events in an individual sample file).
We also assessed markers commonly expressed by monocytes such as CD33, CD32, Syk, HLA-DR, CD11c, and CD14; these were found to correlate between barcoded and non-barcoded samples when monocytes were gated (according to CD33 and CD14 expression). Similarly, for T cell markers (e.g. CD28, CD45RA, CD45RO, CD4, CD25, CD27) when T cells were gated (CD3+CD4+ and CD3+CD8+ T cells; data not shown). Overall, high average signal intensity shown by a marker in a particular cell subset selected for better correlation (as judged by high Spearman r value and low p value) compared to lower signal intensity parameters (data not shown).
CD45-barcoding resulted in visibly less sample-to sample variation of the general staining pattern (Figure 4A), but also of variation coefficients (CV) of signal intensity data of barcoded compared to individually processed and acquired data sets (Figure 5A). Overall, 88.9 % of 757 pairwise comparisons between signal intensity data showed smaller CV in the barcoded version. The median CV was 20.9% in the barcoded samples compared to 44.2% in the data sets of individually processed samples (p<0.0001, Wilcoxon test). The CD45-barcoding related improvement in the CV was due to both reductions in CV of specific as well as background staining (Figure 5B).
Figure 5. CD45-barcoding reduces technical variation in mass cytometry data sets.

Variations coefficients of analyte-specific median signal intensity data were determined for each series of cell subsets in the three experiments shown in Figure 4. These comprise CD4+ and CD8+ T cells, IgD+ and IgA+ B cells, as well as total CD45+ cells and monocytes gated according to CD33/CD14 or CD32/Syk expression. Data from CD123+ and BDCA-3+ cell subsets were additionally considered in one experiment. The CV from barcoded analyses were plotted against the CV from individual analyses. Only data with an average signal intensity value of >1 were considered, to avoid near-zero problems resulting from division by very small values in the determination of CV. Empty mass channels and channels reflecting DNA intercalator or cisplatin staining were not considered either. Thus, a total of 757 data points are shown in (A), representing 82% of the entire dataset. A diagonal is shown for orientation. Data sets with lower CV in individually measured samples compared to barcoded samples locate below the diagonal, data sets with lower CV in barcoded samples locate above the line. (B) Two examples extracted from the overall analysis illustrate reductions of CV in cases representing specific staining (left panel, CD32 signal of IgA+ B cells) or background staining (right panel, Syk signal of CD3+ T cells).
In summary, biological sample characteristics were maintained when PBMC were stained and acquired as a barcoded composite sample. At the same time, CD45-barcoding largely reduced data variability by harmonizing sample preparation and acquisition conditions.
Removal of aggregates and cell recovery
The exclusion of cell events not meeting the requirements of any of the barcode slots (Figure 2) depletes cells that carry either more or less than three different CD45 labels. This strategy obviously selects directly against cell events that comprise data from two (or more) actual cells carrying different barcodes (inter-sample “doublets”). Such cells always yield a combination of at least four different CD45 signals and are therefore excluded during data deconvolution. In addition, CD45-barcoding minimized the presence of intra-sample cell “doublets” in the deconvoluted data (see Discussion), as revealed by analyzing frequencies of cells with simultaneous staining of different, mutually exclusive cell lineage markers such as combinations of CD3, CD14, and CD20 (Figure 6). For example, even after applying strict pregating routinely used to deplete cell aggregates (Gating 1, upper panel in Figure 6A), CD45-barcoding reduced the frequencies of CD14+CD20+ events at average to 0.02%, 0.08%, and 0.16% in the three different sets of barcoded samples. This is in comparison to 0.21%, 0.24%, and 0.32% in the cell population that was excluded due to carrying more than three CD45 labels and to 0.10%, 0.09%, and 0.11% in individually acquired samples analyzed using a similar gating strategy, respectively. Events excluded due to carrying less than three different CD45 labels contained very low frequencies of cell doublets. Similar analyses of CD3+CD20+ and CD3+CD14+ doublet populations confirmed these overall results. Based on that, we tested whether CD45-barcoding alone was sufficient to remove intra-sample cell doublets from the sample convolute; When applying stepwise less stringent pregating whose main purpose is to exclude cell doublets, CD45-barcoding alone resulted in a similar removal of aggregates compared to use of DNA and cell length parameter gates and also allowed for similar cell recovery as compared to individually run samples. Using wide DNA and cell length gates (Figure 6A, Gating 4), recoveries were 55.3%, 37.9%, and 48.7%, respectively, matching the average recovery of ~50% typically achieved in individual, non-barcoded measurements. In summary, CD45-barcoding efficiently eliminates cell doublet events and selects for live cells while cell recoveries similar to those of individual measurements can be achieved.
Figure 6. CD45-barcoding removes ‘doublet’ cell events.

The presence of cell doublets was traced for the example of events showing simultaneous expression of the monocyte marker CD14 and the B cell marker CD20 in three independent experiments. One representative data set is shown. (A) Four different gating strategies applied to the sample convolute prior to CD45 gating and deconvolution were compared, differing in the stringency of DNA and ‘cell length’ gating (Gating 1, small DNA gate, length restriction; Gating 2, small DNA gate, no cell length restriction; Gating 3, wide DNA gate, cell length restriction; Gating 4, wide DNA gate, no length restriction). Biaxial dotplots showing CD14 vs CD20 expression with a gate set on CD14+CD20+ doublet events are shown for pregated cells prior to deconvolution, and after deconvolution, for barcoded samples (corresponding to all cells from merged data from Slot01 through Slot20, illustrated in Figure 3D), and for cell events excluded during deconvolution due to carrying either more (merged Z01 through Z22 in Figure 3D) or fewer (merged Z23–Z44) than three CD45 labels, respectively. (B) Summary graph depicting the presence of CD20+CD14+ events in barcoded samples and cells excluded during deconvolution. Two independently processed sets of individually processed and acquired sample data from corresponding PBMC samples are shown for comparison on the right of the graph.
Discussion
Fluorescent barcoding has been used successfully in conventional flow cytometry (20–22), and the strategy has been recently applied to mass cytometry, using metal-loaded, thiol-reactive compounds used for intracellular staining, after cell fixation and permeabilization (13). Here we describe a barcoding technique for mass cytometry experiments using differently-labeled antibodies directed against cell surface-expressed CD45, allowing for barcoding of live CD45-expressing cells. Four out of the six different CD45 antibodies occupy Pd channels outside the hitherto used channels of the CyTOF® instrument, leaving the core window between atomic masses 139 and 176 for analyte specific reagents. In addition, due to the barcoding reagent mass labels used, interferences between signals from barcode stainings and analyte detection (such as +1 spillover or +16 oxide formation) is technically impossible. Pd- and In-labeled CD45 antibodies were used over weeks/months without notable loss of staining intensity and were kept in aqueous buffer at 4°C, allowing for easier reagent handling as compared to hydrolysis-sensitive maleimido-mono-amide-DOTA compounds used previously (13). A previously described protocol to label Ab with Pd appeared to be more time consuming and difficult to perform in a lab not set up for chemical syntheses (17). In contrast, the protocol described herein to generate barcoding Ab is comparably simple and can be performed within two days, using commercially available materials and predominantly standard laboratory equipment.
The ability to barcode live cells prior to any fixation and permeabilization permits unequivocal surface staining of antigens at identical quality and staining patterns as in routine PBMC analyses. In contrast, alternative cell barcoding protocols (13–16, 20) required fixation and at least partial permeabilization of cells prior to barcoding. Since fixation (commonly with PFA) modifies or destroys many surface epitopes recognized by Ab, the requirement for fixation restricts the Ab clones applicable for staining of the barcoded sample convolute.
Thus, CD45-barcoding should not interfere with the data integrity or biological properties of the barcoded samples, which we confirmed experimentally by demonstrating overall correlation of cell frequency data and signal intensity between barcoded and individually prepared samples. Some deviations were noted in the signal range occupied by sample cells of some mass detection channels, which is certainly a result of the differing Ab saturation conditions in the composite sample (15×106 cells, staining volume 50 μL) vs. individual samples (5×10⁶ cells, staining volume 20 μL). In addition to the de facto harmonization of sample preparation including antibody staining, fixation, permeabilization, washing steps, and acquisition conditions on the CyTOF® instrument, the deconvolution of the barcode largely depletes cell “doublets” formed between differently barcoded samples and reduces intra-sample doublets. The latter appears to result from the stochastics of how doublet events can be generated. Assuming that the frequency of doublets in a given sample as a function of cell density in the injected cell suspension is constant over its runtime, the likelihood that a detected doublet event in the undeconvoluted data is a doublet formed between two cell events from differently barcoded samples (an inter-sample doublet) is directly proportional to the number of samples barcoded. Thus, the more samples are barcoded, the less likely it is to detect a cell doublet that results from two cells of the same sample (an intra-sample doublet).
Overall, CD45 barcoding results in a significant clean-up of the data that permits use of largely identical gates in manual analyses and reduces pre-processing work prior to algorithmic approaches. The doublet removal feature is of particular importance since there are no mass cytometry analogues of light scatter measurements, which are used to identify and remove doublets in conventional flow cytometry. Once cells have been barcoded, liquid handling and reagent consumption are greatly reduced. Small to moderate savings can be expected in CyTOF® runtime for the composite sample compared to a series of individually acquired samples, as portions of the composite sample can be successively injected without washing steps between injections. Thus, sample-to-sample carryover problems are largely eliminated. Over the runtime of our composite samples (3–4 h), we did not note major variation in signal intensities of stained cells or metal-loaded beads mixed into the sample. In case of such variation, data can be normalized based on bead signal intensities (9).
While the approach is designed to work with one of the most abundantly used material for cellular biomarker research, i.e. PBMC, all of which express high levels of CD45, limitations may occur when cell samples are used which express low or heterogeneous levels of CD45, as could be the case with cell lines or non-leukocytes. In such cases, the approach could be rebuilt with antibodies better suitable to the particular cell material, with the requirements that the analyte is stably and abundantly expressed and is not expected to be regulated in the different samples that are barcoded, and that high affinity probes are available. In the case of live PBMC, these requirements are fulfilled with CD45 antibody. In addition, possible contaminants of PBMC preparations such as residual erythrocytes or thrombocytes do not express CD45, are not stained by the barcoding reagents, and are therefore depleted in the deconvolution, even when they were detected as cell events by staining of their surface receptors. An extremely rare but possible limitation is CD45 deficiency, a rare genetic disorder that causes a severe combined immunodeficiency (SCID) phenotype (23). As CD45 modulates antigen receptor and cytokine signaling (24), binding of cell membrane CD45 with anti-CD45 Ab could influence functional outcome of stimulation assays, if barcoding were done prior to stimulation. CD45 expression by all target cells must be confirmed when applying the method to other mononuclear cells of tissues other than blood or certain clinical conditions. For example, some plasma cells of the bone marrow show low CD45 expression, especially in multiple myeloma (25, 26).
Further variations of the protocol can be considered, such as using more or fewer Ab conjugates for barcoding to accommodate different numbers of samples in the barcoded convolute, or modifying the number of labels for the barcoded samples. For example, using five different antibodies permits barcoding of ten samples when each sample carries unique combinations of two labels. Furthermore, CD45-barcoding could be performed using conventional, lanthanide-labeled CD45 Ab, could be applied to MACS- or FACS-based pre-enriched cells and could likely also be used prior to separation protocols, for enrichment of cells in the composite sample. In theory, up to 64 samples could be barcoded to be run as one convolute, by giving up the ‘3-only’ strategy, thereby accepting such an experiment would not benefit from doublet removal and would be prone to a certain degree of sample cross-contamination.
Considering the relatively low cell throughput on CyTOF® instruments, maximizing cell recovery is crucial in studies requiring high throughput. In that regard, the cell recovery from the barcoded convolute was comparable to that of individually acquired samples.
Cell events excluded during the deconvolution due to showing more than three CD45 labels comprise inter-sample doublets, reflecting both physical aggregates of cells but also the possibility of two or more cells’ ion clouds hitting the detector in such time proximity that the CyTOF® software assigns them to one single cell event. While the former parameter depends on properties such as adherence and sample preparation, the latter is a function of cell density in the injected suspension. Cells which show low adherence and that are acquired by CyTOF® at low event rate will generate fewer doublet events and minor loss to barcodes with >3 labels. Conversely, cell events assigned to barcodes with less than three CD45 labels comprise cell debris, but may also contain contaminating CD45low cells, i.e. non-PBMC.
While the cell throughput per se cannot be increased with the current instrumentation, improvements of CD45 staining intensities and/or lowering the CV of CD45 staining would lead to a better separation between CD45-stained and unstained cells in the barcode channels, and could thereby contribute to enhanced recovery after data deconvolution.
Finally, the concept of using antibody-based barcoding is not limited to mass cytometry but can be likewise applied to flow cytometry experiments. The approach is more feasible with increasing availability of cytometric channels on high-end conventional or continuous-spectrum detecting flow cytometers.
Barcoding using CD45 antibodies facilitates increased throughout and multiplexed mass cytometry analyses of human PBMC, and contributes to data accuracy and comparability in mass cytometry-based biomarker research.
Supplementary Material
Acknowledgments
The authors are indebted to Eli Zunder for discussions about barcoding strategies and sharing SCN-Bn-EDTA loading procedures. We thank Meena Malipatlolla for technical support.
Abbreviations
- CyTOF
cytometry by time-of-flight
- CV
coefficient of variation
- SCN-Bn-EDTA
isothiocyanobenzyl-EDTA
Footnotes
HEM was supported by a fellowship from the Deutscher Akademischer Austauschdienst (DAAD), Bonn, Germany and is supported by a fellowship from the Deutsche Forschungsgemeinschaft (DFG), ME 3644/2-1. This study is supported by grants 5U19AI057229, 5U19AI090019, and S10RR027582 from the NIAID, NIH.
Authorship
HEM conceived and performed experiments with CC, analyzed results, and made the figures. MDL made the SCN-Bn-EDTA reagents and performed experiments. ARS was involved in initial testing of CD45 Ab conjugates. HEM, MDL, and HTM planned research. HEM and HTM wrote the manuscript. MDL, CC, and ARS discussed results and edited the manuscript.
Conflict-of-interest disclosure: The authors declare no conflicting financial interests.
References
- 1.Bendall SC, Simonds EF, Qiu P, Amirel AD, Krutzik PO, Finck R, Bruggner RV, Melamed R, Trejo A, Ornatsky OI, Balderas RS, Plevritis SK, Sachs K, Pe’er D, Tanner SD, Nolan GP. Single-cell mass cytometry of differential immune and drug responses across a human hematopoietic continuum. Science. 2011;332:687–696. doi: 10.1126/science.1198704. [DOI] [PMC free article] [PubMed] [Google Scholar]
- 2.Tanner SD, Bandura DR, Ornatsky O, Baranov VI, Nitz M, Winnik MA. Flow cytometer with mass spectrometer detection for massively multiplexed single-cell biomarker assay. Pure Appl Chem. 2008;80:2627–2641. [Google Scholar]
- 3.Bendall SC, Nolan GP, Roederer M, Chattopadhyay PK. A deep profiler’s guide to cytometry. Trends Immunol. 2012 doi: 10.1016/j.it.2012.02.010. [DOI] [PMC free article] [PubMed] [Google Scholar]
- 4.Perfetto SP, Chattopadhyay PK, Roederer M. Seventeen-colour flow cytometry: unravelling the immune system. Nat Rev Immunol. 2004;4:648–655. doi: 10.1038/nri1416. [DOI] [PubMed] [Google Scholar]
- 5.Davis MM. A prescription for human immunology. Immunity. 2008;29:835–838. doi: 10.1016/j.immuni.2008.12.003. [DOI] [PMC free article] [PubMed] [Google Scholar]
- 6.Maecker HT, McCoy JP, Nussenblatt R. Standardizing immunophenotyping for the Human Immunology Project. Nat Rev Immunol. 2012;12:191–200. doi: 10.1038/nri3158. [DOI] [PMC free article] [PubMed] [Google Scholar]
- 7.Maecker HT, McCoy JP, Jr, Amos M, Elliott J, Gaigalas A, Wang L, Aranda R, Banchereau J, Boshoff C, Braun J, Korin Y, Reed E, Cho J, Hafler D, Davis M, Fathman CG, Robinson W, Denny T, Weinhold K, Desai B, Diamond B, Gregersen P, Di Meglio P, Nestle FO, Peakman M, Villanova F, Ferbas J, Field E, Kantor A, Kawabata T, Komocsar W, Lotze M, Nepom J, Ochs H, O’Lone R, Phippard D, Plevy S, Rich S, Roederer M, Rotrosen D, Yeh JH. A model for harmonizing flow cytometry in clinical trials. Nat Immunol. 2010;11:975–978. doi: 10.1038/ni1110-975. [DOI] [PMC free article] [PubMed] [Google Scholar]
- 8.Leipold MD, Maecker HT. Mass cytometry: protocol for daily tuning and running cell samples on a CyTOF mass cytometer. Journal of visualized experiments: JoVE. 2012:e4398. doi: 10.3791/4398. [DOI] [PMC free article] [PubMed] [Google Scholar]
- 9.Finck R, Simonds EF, Jager A, Krishnaswamy S, Sachs K, Fantl W, Pe’er D, Nolan GP, Bendall SC. Normalization of mass cytometry data with bead standards. Cytometry A. 2013;83:483–494. doi: 10.1002/cyto.a.22271. [DOI] [PMC free article] [PubMed] [Google Scholar]
- 10.Krutzik PO, Clutter MR, Trejo A, Nolan GP . FHI Consortium. Fluorescent cell barcoding for multiplex flow cytometry. In: Paul Robinson J, et al., editors. Current protocols in cytometry. Unit 6. Chapter 6. 2011. p. 31. [DOI] [PMC free article] [PubMed] [Google Scholar]
- 11.Zivanovic N, Jacobs A, Bodenmiller B. A Practical Guide to Multiplexed Mass Cytometry. Curr Top Microbiol Immunol. 2013 doi: 10.1007/82_2013_335. [DOI] [PubMed] [Google Scholar]
- 12.Gaudilliere B, Fragiadakis GK, Bruggner RV, Nicolau M, Finck R, Tingle M, Silva J, Ganio EA, Yeh CG, Maloney WJ, Huddleston JI, Goodman SB, Davis MM, Bendall SC, Fantl WJ, Angst MS, Nolan GP. Clinical recovery from surgery correlates with single-cell immune signatures. Science translational medicine. 2014;6:255ra131. doi: 10.1126/scitranslmed.3009701. [DOI] [PMC free article] [PubMed] [Google Scholar]
- 13.Bodenmiller B, Zunder ER, Finck R, Chen TJ, Savig ES, Bruggner RV, Simonds EF, Bendall SC, Sachs K, Krutzik PO, Nolan GP. Multiplexed mass cytometry profiling of cellular states perturbed by small-molecule regulators. Nature biotechnology. 2012;30:858–867. doi: 10.1038/nbt.2317. [DOI] [PMC free article] [PubMed] [Google Scholar]
- 14.Behbehani GK, Thom C, Zunder ER, Finck R, Gaudilliere B, Fragiadakis GK, Fantl WJ, Nolan GP. Transient partial permeabilization with saponin enables cellular barcoding prior to surface marker staining. Cytometry A. 2014 doi: 10.1002/cyto.a.22573. [DOI] [PMC free article] [PubMed] [Google Scholar]
- 15.Becher B, Schlitzer A, Chen J, Mair F, Sumatoh HR, Teng KW, Low D, Ruedl C, Riccardi-Castagnoli P, Poidinger M, Greter M, Ginhoux F, Newell EW. High-dimensional analysis of the murine myeloid cell system. Nat Immunol. 2014;15:1181–1189. doi: 10.1038/ni.3006. [DOI] [PubMed] [Google Scholar]
- 16.Zunder ER, Finck R, Behbehani GK, Amir el AD, Krishnaswamy S, Gonzales VD, Lorang CG, Bjornson Z, Spitzer MH, Bodenmiller B, Fantl W, Pe’er D, Nolan GP. Palladium-based Mass-Tag Cell Barcoding with a Doublet-Filtering Scheme and Single Cell Deconvolution Algorithm. Nature Protocols. 2014 doi: 10.1038/nprot.2015.020. accepted for publication. [DOI] [PMC free article] [PubMed] [Google Scholar]
- 17.Majonis D, Ornatsky O, Kinach R, Winnik MA. Curious results with palladium- and platinum-carrying polymers in mass cytometry bioassays and an unexpected application as a dead cell stain. Biomacromolecules. 2011;12:3997–4010. doi: 10.1021/bm201011t. [DOI] [PubMed] [Google Scholar]
- 18.Fienberg HG, Simonds EF, Fantl WJ, Nolan GP, Bodenmiller B. A platinum-based covalent viability reagent for single-cell mass cytometry. Cytometry A. 2012;81:467–475. doi: 10.1002/cyto.a.22067. [DOI] [PMC free article] [PubMed] [Google Scholar]
- 19.Ziegler-Heitbrock L, Ancuta P, Crowe S, Dalod M, Grau V, Hart DN, Leenen PJ, Liu YJ, MacPherson G, Randolph GJ, Scherberich J, Schmitz J, Shortman K, Sozzani S, Strobl H, Zembala M, Austyn JM, Lutz MB. Nomenclature of monocytes and dendritic cells in blood. Blood. 2010;116:e74–80. doi: 10.1182/blood-2010-02-258558. [DOI] [PubMed] [Google Scholar]
- 20.Krutzik PO, Nolan GP. Fluorescent cell barcoding in flow cytometry allows high-throughput drug screening and signaling profiling. Nature methods. 2006;3:361–368. doi: 10.1038/nmeth872. [DOI] [PubMed] [Google Scholar]
- 21.Frischbutter S, Schultheis K, Patzel M, Radbruch A, Baumgrass R. Evaluation of calcineurin/NFAT inhibitor selectivity in primary human Th cells using bar-coding and phospho-flow cytometry. Cytometry A. 2012;81:1005–1011. doi: 10.1002/cyto.a.22204. [DOI] [PubMed] [Google Scholar]
- 22.Simard C, Cloutier M, Neron S. Feasibility study: phosphospecific flow cytometry enabling rapid functional analysis of bone marrow samples from patients with multiple myeloma. Cytometry. Part B, Clinical cytometry. 2014;86:139–144. doi: 10.1002/cyto.b.21142. [DOI] [PubMed] [Google Scholar]
- 23.Kung C, Pingel JT, Heikinheimo M, Klemola T, Varkila K, Yoo LI, Vuopala K, Poyhonen M, Uhari M, Rogers M, Speck SH, Chatila T, Thomas ML. Mutations in the tyrosine phosphatase CD45 gene in a child with severe combined immunodeficiency disease. Nat Med. 2000;6:343–345. doi: 10.1038/73208. [DOI] [PubMed] [Google Scholar]
- 24.Penninger JM, Irie-Sasaki J, Sasaki T, Oliveira-dos-Santos AJ. CD45: new jobs for an old acquaintance. Nat Immunol. 2001;2:389–396. doi: 10.1038/87687. [DOI] [PubMed] [Google Scholar]
- 25.Pellat-Deceunynck C, Bataille R. Normal and malignant human plasma cells: proliferation, differentiation, and expansions in relation to CD45 expression. Blood Cells Mol Dis. 2004;32:293–301. doi: 10.1016/j.bcmd.2003.12.001. [DOI] [PubMed] [Google Scholar]
- 26.Schneider U, van Lessen A, Huhn D, Serke S. Two subsets of peripheral blood plasma cells defined by differential expression of CD45 antigen. Br J Haematol. 1997;97:56–64. doi: 10.1046/j.1365-2141.1997.d01-2115.x. [DOI] [PubMed] [Google Scholar]
Associated Data
This section collects any data citations, data availability statements, or supplementary materials included in this article.