Abstract
Background
Lower estimated glomerular filtration rate (eGFR) on a single occasion is associated with risk of cardiovascular events; whether the degree of change in eGFR during a 1‐year period adds prognostic information is unknown.
Methods and Results
We included adults who had ≥2 outpatient eGFR measurements (≥6 months apart) during a 1‐year accrual period in Alberta, Canada. According to recent guidelines, we used a change in eGFR category (≥90, 60 to 89, 45 to 59, 30 to 44, 15 to 29, and <15 mL/min per 1.73 m2), and the presence/absence of a ≥25% change from baseline to classify participants into 5 groups: certain drop, uncertain drop, stable (no change), uncertain rise, and certain rise. We calculated adjusted rates of cardiovascular events (per 10 000 person‐years) for each group. We estimated the adjusted risks of cardiovascular events associated with each category of change in eGFR, in reference to stable kidney function. Among the 526 388 participants, 76.1% (n=400 560) had stable, 2.6% (n=13 668) had a certain drop, and 3.3% (n=17 499) had a certain rise in eGFR. Compared with participants with stable kidney function, adjusted risks of myocardial infarction, heart failure, and stroke were 27%, 51%, and 20% higher, respectively, for those with a certain drop in kidney function. After adjusting for the last eGFR at the end of the accrual period, the observed association diminished.
Conclusion
Clinically relevant changes in eGFR are associated with increased risk of cardiovascular events. However, most of the apparent increase in risk can be accounted for by assessing comorbidity and baseline kidney function.
Keywords: Canada, cardiovascular diseases, clinical epidemiology, kidney function, short‐term change
Introduction
Chronic kidney disease (CKD) is a major public health concern,1prevalent in 10% to 16% of the adult population. It is associated with an increased risk of adverse outcomes, including cardiovascular (CV) events, in both general and high‐risk populations.2–8 While studies consistently show a graded association between severe CKD and adverse clinical outcomes,6–8 these reports focused on assessment of kidney function at 1 point in time and were not designed to examine the relationship between changes in kidney function on future risk. Considering the magnitude of changes in estimated glomerular filtration rate (eGFR) in addition to baseline eGFR alone might yield additional prognostic information.
The associations between change in kidney function over time and adverse outcomes have been reported in a few population‐based studies.9–15 These studies predominantly defined rate of change in kidney function based on repeated measures of eGFR over periods ranging from 3 to 10 years, which are not helpful in many clinical settings. While an annual assessment of change in eGFR is arguably the most practical means for clinical evaluation of CKD progression, the association between changes in kidney function during 1 year and risk of CV events remains unknown. Thus, using a population‐based cohort from a single province in Canada, we evaluated the associations of short‐term change in kidney function with the risk of specific CV events: hospitalization for acute myocardial infarction (AMI), congestive heart failure (CHF), and stroke.
Methods
Design, Setting, Population, and Data Sources
We conducted a population‐based cohort study of all adults ≥18 years of age in Alberta, Canada, who had ≥2 outpatient creatinine measurements (≥6 months apart) within a 1‐year period (Figure 1), using the data repository of the Alberta Kidney Disease Network (AKDN).16–18 The eGFR capture time frame was from May 2002 to March 2008, with follow‐up to March 2009 (ensuring ≥1 year of follow‐up for ascertainment of outcomes for all participants). Among the 1 818 381 patients with ≥1 outpatient serum creatinine measurement, there were 865 819 participants for whom ≥2 measurements were available in a 1‐year period. We further excluded individuals with: a history of CV events before cohort entry including AMI, CHF, or stroke; >24 measurements in a 1‐year period (possibly indicating unstable kidney function or frequent illness); baseline eGFR <15 mL/min per 1.73 m2; or measurements separated by ≤6 months (Figure 2).
Figure 1.
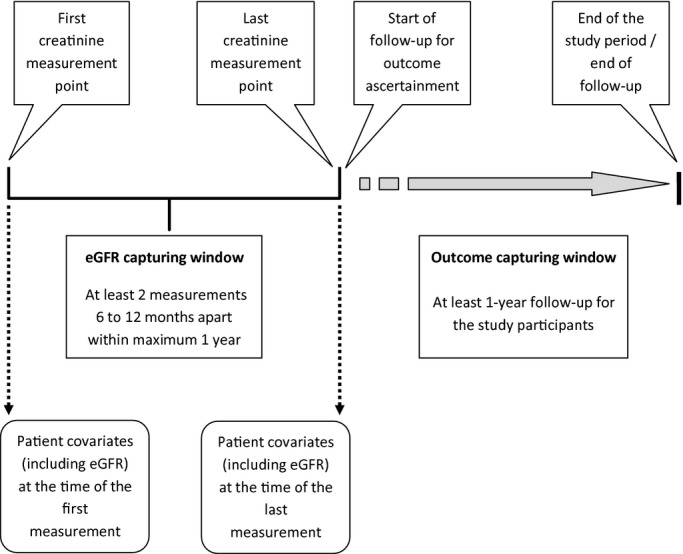
Overview of cohort creation and study period. eGFR indicates estimated glomerular filtration rate.
Figure 2.
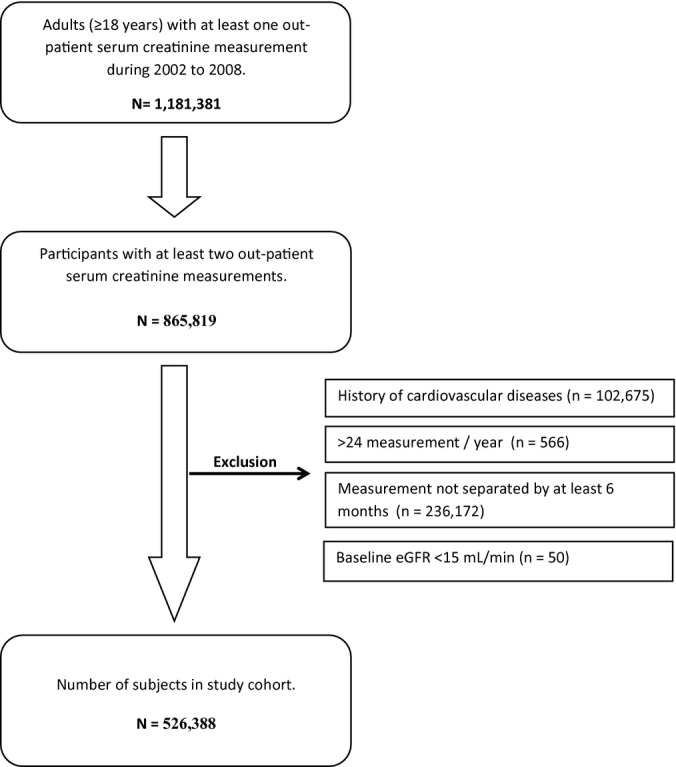
Study cohort formation. eGFR indicates estimated glomerular filtration rate.
Change in Kidney Function
The first and last outpatient creatinine measurements during the 1‐year accrual period were used to estimate GFR at the start and end of the accrual period by using the Chronic Kidney Disease Epidemiology Collaboration (CKD‐EPI) equation19 as recommended in the recent Kidney Disease Improving Global Outcomes (KDIGO) Clinical Practice Guidelines for the Evaluation and Management of Chronic Kidney.20 Although data on race were not available from the data sources, <1% of the Alberta population is black.21 eGFR was divided into the following categories: ≥90, 60 to 89, 45 to 59, 30 to 44, 15 to 29, and <15 mL/min per 1.73 m2, respectively.
Change in kidney function (based on the first and last eGFR measurements) was defined according to recent guidelines20 by change in eGFR category with confirmation of a significant change based on the magnitude of the percent change in eGFR ([last eGFR−first eGFR]/first eGFR×100). The groups for change in kidney function were thus defined as “certain drop” (drop in eGFR category with ≥25% decrease in eGFR), “uncertain drop” (drop in eGFR category with <25% decrease in eGFR), “stable” (no change in eGFR category), “uncertain rise” (rise in eGFR category with <25% rise in eGFR), and “certain rise” (rise in eGFR category with ≥25% increase in eGFR). Similar to other published studies,14,22–24 a 25% change in eGFR was used to define certainty of change, because changes of this magnitude are unlikely to represent intra‐assay25 or intraindividual variation in serum creatinine across measurements.11,26–27
Covariates
Participants’ sociodemographic characteristics were determined from the administrative data sources of the provincial health ministry (Alberta Health). Socioeconomic status was categorized as high income (annual adjusted taxable family income ≥$39 250 Canadian Dollar), low income (annual adjusted taxable family income <$39 250 Canadian Dollar), low income with subsidy (receiving social assistance), and pensioners (aged ≥65 years) based on Government of Alberta health care insurance records.28 Presence of diabetes mellitus and hypertension was identified from hospital discharge records and physician claims based on validated algorithms.29–30 Other comorbid conditions based on the Deyo classification of Charlson comorbidities were identified from the physician claims and hospitalization records by using validated International Classification of Diseases, 9th Edition, Clinical Modifications and International Classification of Diseases, 10th Edition, Clinical Modification coding algorithms.31 Albuminuria was estimated by urine albumin:creatinine ratio or urine dipstick based on outpatient random spot urine measurements. Albuminuria was categorized as normal, mild, heavy, or unmeasured based on albumin:creatinine ratio (normal [ratio <30 mg/g], mild [ratio 30–300 mg/g], or heavy [ratio >300 mg/g]) or urine dipstick ([urine dipstick negative] of mild [urine dipstick trace or 1+] or heavy [urine dipstick 2+]), as previously described.8,32
Outcome Ascertainment
Participants were followed from the date of the last creatinine measurement until study end (March 31, 2009). The outcomes were hospitalization for AMI, CHF, and stroke, identified from the Alberta Health hospitalization databases16 based on validated algorithms.33–35
Statistical Analyses
The differences in continuous and categorical variables across the 5 groups for change in kidney function were assessed by using ANOVA and χ2 tests, as appropriate. Adjusted rates (per 10 000 person‐years) for each group of change in kidney function were calculated by using Poisson regression, adjusting for covariates as in Table 1. We considered 2 perspectives regarding adjustment for the covariates (including eGFR)—adjustment for the covariates extracted at the time point of the first eGFR measurement and adjustment for the covariates extracted at the time point of the last eGFR measurement (Figure 1). Adjusted rates were estimated separately for first and last eGFR measurement perspective. Cox proportional hazards models were used to estimate the adjusted risk of each of the CV outcomes associated with each group of change in kidney function, with stable kidney function (no category change) serving as the reference. Hazard ratios were also estimated separately for the first and the last measurement perspectives. The proportional hazards assumption was tested and met. Participants were censored at study end (March 31, 2009) if they were still at risk or at an earlier date if they experienced the event of interest or left the province.
Table 1.
Baseline Characteristics of Study Participants by 1‐Year Change in Kidney Function Stage
| 1‐Year Change in Kidney Function, n (%) | P Value | |||||
|---|---|---|---|---|---|---|
| Certain Drop, 13 668 (2.6) | Uncertain Drop, 55 184 (10.5) | Stable, 400 560 (76.1) | Uncertain Rise, 39 477 (7.5) | Certain Rise, 17 499 (3.3) | ||
| Age, mean (SD), y | 58.9 (17.2) | 56.7 (14.5) | 53.0 (16.5) | 56.2 (14.2) | 56.4 (17.1) | <0.001 |
| Female gender | 65.3 | 59.2 | 59.9 | 57.4 | 65.6 | <0.001 |
| Aboriginal | 3.1 | 1.8 | 2.5 | 1.7 | 2.7 | <0.001 |
| Diabetes | 18.8 | 13.3 | 11.8 | 12.5 | 13.6 | <0.001 |
| Hypertension | 48.3 | 38.9 | 32.9 | 37.3 | 41.2 | <0.001 |
| Albuminuria | ||||||
| Normal | 46. 7 | 56.7 | 58.7 | 57.8 | 51.0 | <0.001 |
| Mild | 8.7 | 5.9 | 5.6 | 5.9 | 8.1 | |
| Heavy | 4.6 | 1.4 | 1.0 | 0.9 | 1.9 | |
| Unmeasured | 39.9 | 36.0 | 34.7 | 35.3 | 39.1 | |
| eGFR at baseline, mL/min per 1.73 m2 | ||||||
| ≥90 | 45.8 | 72.1 | 48.0 | 0 | 0 | <0.001 |
| 60 to 89 | 38.7 | 21.1 | 44.9 | 75.5 | 52.3 | |
| 45 to 59 | 10.1 | 5.6 | 5.0 | 19.3 | 30.1 | |
| 30 to 44 | 4.3 | 1.1 | 1.7 | 4.6 | 13.2 | |
| 15 to 29 | 1.2 | 0.1 | 0.5 | 0.7 | 4.0 | |
| COPD | 18.5 | 15.7 | 15.0 | 15.2 | 17.6 | <0.001 |
| Cancer | 9.7 | 6.3 | 5.5 | 5.7 | 7.6 | <0.001 |
| Peptic ulcer disease | 3.2 | 2.4 | 2.4 | 2.4 | 3.1 | <0.001 |
| Rheumatic disease | 3.3 | 2.2 | 1.9 | 2.0 | 2.6 | <0.001 |
| Socioeconomic status | ||||||
| Pensioner | 41.1 | 31.4 | 27. 2 | 28.7 | 33.8 | <0.001 |
| Low | 12.3 | 13.2 | 12.5 | 13.5 | 11.6 | |
| With subsidy | 5.2 | 3.3 | 3.7 | 3.1 | 4.8 | |
| eGFR, mean (SD), mL/min per 1.73 m2 | ||||||
| First measurement | 84.5 (23.0) | 86.9 (17.4) | 89.5 (20.5) | 77.9 (14.6) | 62.8 (16.9) | <0.001 |
| Last measurement | 55.9 (17.9) | 76.1 (15.8) | 89.5 (20.6) | 87.9 (16.1) | 87.9 (21.0) | <0.001 |
Data are in %, unless mean (SD). Totals do not always add to 100% because of rounding. The differences in continuous and categorical variables across the 5 groups for change in kidney function were assessed using ANOVA and χ2 tests, as appropriate. COPD indicates chronic obstructive pulmonary disease; eGFR, estimated glomerular filtration rate.
We performed several sensitivity analyses to confirm the robustness of our study findings. We performed separate analysis among men and women, and we repeated analyses for participants who had only 2 measurements during the 1‐year period and for the participants with >2 measurements. We also analyzed participants stratified into age <65 and ≥65 years. All of these analyses were performed by using separate models adjusting for the covariates measured at either the first and last eGFR measurement. Statistical analyses were performed by using SAS version 9.2 (SAS Institute Inc), and STATA version 12.0 (StataCorp).
Results
Participant characteristics by change in kidney function groups are shown in Table 1. Of the 526 388 eligible participants, 76.1% (n=400 560) had stable (no change in eGFR category), 2.6% (n=13 668) had a certain drop, and 3.3% (n=17 499) had a certain rise in kidney function. Participants who experienced a drop or rise in kidney function were older, more likely to be female, and had a higher prevalence of comorbidities, compared with those with stable kidney function.
There were 5268 (1.0%) hospitalizations for AMI, 3130 (0.6%) for CHF, and 4174 (0.8%) for stroke over a median follow‐up of 3.5 years. The adjusted rates of AMI, CHF, and stroke are shown in Table 2. After adjustment for the first (baseline) eGFR measurement, the highest adjusted rates were observed in individuals with a certain drop: AMI (rate 19.7 per 10 000 person‐years; 95% CI 17.1 to 22.3), CHF (rate 7.1 per 10 000 person‐years; 95% CI 6.0 to 8.2), and stroke (rate 12.8 per 10 000 person‐years; 95% CI 10.9 to 14.6). However, after multivariable adjustment at the last eGFR measurement in the 1‐year accrual period, the highest adjusted rates were observed in individuals with a certain rise for CHF (rate 5.1 per 10 000 person‐years; 95% CI 4.3 to 6.0) and stroke (rate 11.4 per 10 000 person‐years; 95% CI 9.7 to 13.1) and for uncertain rise for AMI (rate 17.3 per 10 000 person‐years; 95% CI 15.5 to 19.1).
Table 2.
Acute Myocardial Infarction, Congestive Heart Failure, and Stroke Rates, per 10 000 Person‐Years, by 1‐Year Change in Kidney Function
| 1‐Year Change in Kidney Function | |||||
|---|---|---|---|---|---|
| Certain Drop | Uncertain Drop | Stable | Uncertain Rise | Certain Rise | |
| Patients, n | 13 668 | 55 184 | 400 560 | 39 477 | 17 499 |
| Acute myocardial infarction | |||||
| Events, n (%) | 236 (1.72) | 652 (1.18) | 3774 (0.94) | 407 (1.03) | 199 (1.14) |
| Adjusted for covariates at first measurement | |||||
| Rate (95% CI) | 19.7 (17.1 to 22.3) | 18.5 (17.0 to 20.1) | 16.0 (15.3 to 16.7) | 14.2 (12.7 to 15.7) | 12.9 (11.0 to 14.9) |
| Adjusted for covariates at last measurement | |||||
| Rate (95% CI) | 15.1 (13.0 to 17.2) | 15.1 (13.8 to 16.4) | 16.0 (15.3 to 16.7) | 17.3 (15.5 to 19.1) | 16.2 (13.9 to 18.5) |
| Congestive heart failure | |||||
| Events, n (%) | 234 (1.71) | 408 (0.74) | 2083 (0.52) | 238 (0.60) | 167 (0.95) |
| Adjusted for covariates at first measurement | |||||
| Rate (95% CI) | 7.1 (6.0 to 8.2) | 5.2 (4.6 to 5.9) | 4.2 (3.8 to 4.5) | 4.1 (3.2 to 4.4) | 3.8 (3.4 to 4.8) |
| Adjusted for covariates at last measurement | |||||
| Rate (95% CI) | 5.0 (4.2 to 5.8) | 4.0 (3.5 to 4.5) | 4.1 (3.7 to 4.4) | 4.7 (3.9 to 5.3) | 5.1 (4.3 to 6.0) |
| Stroke | |||||
| Events, n (%) | 213 (1.56) | 509 (0.92) | 2943 (0.73) | 313 (0.79) | 196 (1.12) |
| Adjusted for covariates at first measurement | |||||
| Rate (95% CI) | 12.8 (10.9 to 14.6) | 11.2 (10.1 to 12.3) | 10.0 (9.5 to 10.6) | 8.9 (7.9 to 10.0) | 9.6 (8.1 to 11.2) |
| Adjusted for covariates at last measurement | |||||
| Rate (95% CI) | 10.3 (8.7 to 11.9) | 9.5 (8.6 to 10.5) | 10.1 (9.5 to 10.6) | 10.5 (9.2 to 11.7) | 11.4 (9.7 to 13.1) |
Rates are adjusted for age, sex, diabetes, hypertension, socioeconomic status, eGFR, albuminuria, and history of cancer, chronic obstructive pulmonary disease, peptic ulcer disease, and rheumatic disease at the corresponding time points. eGFR indicates estimated glomerular filtration rate.
Compared with participants with stable kidney function, hazard ratios, adjusted for covariates including eGFR at the first measurement, for AMI, CHF, and stroke were 27%, 51%, and 20% higher, respectively, for those with a certain drop in kidney function. Adjusted hazard ratios were also increased, but to a lesser extent, in participants with an uncertain drop in kidney function (Figure 3). In contrast, hazard ratios associated with a significant drop in eGFR were attenuated after adjustments by using covariates at the last eGFR measurement (Figure 4) and were no longer increased for the outcomes of myocardial infarction or stroke. However, a U‐shaped relationship was observed for the outcome of hospitalization for CHF, with both certain drop and rise being associated with statistically significant but clinically small increases (18% and 23% higher risk, respectively) in comparison to stable kidney function.
Figure 3.

Risk of acute myocardial infarction, congestive heart failure, and stroke by 1‐year change in kidney function adjusted for covariates at the first measurement. Models were adjusted for age, sex, diabetes, hypertension, socioeconomic status, estimated glomerular filtration rate (eGFR), albuminuria, and history of comorbidities at the first measurement.
Figure 4.
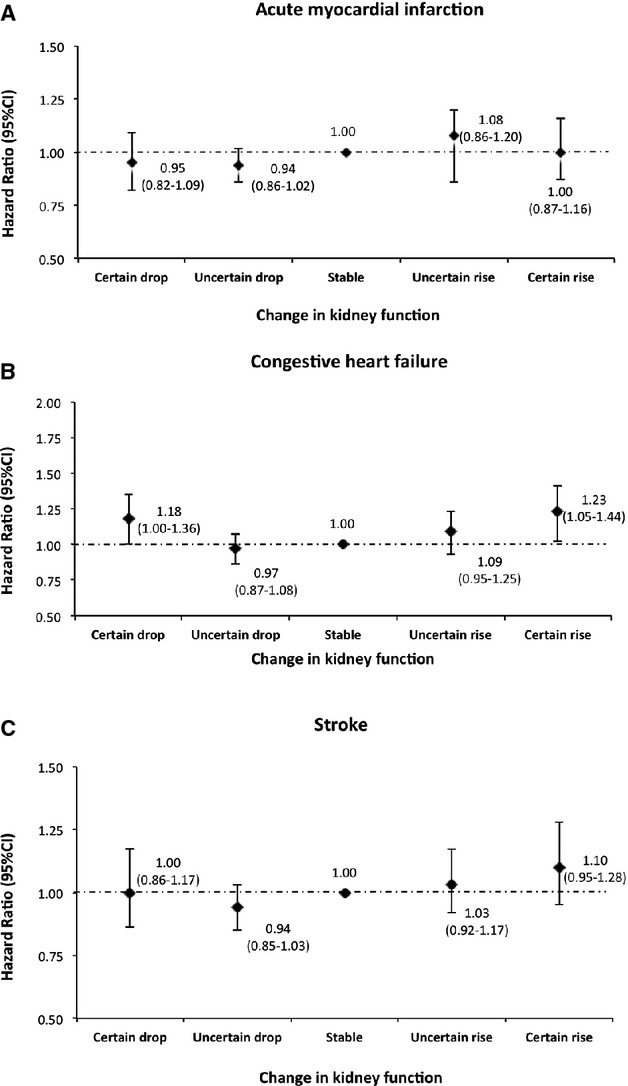
Risk of acute myocardial infarction, congestive heart failure, and stroke by 1‐year change in kidney function adjusted for covariates at the last measurement. Models were adjusted for age, sex, diabetes, hypertension, socioeconomic status, estimated glomerular filtration rate (eGFR), albuminuria, and history of comorbidities at the last measurement.
We further assessed the risk of hospitalization for AMI, CHF, and stroke associated with the last eGFR measurement specifically, including adjustment for covariates at the time of the last eGFR in the 1‐year accrual period. Relative to eGFR ≥90, the adjusted risks of AMI associated with eGFR categories of 60 to 89, 45 to 59, 30 to 44, and 15 to 29 were 1.26 (95% CI 1.16 to 1.38), 1.56 (95% CI 1.39 to 1.75), 1.83 (95% CI 1.59 to 2.10), and 2.38 (95% CI 1.97 to 2.87), respectively, demonstrating the increased risk of AMI with lower categories of kidney function based on the last eGFR measure. Similar increases in risk with lower levels of the last eGFR measurement were observed for the outcomes of CHF and stroke.
Sensitivity Analysis
In analyses stratified according to the number of available serum creatinine measurements for each participant, similar results were observed for participants with greater than the median (>2) and for those with the median or fewer (≤2) number of measurements during the accrual period (Figures 5 through 8). Similar results were observed when men and women were analyzed separately (Figures 9 through 12). We also found a similar association between change in kidney function and the risk of each of the CV outcomes in analyses stratified by age <65 and ≥65 years (Figures 13 through 16).
Figure 5.
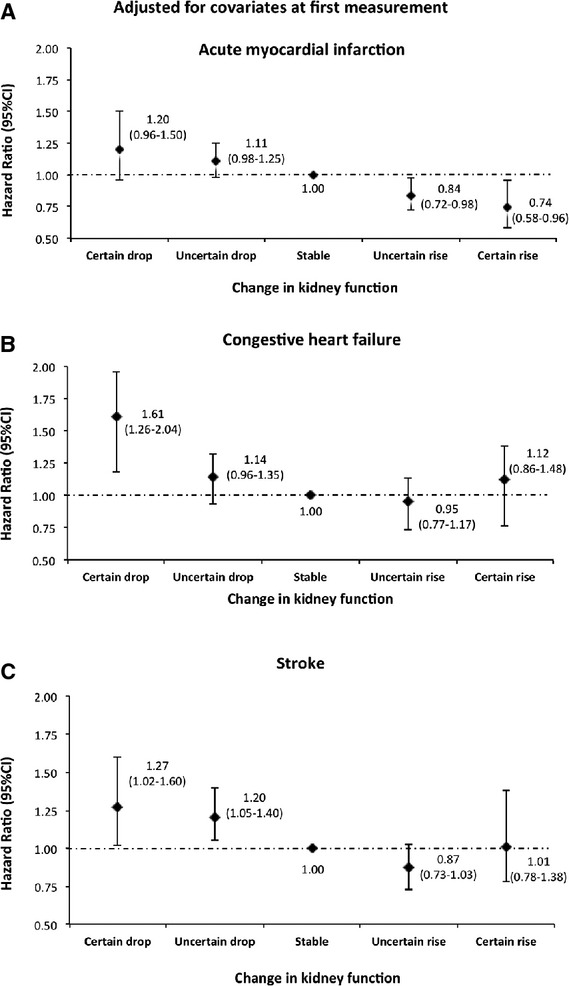
Risk of acute myocardial infarction, congestive heart failure, and stroke by 1‐year change in kidney function adjusted for covariates at the first measurement among participants with 2 measurements (median and below). Models were adjusted for age, sex, diabetes, hypertension, socioeconomic status, estimated glomerular filtration rate (eGFR), albuminuria, and history of comorbidities at the first measurement.
Figure 8.
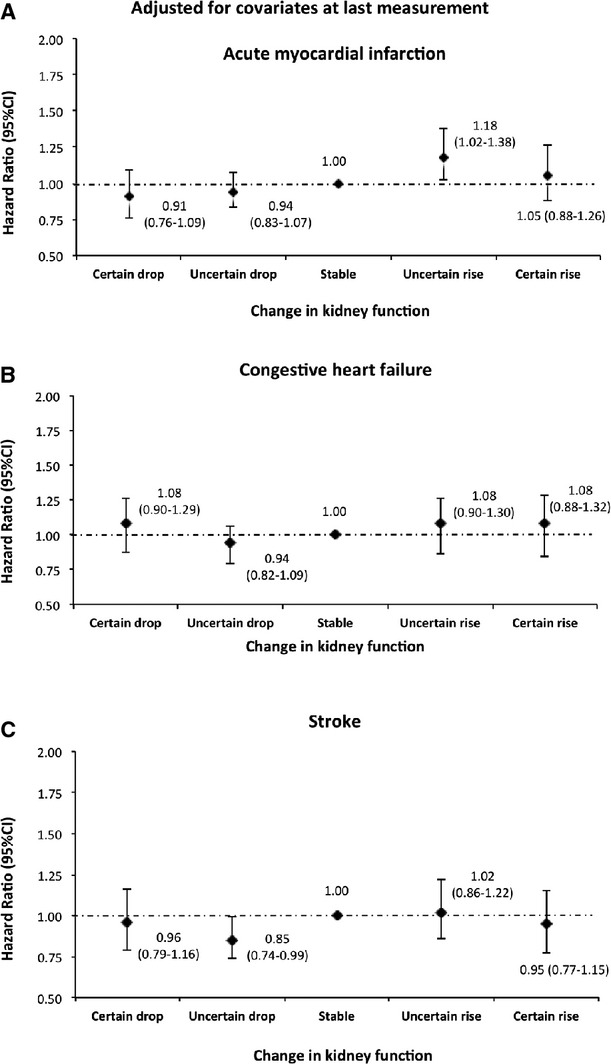
Risk of acute myocardial infarction, congestive heart failure, and stroke by 1‐year change in kidney function adjusted for covariates at the last measurement among participants with ≥3 measurements (above median). Models were adjusted for age, sex, diabetes, hypertension, socioeconomic status, estimated glomerular filtration rate (eGFR), albuminuria, and history of comorbidities at the last measurement.
Figure 9.
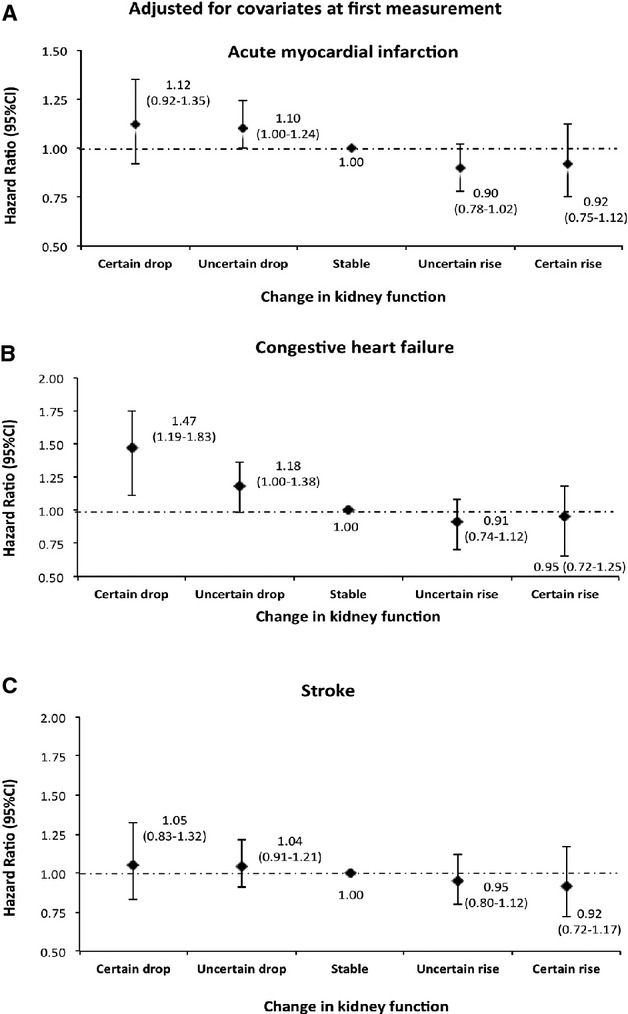
Risk of acute myocardial infarction, congestive heart failure, and stroke by 1‐year change in kidney function adjusted for covariates at the first measurement among men. Models were adjusted for age, diabetes, hypertension, socioeconomic status, estimated glomerular filtration rate (eGFR), albuminuria, and history of comorbidities at the first measurement.
Figure 12.

Risk of acute myocardial infarction, congestive heart failure, and stroke by 1‐year change in kidney function adjusted for covariates at the last measurement among women. Models were adjusted for age, diabetes, hypertension, socioeconomic status, estimated glomerular filtration rate (eGFR), albuminuria, and history of comorbidities at the last measurement.
Figure 13.
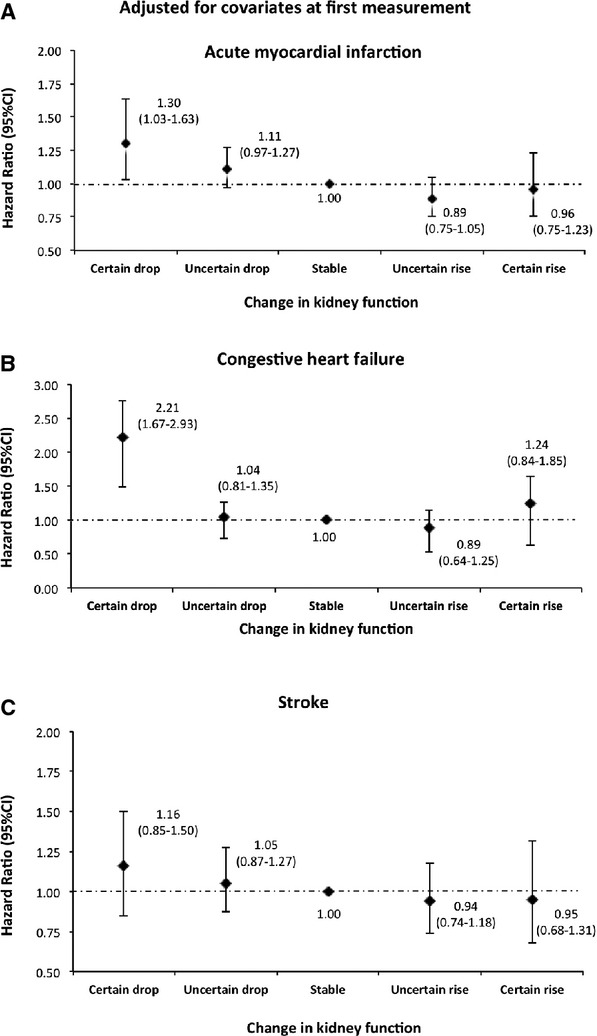
Risk of acute myocardial infarction, congestive heart failure, and stroke by 1‐year change in kidney function adjusted for covariates at the first measurement among participants <65 years. Models were adjusted for age, sex, diabetes, hypertension, socioeconomic status, estimated glomerular filtration rate (eGFR), albuminuria, and history of comorbidities at the first measurement.
Figure 16.
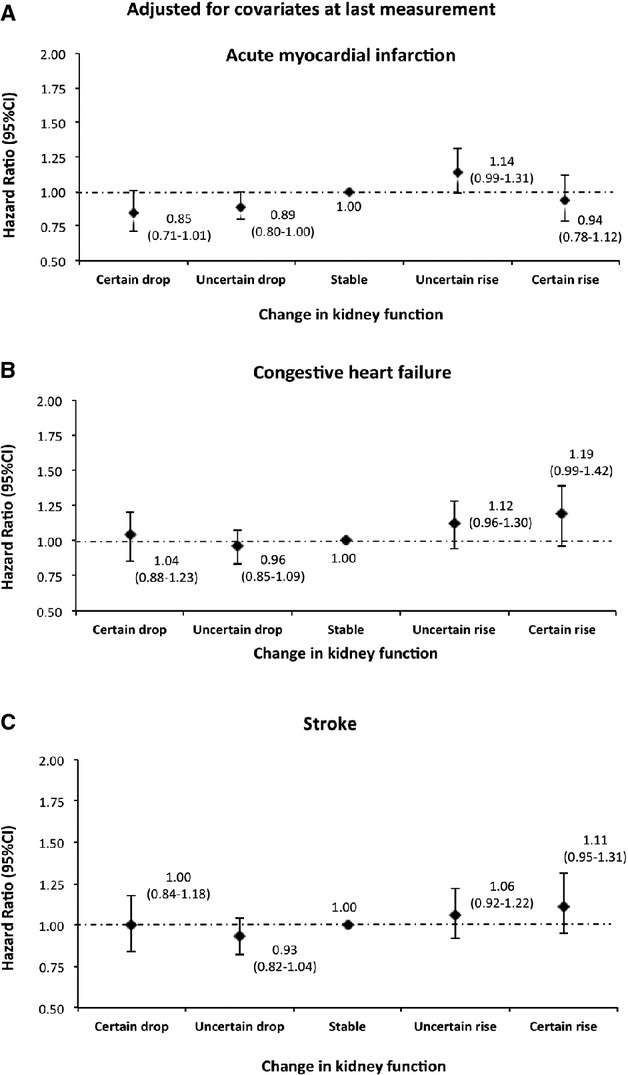
Risk of acute myocardial infarction, congestive heart failure, and stroke by 1‐year change in kidney function adjusted for covariates at the last measurement among participants aged ≥65 years. Models were adjusted for age, sex, diabetes, hypertension, socioeconomic status, estimated glomerular filtration rate (eGFR), albuminuria, and history of comorbidities at the last measurement.
Figure 6.

Risk of acute myocardial infarction, congestive heart failure, and stroke by 1‐year change in kidney function adjusted for covariates at the last measurement among participants with 2 measurements (median and below). Models were adjusted for age, sex, diabetes, hypertension, socioeconomic status, estimated glomerular filtration rate (eGFR), albuminuria, and history of comorbidities at the last measurement.
Figure 7.

Risk of acute myocardial infarction, congestive heart failure, and stroke by 1‐year change in kidney function adjusted for covariates at the first measurement among participants with ≥3 measurements (above median). Models were adjusted for age, sex, diabetes, hypertension, socioeconomic status, estimated glomerular filtration rate (eGFR), albuminuria, and history of comorbidities at the first measurement.
Figure 10.

Risk of acute myocardial infarction, congestive heart failure, and stroke by 1‐year change in kidney function adjusted for covariates at the last measurement among men. Models were adjusted for age, diabetes, hypertension, socioeconomic status, estimated glomerular filtration rate (eGFR), albuminuria, and history of comorbidities at the last measurement.
Figure 11.

Risk of acute myocardial infarction, congestive heart failure, and stroke by 1‐year change in kidney function adjusted for covariates at the first measurement among women. Models were adjusted for age, diabetes, hypertension, socioeconomic status, estimated glomerular filtration rate (eGFR), albuminuria, and history of comorbidities at the first measurement.
Figure 14.

Risk of acute myocardial infarction, congestive heart failure, and stroke by 1‐year change in kidney function adjusted for covariates at the last measurement among participants aged <65 years. Models were adjusted for age, sex, diabetes, hypertension, socioeconomic status, estimated glomerular filtration rate (eGFR), albuminuria, and history of comorbidities at the last measurement.
Figure 15.

Risk of acute myocardial infarction, congestive heart failure, and stroke by 1‐year change in kidney function adjusted for covariates at the first measurement among participants aged ≥65 years. Models were adjusted for age, sex, diabetes, hypertension, socioeconomic status, estimated glomerular filtration rate (eGFR), albuminuria, and history of comorbidities at the first measurement.
Discussion
In this large community‐based cohort, we explored the association between change in eGFR over a 1‐year period and risk of CV events, using definitions for change in kidney function based on recent international guidelines. We found that a certain drop in eGFR (change in eGFR category accompanied by a 25% decline from the baseline eGFR) was associated with an increased risk of AMI, CHF, and stroke—a risk that was independent of baseline kidney function, albuminuria, and other covariates. However, when the risk of CV events was assessed taking into account the last eGFR measurement, 1‐year changes in kidney function were no longer associated with increased risk of AMI or stroke and were only associated with a small increase in the risk of CHF. This suggests that incorporation of retrospective changes in kidney function during the preceding year does not add important prognostic information about the risk of CV events, compared with simply considering the last available measurement of eGFR and clinical features available at that time.
Our results regarding change in kidney function and risk of CV events are consistent with other reports. In a study of 4308 community dwelling older adults, rapid decline in kidney function (defined as >3 mL/min per 1.73 m2 per year) was associated with a 70% increased risk of CVD death.11 Cheng et al also reported that a decline in eGFR >20% during 18 months was associated with a >2‐fold increased risk of death from coronary heart disease (CHD) or stroke.14 Matsushita et al,9 analyzing the Atherosclerosis Risk In Communities ARIC study cohort, reported that patients with the greatest annual decline in eGFR (change of −52.67% to −5.65%) were at significantly greater risk for CHD events compared with patients with minimal annual decline (change of −0.47% to −0.33%). Using the Cardiovascular Health Study, Shlipak et al compared the associations of changes in kidney function during the first 7 years with the incidence of CVD and reported that rapid decline (defined as >3 mL/min per 1.73 m2 per year) was associated with 42% increased risk of myocardial infarction, 24% increased risk of heart failure, and 11% increased risk of stroke.15 These studies, however, did not consider the adjustment at last measurements but rather considered the issue of adjustment at the first measurement only.11,14–15
We found that the association between 1‐year decline in kidney function and risk of atherosclerotic CV events (AMI and stroke) was no longer present after adjustment for kidney function and covariates at the last measurement in the 1‐year accrual period. Further, the lower levels of kidney function itself at the last measurement showed a graded increase in risk of AMI and stroke, independent of the previous change. Similar to our results, Matsushita et al9 reported that, regarding the association between a decrease in eGFR with CHD events (defined as a definite or probable myocardial infarction, definite CHD death, or coronary revascularization procedure), past changes of eGFR (during 9 years) were less useful in estimating risk of incident CHD. The authors reported that the higher risk for incident CHD observed in those with the most rapid decline became nonsignificant after adjustment for eGFR and covariate levels at the last measurement. Similar relationships have been reported between short‐term changes in kidney function and progression to end‐stage kidney disease.22 Conversely, we found that both a certain rise and a certain drop in eGFR were associated with higher risks of hospitalization for CHF. Interestingly, this observed phenomenon was also present for the outcome of all‐cause mortality, which we have reported previously.24 We observed that, even after adjustment for covariates at the point of last eGFR measurement, the certain rise and certain drop in kidney function within 1‐year was associated with 41% and 46% increased risk of all‐cause death, respectively. A similar relationship between change in eGFR and mortality was reported in other studies.10,12 The explanation for the association between certain rise in eGFR and increased risk of CHF is not apparent, but this finding might be due to lower serum creatinine generation as a result of reduced muscle mass associated with chronic illness and frailty.13,36
Our results suggest that a simple cross‐sectional assessment at the last visit may be adequate in assessing the association between kidney function and subsequent risk of CV events. This may be attributed to the point that prognostication from retrospective assessment of change in eGFR on atherosclerotic risk, in contrast to the prospective assessment, is already captured in the patient's achieved level of kidney function. We also could not conduct rigorous analysis of the predictors of variation in eGFR in our cohort. Though the results of such an analysis would be unlikely to affect the conclusions of the current study, our findings demonstrate how models for the prediction of subsequent decline in eGFR could also be applied to estimate predicted risks of subsequent atherosclerotic events.
There are a number of strengths in our study, including the use of a large community‐dwelling population with a wide range of eGFR. We were also able to assess the effect of 1‐year change in eGFR adjusted for both baseline and last estimates of kidney function to assess the independent effect of change in kidney function after accounting for the risk conferred by absolute levels of eGFR measured at specific points in time. There are few limitations of our study that need to be mentioned. First, our study cohort was limited to patients who had outpatient serum creatinine measured as part of routine care and therefore does not include patients who did not access medical services. Further, information on the indication for serum creatinine measurement was not available. Therefore, our cohort may have resulted in preferential selection of people with comorbidity, although we were able to adjust for measured comorbidity in our analyses. Nonetheless, because, for risk prediction in clinical practice, we were interested in outcomes among people with available estimates of eGFR, this limitation does not nullify our results. Finally, although we adjusted for possible confounding factors (eg, demographic factors, measured comorbidities, kidney function, and albuminuria), we were not able to adjust for variables that may be associated with change in kidney function (eg, body mass index, blood pressure control, cause of kidney disease, and smoking status)—thus, we cannot exclude the possibility of residual confounding among estimates adjusted for covariates at the time of the initial eGFR measurement. However, given the magnitude of the attenuation of these associations after adjustment by the final eGFR, residual confounding is unlikely to alter our conclusions that the final eGFR achieved, rather than retrospective changes in eGFR over the subsequent year, carries the weight of prognostic information.
In conclusion, a drop in eGFR category confirmed by a drop from baseline of ≥25% (a certain drop) is associated with a higher risk of hospitalization for CV events. However, when taking into account the last eGFR, the previous 1‐year change in eGFR does not appear to add clinically meaningful information about the risk of future CV events.
Sources of Funding
This study is based in part by data provided by Alberta Health and Alberta Health Services. The interpretation and conclusions are those of the researchers and do not represent the views of the government of Alberta.
The sponsor had no role in the design, data collection, data analysis, interpretation, writing of the report, or decision to submit the manuscript for publication. The institutional review board of the University of Calgary approved the study and granted waiver of patient consent.
Disclosures
None.
References
- 1.Levey AS, Atkins R, Coresh J, Cohen E, Collins A, Eckardt K, Nahas M, Jaber B, Jadoul M, Levin A. Chronic kidney disease as a global public health problem: approaches and initiatives—a position statement from Kidney Disease Improving Global Outcomes. Kidney Int. 2007; 72:247-259. [DOI] [PubMed] [Google Scholar]
- 2.Drey N, Roderick P, Mullee M, Rogerson M. A population‐based study of the incidence and outcomes of diagnosed chronic kidney disease. Am J Kidney Dis. 2003; 42:677-684. [DOI] [PubMed] [Google Scholar]
- 3. K/DOQI clinical practice guidelines for chronic kidney disease: evaluation, classification, and stratification. Am J Kidney Dis. 2002; 39:S1-S266. [PubMed] [Google Scholar]
- 4.Coresh J, Selvin E, Stevens LA, Manzi J, Kusek JW, Eggers P, Van Lente F, Levey AS. Prevalence of chronic kidney disease in the United States. JAMA. 2007; 298:2038-2047. [DOI] [PubMed] [Google Scholar]
- 5.Zhang LX, Zhang PH, Wang F, Zuo L, Zhou Y, Shi Y, Li G, Jiao SF, Liu ZJ, Liang WN. Prevalence and factors associated with CKD: a population study from Beijing. Am J Kidney Dis. 2008; 51:373-384. [DOI] [PubMed] [Google Scholar]
- 6.Fried LF, Katz R, Sarnak MJ, Shlipak MG, Chaves PHM, Jenny NS, Stehman‐Breen C, Gillen D, Bleyer AJ, Hirsch C. Kidney function as a predictor of noncardiovascular mortality. J Am Soc Nephrol. 2005; 16:3728-3735. [DOI] [PubMed] [Google Scholar]
- 7.Go AS, Chertow GM, Fan D, McCulloch CE, Hsu CY. Chronic kidney disease and the risks of death, cardiovascular events, and hospitalization. N Engl J Med. 2004; 351:1296-1305. [DOI] [PubMed] [Google Scholar]
- 8.Hemmelgarn BR, Manns BJ, Lloyd A, James MT, Klarenbach S, Quinn RR, Wiebe N, Tonelli M. Relation between kidney function, proteinuria, and adverse outcomes. JAMA. 2010; 303:423-429. [DOI] [PubMed] [Google Scholar]
- 9.Matsushita K, Selvin E, Bash LD, Franceschini N, Astor BC, Coresh J. Change in estimated GFR associates with coronary heart disease and mortality. J Am Soc Nephrol. 2009; 20:2617-2624. [DOI] [PMC free article] [PubMed] [Google Scholar]
- 10.Perkins R, Bucaloiu I, Kirchner H, Ashouian N, Hartle J, Yahya T. GFR decline and mortality risk among patients with chronic kidney disease. Clin J Am Soc Nephrol. 2011; 6:1879-1886. [DOI] [PMC free article] [PubMed] [Google Scholar]
- 11.Rifkin DE, Shlipak MG, Katz R, Fried LF, Siscovick D, Chonchol M, Newman AB, Sarnak MJ. Rapid kidney function decline and mortality risk in older adults. Arch Intern Med. 2008; 168:2212-2218. [DOI] [PMC free article] [PubMed] [Google Scholar]
- 12.Turin TC, Coresh J, Tonelli M, Stevens PE, de Jong PE, Farmer CK, Matsushita K, Hemmelgarn BR. Change in the estimated glomerular filtration rate over time and risk of all‐cause mortality. Kidney Int. 2013; 83:684-691. [DOI] [PubMed] [Google Scholar]
- 13.Al‐Aly Z, Zeringue A, Fu J, Rauchman MI, McDonald JR, El‐Achkar TM, Balasubramanian S, Nurutdinova D, Xian H, Stroupe K. Rate of kidney function decline associates with mortality. J Am Soc Nephrol. 2010; 21:1961-1969. [DOI] [PMC free article] [PubMed] [Google Scholar]
- 14.Cheng TYD, Wen SF, Astor BC, Tao XG, Samet JM, Wen CP. Mortality risks for all causes and cardiovascular diseases and reduced GFR in a middle‐aged working population in Taiwan. Am J Kidney Dis. 2008; 52:1051-1060. [DOI] [PubMed] [Google Scholar]
- 15.Shlipak MG, Katz R, Kestenbaum B, Siscovick D, Fried L, Newman A, Rifkin D, Sarnak MJ. Rapid decline of kidney function increases cardiovascular risk in the elderly. J Am Soc Nephrol. 2009; 20:2625-2630. [DOI] [PMC free article] [PubMed] [Google Scholar]
- 16.Hemmelgarn BR, Clement F, Manns BJ, Klarenbach S, James MT, Ravani P, Pannu N, Ahmed SB, MacRae J, Jindal K, Quinn R, Culleton BF, Wiebe N, Krause R, Thorlacius L, Tonelli M. Overview of the Alberta Kidney Disease Network. BMC Nephrol. 2009; 10:30. [DOI] [PMC free article] [PubMed] [Google Scholar]
- 17.Turin TC, Tonelli M, Manns BJ, Ravani P, Ahmed SB, Hemmelgarn BR. Chronic kidney disease and life expectancy. Nephrol Dial Transplant. 2012; 27:3182-3186. [DOI] [PubMed] [Google Scholar]
- 18.Turin TC, Tonelli M, Manns BJ, Ahmed SB, Ravani P, James M, Hemmelgarn BR. Lifetime risk of ESRD. J Am Soc Nephrol. 2012; 23:1569-1578. [DOI] [PMC free article] [PubMed] [Google Scholar]
- 19.Levey AS, Stevens LA, Schmid CH, Zhang YL, Castro AF, Feldman HI, Kusek JW, Eggers P, Van Lente F, Greene T, Coresh J. A new equation to estimate glomerular filtration rate. Ann Intern Med. 2009; 150:604-612. [DOI] [PMC free article] [PubMed] [Google Scholar]
- 20.Kidney Disease: Improving Global Outcomes (KDIGO) CKD Work Group. KDIGO 2021 clinical practice guideline for the evaluation and management of chronic kidney disease. Kidney Int. 2012; 2013suppl 3:1-150. [Google Scholar]
- 21.Ethnocultural portrait of Canada highlight tables, 2006 census. Statistics Canada. Available at: http://www12.statcan.ca/english/census06/data/highlights/ethnic/index.cfm?Lang=E. Accessed June 15, 2010.
- 22.Turin TC, Coresh J, Tonelli M, Stevens PE, de Jong PE, Farmer CK, Matsushita K, Hemmelgarn BR. Short‐term change in kidney function and risk of end‐stage renal disease. Nephrol Dial Transplant. 2012; 27:3835-3843. [DOI] [PubMed] [Google Scholar]
- 23.Bash LD, Coresh J, Köttgen A, Parekh RS, Fulop T, Wang Y, Astor BC. Defining incident chronic kidney disease in the research setting. Am J Epidemiol. 2009; 170:414-425. [DOI] [PMC free article] [PubMed] [Google Scholar]
- 24.Turin TC, Coresh J, Tonelli M, Stevens PE, de Jong PE, Farmer CKT, Matsushita K, Hemmelgarn BR. One‐year change in kidney function is associated with an increased mortality risk. Am J Nephrol. 2012; 36:41-49. [DOI] [PubMed] [Google Scholar]
- 25.Gowans E, Fraser C. Biological variation of serum and urine creatinine and creatinine clearance: ramifications for interpretation of results and patient care. Ann Clin Biochem. 1988; 25:259-263. [DOI] [PubMed] [Google Scholar]
- 26.Hölzel WG. Intra‐individual variation of some analytes in serum of patients with chronic renal failure. Clin Chem. 1987; 33:670-673. [PubMed] [Google Scholar]
- 27.Lindeman R, Tobin J, Shock N. Longitudinal studies on the rate of decline in renal function with age. J Am Geriatr Soc. 1985; 33:278-285. [DOI] [PubMed] [Google Scholar]
- 28. Premium assistance program: premium subsidy. 2010. Available at: http://www.health.alberta.ca/AHCIP/premium-subsidy.html. Accessed October 5, 2011.
- 29.Hux JE, Ivis F, Flintoft V, Bica A. Diabetes in Ontario: determination of prevalence and incidence using a validated administrative data algorithm. Diabetes Care. 2002; 25:512-516. [DOI] [PubMed] [Google Scholar]
- 30.Quan H, Khan N, Hemmelgarn BR, Tu K, Chen G, Campbell N, Hill MD, Ghali WA, McAlister FAOutcome ftH and Surveillance Team of the Canadian Hypertension Education Programs. Validation of a case definition to define hypertension using administrative data. Hypertension. 2009; 54:1423-1428. [DOI] [PubMed] [Google Scholar]
- 31.Quan H, Sundararajan V, Halfon P, Fong A, Burnand B, Luthi J‐C, Saunders LD, Beck CA, Feasby TE, Ghali WA. Coding algorithms for defining comorbidities in ICD‐9‐CM and ICD‐10 administrative data. Med Care. 2005; 43:1130-1139. [DOI] [PubMed] [Google Scholar]
- 32.Lamb EJ, MacKenzie F, Stevens PE. How should proteinuria be detected and measured? Ann Clin Biochem. 2009; 46:205-217. [DOI] [PubMed] [Google Scholar]
- 33.Peter CA, Paul AD, Jack VT. A multicenter study of the coding accuracy of hospital discharge administrative data for patients admitted to cardiac care units in Ontario. Am Heart J. 2002; 144:290-296. [DOI] [PubMed] [Google Scholar]
- 34.Lee DS, Donovan L, Austin PC, Gong Y, Liu PP, Rouleau JL, Tu JV. Comparison of coding of heart failure and comorbidities in administrative and clinical data for use in outcomes research. Med Care. 2005; 43:182-188. [DOI] [PubMed] [Google Scholar]
- 35.Kokotailo RA, Hill MD. Coding of stroke and stroke risk factors using international classification of diseases, revisions 9 and 10. Stroke. 2005; 36:1776-1781. [DOI] [PubMed] [Google Scholar]
- 36.Kovesdy CP, George SM, Anderson JE, Kalantar‐Zadeh K. Outcome predictability of biomarkers of protein‐energy wasting and inflammation in moderate and advanced chronic kidney disease. Am J Clin Nutr. 2009; 90:407-414. [DOI] [PMC free article] [PubMed] [Google Scholar]


