

Abstract
Background
Biological markers that can be used to predict the risk of intracranial aneurysms (IAs) are not available.
Methods and Results
To clarify whether circulating microRNAs could be used as biomarkers for IA, we carried out microarray assays in a screening cohort of 40 IA patients (20 unruptured and 20 ruptured) and 20 healthy volunteers. We identified 20 microRNAs that were unanimously changed in both ruptured and unruptured patients. We confirmed 60% of these changed microRNAs by a separate microarray test with an independent validation cohort (n=143 including 93 IA patients). To identify potential biomarkers, we combined the 2 cohorts and performed quantitative real‐time polymerase chain reactions for selected target microRNAs. Logistic regression analysis demonstrated that miR‐16 and miR‐25 were independent factors for IA occurrence (P<0.001). After controlling for age, sex, smoking, and history of hypertension, the contributions of miR‐16 and miR‐25 were still highly significant (P<0.001). The adjusted odds ratio values for miR‐16 and miR‐25 were 1.52 (95% CI 1.31 to 1.77) and 1.53 (1.30 to 1.79). Combining both miR‐16 and miR‐25 in a single model did not improve the performance of risk association.
Conclusions
Our data suggest that circulating miRNAs may be novel biological markers that are useful in assessing the likelihood of IA occurrence.
Keywords: biomarker, intracranial aneurysm, logistic regression, microRNA, plasma, risk factor
Introduction
Intracranial aneurysms (IAs) affect ≈2% to 3% of the general population.1–2 Rupture of IAs causes subarachnoid hemorrhage (SAH), which is a life‐threatening clinical condition, with an acute mortality rate of around 50%.3 Diagnosis of unruptured IA relies on sophisticated angiographic imaging techniques, whereas a suitable biomarker for IA detection based on simple tests is still unavailable. Researchers have identified a number of risk factors for the development of IAs, including sex, cigarette smoking, high blood pressure, and positive family history of SAH.2,4–5 In addition, the pathogenesis of IA has a clear genetic component. In this way, researchers have found a variety of genetic variations (polymorphisms) that are associated with an increased risk of IA.6–8 However, a recent comprehensive meta‐analysis on IAs and the reported genetic traits concluded that only polymorphisms of endothelium nitric oxide synthase (eNOS) and interleukin (IL)‐6 genes showed a significant association, while many of the previous genetic association studies might be biased by the relatively small sample size.9
Potential association of IA occurrence with conventional biochemical markers has also been explored. For example, it was found that there was a significant correlation between elevated serum lipoprotein(a) levels and presence of IAs in asymptomatic patients with a positive familial history.10 Interestingly, there is evidence suggesting that certain traditional risk factors such hypercholesterolemia and diabetes mellitus may be associated with a reduced risk of IA, at least in whites.5,11–13 Despite these pilot data, however, we still do not have a specific tool that is suitable for routine screening in individuals with an elevated risk for IA development.
microRNAs (miRNAs) are short RNA molecules of 18 to 25 nucleotides in length, which are implicated in posttranscriptional regulation of gene expression.14 Currently, it is clear that miRNAs are also present in circulation (eg, in plasma or serum), and these circulating miRNAs are found to be either encapsulated in membranous microvesicles or associated with RNA‐binding proteins or lipoprotein complexes, rendering circulating miRNAs relatively resistant to enzymatic degradation.15 Genomic profiling in human plasma samples have revealed that circulating miRNA levels display unique patterns of change under different disease conditions, such as myocardial infarction, heart failure, diabetes mellitus, hypertension, and cancer, and hence can be potentially used as disease‐specific biomarkers.15–16
In our previous study, we demonstrated that a subset of inflammation‐related miRNAs were selectively upregulated in the plasma of stroke patients with intracerebral hemorrhage, and the disease condition changed both of the abundance and compartmentalization of the miRNAs in circulation.17 So far, however, there is no information about whether the occurrence of IA is associated with alterations in circulating miRNAs. In the present study, we carried out a case‐control study in an aim to identify changes in circulating miRNAs in patients with unruptured or ruptured IAs and to clarify whether circulating miRNAs could be used as novel biological markers to assess the likelihood of IA occurrence.
Materials and Methods
Patient Recruitment
This study was approved by the local human ethics committees, and informed consent were obtained from all participants or their first‐degree relatives for unconscious patients. The study was carried out in agreement with the Declaration of Helsinki. All of the IA patients were diagnosed in Tiantan Hospital (Beijing, China) between 2011 and 2013. Unruptured IAs were normally identified in outpatients presenting with symptoms such as headache and finally diagnosed with the use of digital subtraction angiography (DSA). Cases of ruptured aneurysms were from patients presented with SAH, and the final diagnosis was made by DSA examination. The location and type of IAs were determined by DSA and 3‐dimensional DSA. Healthy volunteers of either sex between ages 25 and 55 and without a family history of SAH were recruited as controls. Volunteers were not subject to angiographic examination. To exclude a possible interference caused by DSA and/or treatment, all of the samples from unruptured patients were taken before DSA, and the pharmacological or procedural treatments if applicable. Smoking history was defined as regular tobacco consumption for >1 year at the time of blood withdrawal. Criteria for positive clinical histories were hypertension, systolic blood pressure (BP) ≥140 mm Hg and/or diastolic BP ≥90 mm Hg; diabetes mellitus, fasting blood glucose ≥7.0 mmol/L; and hypercholesterolemia, total cholesterol ≥5.72 mmol/L and/or LDL‐C ≥3.64 mmol/L.
Study Design
In a primary screening cohort, we included 40 cases (20 ruptured and 20 unruptured) and 20 healthy controls and performed microarray assays. Then we recruited an independent validation cohort including 50 healthy controls and 93 IA patients (not distinguishing ruptured or unruptured). A separate microarray test was carried out with this validation cohort to strengthen our initial findings. Finally, based on the high reproducibility of certain target genes between the 2 microarray tests, we combined 2 cohorts, performed polymerase chain reactions (PCRs) for each individual sample, and conducted logistic regression analysis using the Cq values.
Sample Processing
Peripheral venous blood was collected into EDTA‐containing tubes and processed within 120 minutes. Blood samples were processed as described previously.17 Whole blood was first centrifuged at 1600g for 10 minutes, and then the supernatant was transferred into a fresh tube and centrifuged again at 13 000g for 10 minutes. The clear plasma was aliquoted and stored at −80°C until use. All procedures were carried out on ice.
miRNA Microarray Experiments
For the screening cohort, we randomly selected 5 samples from each category and combined them in a sample pool. In this way, we obtained 12 sample pools in total, and 1 pool was used for a single microarray. Because there are concerns about the lacking of good housekeeping RNAs in plasma for data normalization, we adopted the method that we used previously in plasma miRNA profiling experiments.17 Specifically, we isolated total RNA from the same volume of plasma and resuspended the RNA in a fixed volume of buffer for each sample. Instead of using the same mass of total RNA for each microarray, we withdrew a fixed volume from each RNA sample that was appropriate for array hybridization. Total RNA was extracted and purified using the mirVana miRNA Isolation Kit (Ambion) and following the manufacturer's instructions. RNA samples were labeled with Cy3 using the miRNA Complete Labeling and Hyb Kit (Agilent Technologies). Agilent Human miRNA Microarray Release 14.0, 8×15K array slides were used, and slides were hybridized with labeled RNA sample in hybridization oven at 55°C for 20 hours. After hybridization, slides were washed with Gene Expression Wash Buffer (Agilent) and then scanned with the Agilent Microarray Scanner (G2565BA) equipped with Feature Extraction software 10.7 by using default settings. Microarray processing was performed at ShanghaiBio Corporation (Shanghai, China). For the validation cohort, samples were randomly divided into 4 control and 4 IA pools. We used a different array platform (Human miRNA 8*60K V19.0) from the same supplier because the older product was discontinued by the supplier.
Quantitative Real‐Time PCR (qPCR)
Plasma of 300 μL was mixed with 900 μL of TRIzol LS Reagent (Invitrogen) and an exogenous spike‐in RNA (5×10⁸ copies of C. elegans (miRNA cel‐miR‐39‐3p, synthesized by TaKaRa, Dalian, China) was added to serve as an internal control. Total RNA was isolated according to the manufacturer's instruction. Reverse transcription was performed using 80 ng of total RNA (dissolved in 4 μL of water) with the Universal cDNA Synthesis Master Mix kit (Exiqon). Real‐time qPCR was performed using microRNA LNA PCR primer sets and the SYBR Green Master Mix (all from Exiqon). For cel‐miR‐39‐3p, the UniRT LNA control primer set (Exiqon) was used. The ▵Cq value was calculated by subtracting the Cq value of the spike‐in miRNA from that of the target miRNA. Investigators performing the PCR were blinded to the grouping of samples.
Data Treatment and Statistical Analysis
The raw microarray data were processed and analyzed with Agilent GeneSpring GX software using Benjamini and Hochberg False Discovery Rate multiple testing correction. Changes with an adjusted P<0.05 and a fold change >1.5 were considered as significant. Other quantitative data were expressed as mean±SD. Differences between group means were analyzed with either 1‐way ANOVA followed by Tukey's test (for multiple groups) or Mann–Whitney test (for 2 groups), using GraphPad Prism. Logistic regression models and receiver operating characteristic (ROC) curves were constructed using SPSS. The calculated odds ratio (OR) was presented with the 95% CI. A value of P<0.05 was regarded as statistically significant. To determine the adequate sample size for logistic regression, we used a cases:variables ratio of 20. Therefore, for a model containing 6 variables, the sample size is to be >120.
Results
Clinical Characteristics of the Patients and Associated IAs
All patients involved in the microarray study were free of other critical illness such as cancer or organ failure. Two ruptured patients had inactive rheumatoid arthritis and were receiving no current medication. One unruptured patient had type 2 diabetes and was on a treatment with calcium channel blocker and insulin. All other subjects were free of medication. General clinical parameters of the IA patients and controls were shown in Table 1. The mean age of unruptured patients was significantly older than that of controls. Both systolic and diastolic BPs measured on site were not significantly different between groups. Of the 40 patients, 33 harbored a single IA, 4 harbored double IAs, 2 harbored triple IAs, and 1 had multiple IAs. The characteristics of the diagnosed IAs were summarized in Table 2.
Table 1.
Clinical Parameters of Control Subjects and IA Patients Included in the Primary Microarray Screening
| Control (n=20) | Unruptured (n=20) | Ruptured (n=20) | |
|---|---|---|---|
| Age, y | 40.4±10.8 | 52.2±7.9* | 47.1±11.5 |
| Sex (% male) | 55.0 | 60.0 | 45.0 |
| SBP, mm Hg | 116±7 | 125±17 | 128±23 |
| DBP, mm Hg | 77±7 | 79±10 | 82±13 |
| History of hypertension, % | 0 | 30.0 | 5.0 |
| Current smoking, % | 10.0 | 30.0 | 20.0 |
| Diabetes, % | 0 | 5.0 | 0 |
| Hypercholesterolemia, % | 0 | 0 | 0 |
| Current medication, % | 0 | 5.0 | 0 |
Data are mean±SD. ANOVA indicates analysis of variance; DBP, diastolic blood pressure measured on site; SBP, systolic blood pressure measured on site.
P<0.01 vs control, 1‐way ANOVA.
Table 2.
Number of Aneurysms Present in Patients Involved in the Microarray Study According to Their Location and Type
| Unruptured (n=25) | Ruptured (n=22) | |
|---|---|---|
| Location | ||
| Anterior communicating artery | 2 | 6 |
| Posterior communicating artery | 6 | 8 |
| Anterior cerebral artery | 1 | 0 |
| Middle cerebral artery | 2 | 1 |
| Posterior cerebral artery | 1 | 1 |
| Basilar artery | 2 | 0 |
| Vertebral artery | 2 | 0 |
| Internal carotid artery | 9 | 5 |
| Anterior inferior cerebellar artery | 0 | 1 |
| Type | ||
| Saccular | 23 | 21 |
| Irregular | 1 | 1 |
| Dissecting | 1 | 0 |
Changes in Plasma miRNA Levels
A total of 233 miRNAs were detectable in the plasma at least in 1 of the 12 sample pools with the microarray technique. The raw data of microarray experiments were deposited in the Gene Expression Omnibus database (GEO, Series Record GSE50867). Scatter plot analysis of the mean signal intensities showed that a number of the miRNAs were differentially represented between controls and IA patients, whereas data between the 2 patient groups showed a high level of uniformity (Figure 1A). These indicated that some miRNAs were differentially expressed in plasma between controls and patients. Consistently, principal component analysis also showed the distinct trends of data between controls and patient groups (Figure 1B). controls, 119 miRNAs were significantly changed in unruptured patients, and 23 were changed in ruptured patients (Table 3). Among these miRNAs, 20 were unanimously changed in both ruptured and unruptured patients (Figure 1C and Table 4). To avoid any statistical bias introduced by repeated t test, we confirmed the significance of change of these 20 miRNAs with 1‐way ANOVA (all P<0.05).
Figure 1.
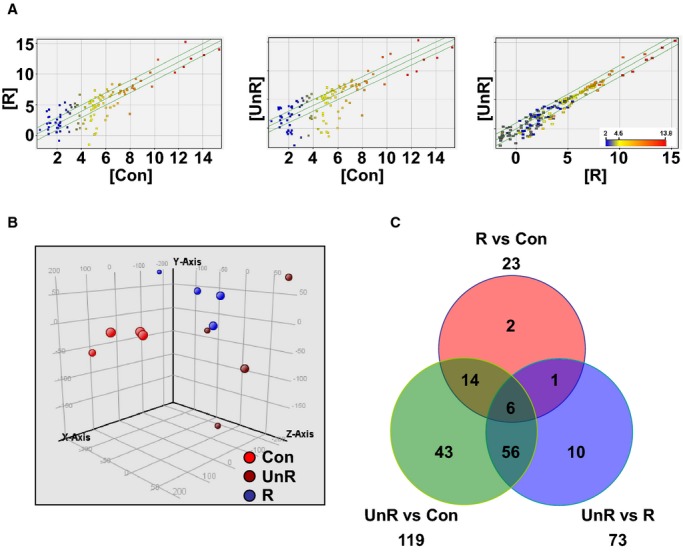
Microarray analysis of plasma miRNA profiles in patients with unruptured (UnR) or ruptured (R) intracranial aneurysms, and healthy controls (Con). A, Scatter plot of the mean signal intensities of detected plasma miRNAs compared between groups (each point represented a single miRNA). B, Principal component analysis of the trend of global miRNA expression profiles for all samples (each point represented an individual array). C, Venn diagram showing the number of differentially expressed (adjusted P<0.05 and fold change >1.5) plasma miRNAs as compared between groups.
Table 3.
Plasma microRNAs Significantly Changed in Patients With Unruptured or Ruptured IAs as Identified With Microarray Analysis
| Systematic Name | Corrected P Value | Fold Change | Regulation |
|---|---|---|---|
| Unruptured vs control | |||
| hsa‐miR‐939 | 0.011 | 14.1 | Up |
| hsa‐miR‐1207‐5p | 0.006 | 10.0 | Up |
| hsa‐miR‐126 | 0.025 | 14.0 | Up |
| hsa‐miR‐1825 | 0.004 | 6.2 | Down |
| hsa‐miR‐130b | 0.005 | 11.9 | Up |
| hsa‐miR‐17 | 0.005 | 22.7 | Up |
| hsa‐miR‐574‐3p | 0.049 | 2.6 | Up |
| hsa‐miR‐22 | 0.003 | 8.3 | Up |
| hsa‐let‐7a | 0.004 | 21.9 | Up |
| hsa‐miR‐30b | 0.010 | 8.4 | Up |
| hsa‐miR‐1275 | 0.005 | 10.2 | Up |
| hsa‐miR‐130a | 0.011 | 7.6 | Up |
| hsa‐miR‐762 | 0.006 | 11.8 | Up |
| hsa‐miR‐371‐5p | 0.043 | 3.7 | Up |
| hsa‐miR‐187* | 0.004 | 11.4 | Up |
| hsa‐miR‐16‐2* | 0.004 | 9.9 | Up |
| hsa‐miR‐101 | 0.011 | 18.1 | Up |
| hsa‐miR‐30e | 0.005 | 8.8 | Up |
| hsa‐miR‐150 | 0.012 | 5.9 | Up |
| hsa‐miR‐144 | 0.018 | 10.3 | Up |
| hsa‐miR‐638 | 0.010 | 9.8 | Up |
| hsa‐miR‐324‐3p | 0.004 | 16.9 | Up |
| hsa‐miR‐1249 | 0.004 | 7.3 | Up |
| hsa‐miR‐30d | 0.006 | 8.5 | Up |
| hsa‐miR‐215 | 0.002 | 11.4 | Up |
| hsa‐miR‐185 | 0.005 | 19.5 | Up |
| hsa‐miR‐20b | 0.010 | 27.1 | Up |
| hsa‐miR‐557 | 0.008 | 8.1 | Up |
| hsa‐miR‐342‐3p | 0.005 | 6.0 | Up |
| hsa‐miR‐1183 | 0.002 | 52.7 | Up |
| hsa‐miR‐328 | 0.049 | 2.3 | Up |
| hsa‐miR‐19a | 0.005 | 13.0 | Up |
| hsa‐miR‐1181 | 0.006 | 8.4 | Up |
| hsa‐miR‐652 | 0.049 | 4.6 | Up |
| hsa‐let‐7f | 0.008 | 12.1 | Up |
| hsa‐miR‐320a | 0.005 | 19.3 | Up |
| hsa‐miR‐425* | 0.006 | 4.0 | Down |
| hsa‐miR‐331‐3p | 0.049 | 3.0 | Up |
| hsa‐miR‐15b | 0.009 | 19.8 | Up |
| hsa‐miR‐451 | 0.006 | 15.5 | Up |
| hsa‐miR‐148a | 0.005 | 8.1 | Up |
| hsa‐miR‐1202 | 0.008 | 8.2 | Up |
| hsa‐miR‐532‐5p | 0.004 | 7.6 | Up |
| hsa‐miR‐1915 | 0.015 | 6.3 | Up |
| hsa‐miR‐423‐5p | 0.005 | 14.5 | Up |
| hsa‐miR‐718 | 0.005 | 11.1 | Up |
| hsa‐let‐7d | 0.004 | 21.7 | Up |
| hsa‐miR‐1471 | 0.005 | 16.9 | Up |
| hsa‐miR‐26a | 0.022 | 8.4 | Up |
| hsa‐miR‐1308_v15.0 | 0.005 | 10.3 | Up |
| hsa‐miR‐18a | 0.001 | 18.7 | Up |
| hsa‐miR‐29c | 0.027 | 10.7 | Up |
| hsa‐miR‐424 | 0.048 | 2.7 | Up |
| hsa‐miR‐144* | 0.049 | 2.9 | Up |
| hsa‐miR‐183 | 0.003 | 16.0 | Up |
| hsa‐let‐7i | 0.006 | 24.8 | Up |
| hsa‐miR‐142‐5p | 0.005 | 9.7 | Up |
| hsa‐miR‐484 | 0.004 | 18.9 | Up |
| hsa‐miR‐483‐5p | 0.013 | 4.4 | Up |
| hsa‐miR‐1234 | 0.011 | 1.9 | Down |
| hsa‐miR‐140‐3p | 0.005 | 8.9 | Up |
| hsa‐miR‐151‐5p | 0.010 | 8.0 | Up |
| hsa‐miR‐107 | 0.005 | 16.4 | Up |
| hsa‐miR‐320b | 0.005 | 14.4 | Up |
| hsa‐miR‐140‐5p | 0.005 | 8.3 | Up |
| hsa‐let‐7g | 0.006 | 35.1 | Up |
| hsa‐miR‐197 | 0.015 | 3.4 | Up |
| hsa‐miR‐1226* | 0.004 | 11.5 | Up |
| hsa‐let‐7b | 0.015 | 40.8 | Up |
| hsa‐miR‐15a | 0.006 | 13.0 | Up |
| hsa‐let‐7d* | 0.004 | 10.0 | Up |
| hsa‐miR‐19b | 0.004 | 14.2 | Up |
| hsa‐miR‐301a | 0.003 | 10.2 | Up |
| hsa‐miR‐134 | 0.005 | 14.8 | Up |
| hsa‐miR‐21 | 0.007 | 9.2 | Up |
| hsa‐miR‐106b | 0.005 | 13.3 | Up |
| hsa‐miR‐486‐3p | 0.004 | 7.3 | Up |
| hsa‐miR‐29b | 0.002 | 7.4 | Up |
| hsa‐miR‐139‐3p | 0.011 | 5.2 | Up |
| hsa‐miR‐320c | 0.005 | 11.2 | Up |
| hsa‐miR‐186 | 0.004 | 12.0 | Up |
| hsa‐miR‐765 | 0.010 | 4.6 | Up |
| hsa‐miR‐93 | 0.005 | 18.2 | Up |
| hsa‐miR‐96 | 0.003 | 12.8 | Up |
| hsa‐miR‐572 | 0.019 | 12.2 | Up |
| hsa‐miR‐1281 | 0.006 | 4.4 | Down |
| hsa‐miR‐135a* | 0.006 | 15.6 | Up |
| hsa‐miR‐210 | 0.015 | 4.2 | Up |
| hsa‐miR‐26b | 0.011 | 50.2 | Up |
| hsa‐miR‐575 | 0.005 | 19.9 | Up |
| hsa‐miR‐630 | 0.005 | 15.0 | Up |
| hsa‐miR‐1280 | 0.004 | 5.8 | Down |
| hsa‐miR‐18b | 0.003 | 10.0 | Up |
| hsa‐miR‐103 | 0.005 | 31.5 | Up |
| hsa‐miR‐16 | 0.005 | 25.0 | Up |
| hsa‐miR‐196a | 0.049 | 4.4 | Up |
| hsa‐miR‐601 | 0.011 | 9.4 | Up |
| hsa‐miR‐363 | 0.006 | 21.9 | Up |
| hsa‐miR‐148b | 0.002 | 7.8 | Up |
| hsa‐miR‐192 | 0.005 | 19.0 | Up |
| hsa‐miR‐7 | 0.003 | 16.8 | Up |
| hsa‐miR‐660 | 0.003 | 20.3 | Up |
| hsa‐miR‐92a | 0.004 | 19.1 | Up |
| hsa‐miR‐2276 | 0.002 | 14.7 | Up |
| hsa‐miR‐195 | 0.005 | 7.5 | Up |
| hsa‐miR‐1975_v15.0 | 0.041 | 3.6 | Up |
| hsa‐miR‐25 | 0.005 | 27.5 | Up |
| hsa‐miR‐590‐5p | 0.001 | 13.0 | Up |
| hsa‐miR‐1225‐5p | 0.006 | 7.0 | Up |
| hsa‐miR‐1268 | 0.011 | 7.2 | Up |
| hsa‐miR‐20a | 0.005 | 23.1 | Up |
| hsa‐let‐7c | 0.005 | 23.0 | Up |
| hsa‐miR‐188‐5p | 0.002 | 24.3 | Up |
| hsa‐miR‐151‐3p | 0.049 | 5.2 | Up |
| hsa‐miR‐1914* | 0.002 | 24.1 | Up |
| hsa‐miR‐425 | 0.005 | 30.8 | Up |
| hsa‐miR‐486‐5p | 0.004 | 25.0 | Up |
| hsa‐miR‐128 | 0.049 | 2.9 | Up |
| hsa‐miR‐320d | 0.005 | 13.8 | Up |
| Ruptured vs control | |||
| hsa‐miR‐1825 | 0.002 | 7.6 | Down |
| hsa‐let‐7a | 0.037 | 18.4 | Up |
| hsa‐miR‐1183 | 0.043 | 12.5 | Up |
| hsa‐let‐7f | 0.049 | 11.5 | Up |
| hsa‐miR‐425* | 0.040 | 4.0 | Down |
| hsa‐let‐7d | 0.040 | 11.4 | Up |
| hsa‐miR‐18a | 0.043 | 5.1 | Up |
| hsa‐miR‐1234 | 0.025 | 2.1 | Down |
| hsa‐miR‐720 | 0.043 | 5.1 | Down |
| hsa‐let‐7g | 0.043 | 22.0 | Up |
| hsa‐miR‐486‐3p | 0.042 | 5.0 | Up |
| hsa‐miR‐1238 | 0.040 | 4.9 | Down |
| hsa‐miR‐1281 | 0.013 | 7.5 | Down |
| hsa‐miR‐1280 | 0.024 | 5.6 | Down |
| hsa‐miR‐16 | 0.043 | 10.5 | Up |
| hsa‐miR‐191* | 0.024 | 4.2 | Down |
| hsa‐miR‐7 | 0.018 | 5.8 | Up |
| hsa‐miR‐660 | 0.037 | 6.4 | Up |
| hsa‐miR‐25 | 0.049 | 9.5 | Up |
| hsa‐miR‐590‐5p | 0.013 | 4.0 | Up |
| hsa‐let‐7c | 0.049 | 14.6 | Up |
| hsa‐miR‐188‐5p | 0.018 | 9.1 | Up |
| hsa‐miR‐486‐5p | 0.040 | 6.9 | Up |
Table 4.
Plasma microRNAs Significantly Altered in Both Ruptured and Unruptured IA Patients as Determined With Microarray
| Unruptured | Ruptured | |||||
|---|---|---|---|---|---|---|
| Regulation | Fold Change | P Value | Regulation | Fold Change | P Value | |
| let‐7a | Up | 18.4 | 0.037 | Up | 21.9 | 0.004 |
| let‐7c | Up | 14.6 | 0.049 | Up | 23.0 | 0.005 |
| let‐7d* | Up | 11.4 | 0.040 | Up | 21.7 | 0.004 |
| let‐7f* | Up | 11.5 | 0.049 | Up | 12.1 | 0.008 |
| let‐7 g | Up | 22.0 | 0.043 | Up | 35.1 | 0.006 |
| miR‐1183 | Up | 12.5 | 0.043 | Up | 52.7 | 0.002 |
| miR‐1234* | Down | 2.1 | 0.025 | Down | 1.9 | 0.011 |
| miR‐1280 | Down | 5.6 | 0.024 | Down | 5.8 | 0.004 |
| miR‐1281* | Down | 7.5 | 0.013 | Down | 4.4 | 0.006 |
| miR‐16* | Up | 10.5 | 0.043 | Up | 25.0 | 0.005 |
| miR‐1825* | Down | 7.6 | 0.002 | Down | 6.2 | 0.004 |
| miR‐188‐5p* | Up | 9.1 | 0.018 | Up | 24.3 | 0.002 |
| miR‐18a* | Up | 5.1 | 0.043 | Up | 18.7 | 0.001 |
| miR‐25* | Up | 9.5 | 0.049 | Up | 27.5 | 0.005 |
| miR‐425* | Down | 4.0 | 0.040 | Down | 4.0 | 0.006 |
| miR‐486‐3p* | Up | 5.0 | 0.042 | Up | 7.3 | 0.004 |
| miR‐486‐5p* | Up | 6.9 | 0.040 | Up | 25.0 | 0.004 |
| miR‐590‐5p | Up | 4.0 | 0.013 | Up | 13.0 | 0.001 |
| miR‐660* | Up | 6.4 | 0.037 | Up | 20.3 | 0.003 |
| miR‐7 | Up | 5.8 | 0.018 | Up | 16.8 | 0.003 |
Adjusted P values with Benjamini and Hochberg False Discovery Rate multiple testing correction were shown. IA indicates intracranial aneurysm.
These miRNAs were validated by the secondary microarray test with the expanded cohort.
Microarray Validation
To verify the robustness of our initial data, we carried out a separate microarray test with the validation cohort (see Table 5) and identified 99 miRNAs that were specifically changed in IA patients (69 upregulated and 30 downregulated) (Table 6). Importantly, we demonstrated that 60% of the miRNAs identified in the initial screening cohort, including miR‐16 and miR‐25, were also reconfirmed with the validation test (see Table 4).
Table 5.
Clinical Information of Subjects Included in the Validation Cohort
| Control (n=50) | IA (n=93) | P Value | |
|---|---|---|---|
| Age, y | 43.7±10.4 | 51.8±10.8 | <0.001 |
| Sex (% male) | 72.0 | 46.2 | <0.005 |
| History of hypertension, % | 18.0 | 41.9 | <0.005 |
| Current smoking, % | 34.0 | 26.9 | 0.373 |
| Diabetes, % | 0 | 9.7 | <0.05 |
| Hypercholesterolemia, % | 0 | 6.5 | 0.066 |
| Current medication, % | 10.0 | 14.0 | 0.494 |
Data for age were expressed as mean±SD. The mean ages were analyzed with unpaired t test; other parameters were analyzed with χ2 test. IA indicates intracranial aneurysms.
Table 6.
Significantly Changed Plasma microRNAs in IA Patients Compared With Healthy Controls From the Expanded Cohort
| Systematic Name | P Values | Fold Change | Systematic Name | P Values | Fold Change |
|---|---|---|---|---|---|
| hsa‐let‐7d‐3p | 0.0051 | 30.63 | hsa‐miR‐1225‐3p | 0.0005 | 0.09 |
| hsa‐let‐7d‐5p | 0.0138 | 27.92 | hsa‐miR‐1228‐3p | 0.0118 | 0.11 |
| hsa‐let‐7f‐5p | 0.0164 | 14.54 | hsa‐miR‐1234‐3p | 0.0112 | 0.12 |
| hsa‐miR‐1181 | 0.0000 | 7.22 | hsa‐miR‐1238‐3p | 0.0147 | 0.13 |
| hsa‐miR‐1227‐5p | 0.0002 | 6.13 | hsa‐miR‐1246 | 0.0010 | 0.24 |
| hsa‐miR‐130b‐3p | 0.0005 | 7.64 | hsa‐miR‐1260a | 0.0018 | 0.05 |
| hsa‐miR‐134 | 0.0105 | 21.86 | hsa‐miR‐1273 g‐3p | 0.0135 | 0.13 |
| hsa‐miR‐135a‐3p | 0.0036 | 26.65 | hsa‐miR‐1281 | 0.0036 | 0.06 |
| hsa‐miR‐142‐5p | 0.0032 | 8.73 | hsa‐miR‐1290 | 0.0009 | 0.06 |
| hsa‐miR‐146a‐5p | 0.0247 | 3.60 | hsa‐miR‐1304‐3p | 0.0174 | 0.14 |
| hsa‐miR‐1471 | 0.0001 | 31.02 | hsa‐miR‐1825 | 0.0057 | 0.05 |
| hsa‐miR‐148a‐3p | 0.0046 | 17.25 | hsa‐miR‐191‐3p | 0.0018 | 0.08 |
| hsa‐miR‐148b‐3p | 0.0000 | 6.19 | hsa‐miR‐29a‐3p | 0.0271 | 0.23 |
| hsa‐miR‐151b | 0.0049 | 27.63 | hsa‐miR‐3162‐3p | 0.0060 | 0.09 |
| hsa‐miR‐1587 | 0.0000 | 6.25 | hsa‐miR‐3180‐5p | 0.0027 | 0.07 |
| hsa‐miR‐16‐5p | 0.0473 | 2.45 | hsa‐miR‐3663‐3p | 0.0018 | 0.46 |
| hsa‐miR‐186‐5p | 0.0044 | 16.19 | hsa‐miR‐4284 | 0.0042 | 0.05 |
| hsa‐miR‐187‐5p | 0.0000 | 5.71 | hsa‐miR‐4313 | 0.0031 | 0.05 |
| hsa‐miR‐188‐5p | 0.0120 | 13.22 | hsa‐miR‐4433‐5p | 0.0088 | 0.13 |
| hsa‐miR‐18a‐5p | 0.0126 | 13.19 | hsa‐miR‐4454 | 0.0070 | 0.13 |
| hsa‐miR‐18b‐5p | 0.0001 | 5.70 | hsa‐miR‐4644 | 0.0475 | 0.31 |
| hsa‐miR‐192‐5p | 0.0054 | 31.36 | hsa‐miR‐4649‐3p | 0.0006 | 0.06 |
| hsa‐miR‐195‐5p | 0.0000 | 5.15 | hsa‐miR‐4665‐3p | 0.0142 | 0.14 |
| hsa‐miR‐197‐3p | 0.0000 | 5.74 | hsa‐miR‐5100 | 0.0049 | 0.18 |
| hsa‐miR‐2276 | 0.0000 | 5.99 | hsa‐miR‐6069 | 0.0119 | 0.12 |
| hsa‐miR‐2392 | 0.0306 | 7.61 | hsa‐miR‐6127 | 0.0414 | 0.40 |
| hsa‐miR‐25‐3p | 0.0331 | 2.39 | hsa‐miR‐6508‐5p | 0.0052 | 0.08 |
| hsa‐miR‐29b‐3p | 0.0013 | 4.15 | hsa‐miR‐6515‐3p | 0.0030 | 0.10 |
| hsa‐miR‐301a‐3p | 0.0001 | 5.73 | hsa‐miR‐933 | 0.0012 | 0.13 |
| hsa‐miR‐3138 | 0.0118 | 21.79 | hsa‐miR‐940 | 0.0047 | 0.30 |
| hsa‐miR‐3141 | 0.0000 | 48.74 | |||
| hsa‐miR‐3188 | 0.0002 | 6.46 | |||
| hsa‐miR‐3196 | 0.0272 | 8.68 | |||
| hsa‐miR‐324‐3p | 0.0079 | 14.98 | |||
| hsa‐miR‐342‐3p | 0.0013 | 4.60 | |||
| hsa‐miR‐345‐3p | 0.0002 | 6.30 | |||
| hsa‐miR‐3610 | 0.0021 | 8.42 | |||
| hsa‐miR‐3667‐5p | 0.0035 | 25.17 | |||
| hsa‐miR‐371b‐5p | 0.0439 | 6.72 | |||
| hsa‐miR‐423‐5p | 0.0314 | 7.10 | |||
| hsa‐miR‐4271 | 0.0000 | 6.09 | |||
| hsa‐miR‐4433‐3p | 0.0000 | 64.74 | |||
| hsa‐miR‐4463 | 0.0000 | 52.28 | |||
| hsa‐miR‐4499 | 0.0043 | 30.73 | |||
| hsa‐miR‐4505 | 0.0252 | 2.36 | |||
| hsa‐miR‐4507 | 0.0028 | 16.13 | |||
| hsa‐miR‐451a | 0.0058 | 5.41 | |||
| hsa‐miR‐4632‐5p | 0.0032 | 18.14 | |||
| hsa‐miR‐4655‐3p | 0.0004 | 29.24 | |||
| hsa‐miR‐4728‐5p | 0.0229 | 3.74 | |||
| hsa‐miR‐4739 | 0.0000 | 58.09 | |||
| hsa‐miR‐4787‐3p | 0.0001 | 5.36 | |||
| hsa‐miR‐4800‐5p | 0.0017 | 9.14 | |||
| hsa‐miR‐484 | 0.0020 | 48.10 | |||
| hsa‐miR‐486‐3p | 0.0000 | 4.91 | |||
| hsa‐miR‐486‐5p | 0.0085 | 4.25 | |||
| hsa‐miR‐5001‐5p | 0.0101 | 12.17 | |||
| hsa‐miR‐6068 | 0.0175 | 10.11 | |||
| hsa‐miR‐6126 | 0.0001 | 5.76 | |||
| hsa‐miR‐652‐5p | 0.0001 | 6.05 | |||
| hsa‐miR‐660‐5p | 0.0051 | 27.64 | |||
| hsa‐miR‐6722‐3p | 0.0001 | 41.71 | |||
| hsa‐miR‐6723‐5p | 0.0000 | 7.08 | |||
| hsa‐miR‐718 | 0.0001 | 2.05 | |||
| hsa‐miR‐762 | 0.0023 | 2.31 | |||
| hsa‐miR‐765 | 0.0000 | 5.74 | |||
| hsa‐miR‐92a‐3p | 0.0049 | 3.64 | |||
| hsa‐miR‐939‐5p | 0.0002 | 46.26 | |||
| hsa‐miR‐96‐5p | 0.0049 | 10.55 |
IA indicates intracranial aneurysm.
Validation of Candidate miRNAs With qPCR
We first performed preliminary experiments to determine the optimal conditions for PCR by using serial dilutions of the cDNA sample.18 We found that within the range of 1:80 to 1:20 dilution of the cDNA sample, there was a nice linearity of the corresponding Cq values (r2=0.98) (Figure 2). In the following experiments, we used a dilution ratio of 1:20 for all samples. To further validate the microarray results, we performed real‐time PCR analysis with samples randomly selected from 17 controls and 26 patients (a mixture of both ruptured and unruptured). Because the abundance of specific miRNAs in plasma differs greatly from each other, we selected 6 miRNAs with relatively high, medium, and low signal intensities as detected by microarray, including miR‐16 (which had an average intensity ≈500), miR‐25 (intensity ≈50), and miR‐let‐7 g, miR‐1183, miR‐1825, and miR‐188‐5p (average intensities ≈30 to 35). PCR could not detect miR‐1183 or miR‐1825, because the concentrations of these miRNAs might be lower than the threshold of PCR sensitivity. Among PCR‐detectable miRNAs, miR‐16 and miR‐25 levels were significantly higher in IA patients (Figure 3). The level of miR‐let‐7 g in IA patients also displayed a trend of increase compared with controls, while this change did not reach a statistical significance (Figure 3). We found that miR‐188‐5p was detectable in the majority of samples from IA patients (19 of 25; a few samples failed to amplify) but was not detected in 13 of 15 samples from healthy controls. This was consistent with the array data showing an increased level of miR‐188‐5p in IA patients. Overall, these data are in agreement with the results from the microarray study.
Figure 2.
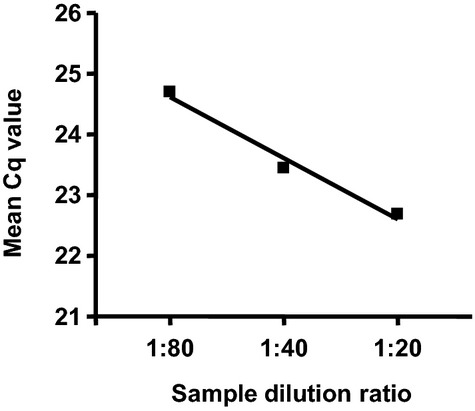
Determination of the optimal condition for qPCR by using serial dilutions of the cDNA sample. The spike‐in C. elegans miRNA cel‐miR‐39‐3p was measured. qPCR indicates quantitative real‐time polymerase chain reaction.
Figure 3.
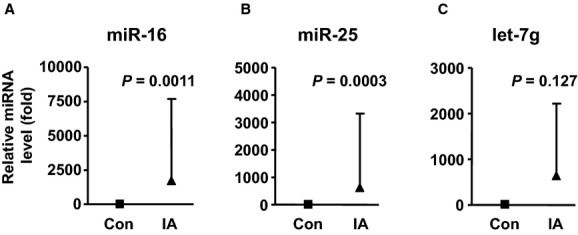
Relative levels of miR‐16, miR‐25, and let‐7g in the plasma from control subjects (n=17) and IA patients (n=26), measured with qPCR. Data were mean±SD; the P values were by Mann–Whitney test. IA indicates intracranial aneurysm; qPCR, quantitative real‐time polymerase chain reaction.
Identification of miRNA‐16 and miRNA‐25 as Potential Biomarkers of IA
To test whether miRNAs had any value in assessing the presence of IA, we performed PCRs on miR‐16 and miR‐25 with the combined cohort. In some samples, the spike‐in miRNA failed to be amplified, and these were excluded from further analysis. Logistic regression analysis demonstrated that both miR‐16 and miR‐25 were independent factors for IA occurrence (P<0.001, Wald test). Using a multivariable model and after adjustment for other confounding factors including age, sex, hypertension, smoking, and medication, the contributions of miR‐16 and miR‐25 were still highly significant (P<0.001, Wald test). The adjusted OR values for each 1‐unit decrease in the ΔCq value (double the level of miRNA in plasma) for miR‐16 and miR‐25 were 1.52 (95% CI 1.31 to 1.77) and 1.53 (1.30 to 1.79), respectively. ROC curves for models containing the biomarkers only demonstrated that both miR‐16 and miR‐25 are good predicators for IA, with the area under the curve (AUC) being 0.857 for miR‐16 and 0.852 for miR‐25 (all P<0.001) (Figure 4). However, combining both miR‐16 and miR‐25 in a single model did not improve the performance for risk association (AUC 0.858). For the model containing covariates only, the AUC value was 0.712. The AUC for the multivariable model containing miR‐16 and covariates was 0.891; the AUC for the model containing miR‐25 and covariates was 0.879.
Figure 4.
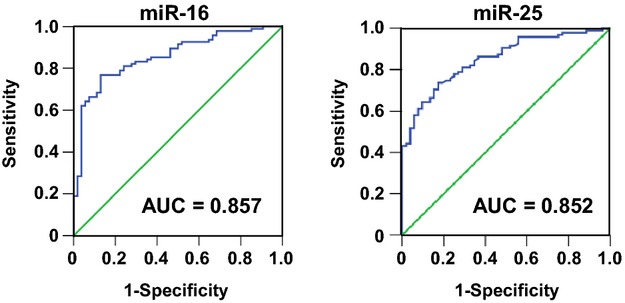
Receiver operating characteristic (ROC) curves for miR‐16 and miR‐25 constructed using raw ΔCq values. AUC indicates area under the curve.
To further confirm that the changes in miR‐16 and miR‐25 levels were not caused by differences in clinical profiles of controls and IA patients, we selected a small subgroup of subjects with highly comparable clinical profiles (specifically, mean ages being 46.6 versus 48.4; all without risk factors including history of hypertension, current smoking, hypercholesterolemia, and diabetes; with exactly matching sex ratios; and all without medication), and we confirmed that the plasma levels of miR‐16 and miR‐25 were likewise significantly elevated in IA patients, with miR‐16 being 17.8±10.5 (‐fold of control) and miR‐25 being 15.6±7.2, respectively (all P<0.001, unpaired t test, n=11).
Discussion
The major finding in this study is that, compared with healthy controls, 20 plasma miRNAs are significantly altered in IA patients, regardless the status of the aneurysms (either ruptured or unruptured). Because these miRNAs were unanimously changed in both ruptured and unruptured cases, it was unlikely that the observed changes in circulating miRNA were caused by secondary complications of IA, such as SAH and neural damages. Moreover, all of the samples from unruptured patients were taken before any pharmacological and/or surgical treatments; hence, it is also unlikely that the altered circulating miRNA levels in IA patients were a result of clinical treatments. Results from previous genomewide studies on IAs indicated that the data reproducibility across different microarray experiments were relatively poor.19 For this reason, we carried out a verification experiment by using a different array platform and covering a larger sample size. Of note, we demonstrated that 60% of the miRNA targets identified in the initial screening were also reproduced by the validation experiment, confirming the robustness of the microarray approach used in the present study.
Among these miRNAs, we paid a special attention to miR‐16 and miR‐25, because these 2 miRNA species were relatively abundant in the plasma,20–21 which allowed us to reliably measure their levels by using PCR. Using a multivariable logistic regression model, we demonstrated that only hypertension and the miRNA levels, but not age, sex, smoking, or medication, were independent predicators for the presence of IAs. Our model suggested that for each 2‐fold increase in the miRNA‐16 or miRNA‐25 level, the OR increased by ≈1.5. The sample size for model construction (total n=149 valid Cq values) was adequate for a 6‐variable logistic regression analysis.22 Moreover, the ROC analysis demonstrated that the AUC values for both miR‐16 and miR‐25 were >0.85,23 indicating that plasma miR‐16 and miR‐25 levels might be useful biological markers for assessing the risk of IAs.
Great research efforts have been made to identify nongenetic factors that may be used to predict the risk of having IAs. However, clinical studies have only identified several traditional risk factors, such as age, sex, smoking, and hypertension, for unruptured IAs.4–5,4–25 In contrast, little is known about whether there are biochemical markers that can be easily tested and be of value in predicting the risk of IA. In a previous study in asymptomatic patients with a positive familial history of IA occurrence, it was found that there was a significant correlation between elevated serum lipoprotein(a) levels and presence of IAs.10 However, these authors did not perform further analysis to show the usefulness of lipoprotein(a) levels in IA risk assessment. Conversely, another study attempting to link the plasma level of vascular endothelial growth factor with unruptured IA yielded negative results.26 To our knowledge, this is the first study to suggest that changes in specific miRNA levels in the plasma may be useful in assessing the likelihood of presence of IAs. There is evidence indicating that there is a need to screen populations with a significantly increased risk (eg, the first‐degree members of families with familial SAH), because the incidence of harboring IA(s) in these individuals may be particularly high.27 Therefore, identification of blood biomarkers with high sensitivity and specificity will be essential for population‐wide, cost‐effective screening tests to identify asymptomatic IAs.
A challenge in measuring miRNA levels in plasma using qPCR is that there is not an established housekeeping gene to normalize the PCR data.18,20 Hence, different strategies were used in experiments, including quantification of the absolute copy number of miRNA per unit volume of plasma using standard curves constructed with synthetic RNA molecules17,28 and using spike‐in miRNAs from exogenous sources (eg, C. elegans).29–30 In the present study, we used C. elegans miR‐39‐3p spike‐in as an internal reference. In particular, we added the spike‐in before, rather than after, the total RNA isolation step, which might partially eliminate the variance introduced by the RNA extraction procedure.31 Moreover, the high linearity between the amount of input cDNA sample and the resultant Cq values suggested that carry‐over contamination by potential PCR inhibitors was negligible in our experiments.18 In addition, we confirmed that in the 20 miRNAs identified, there were no typical blood cell–derived miRNAs such as miR‐20a, miR‐106a, miR‐185, and miR‐144.18
The human miR‐16 is one of the most abundant miRNAs present in the plasma. Many of previous studies used miR‐16 as the housekeeping gene in qPCR assays, because the level of this miRNA has been shown to be relatively stable among individuals.20 However, our results indicate that the plasma level of miR‐16 can be considerably changed under certain pathological conditions. Also, this finding is consistent with those reported by others.32–33 These observations argue that careful validation experiments should be performed to justify the use of miR‐16 as an endogenous reference in assaying plasma miRNA levels with qPCR. Currently, we are not clear about the origin of these increased miRNAs in the plasma in IA patients. Mounting evidence suggests that miRNAs in the blood are released by cells via different cellular transportation mechanisms.15 It was reported that miR‐16 was expressed by vascular endothelial cells and was involved in regulating the angiogenic functions of the endothelial cell.34 miR‐25 has been shown to be expressed in airway smooth muscle cells, while it is unclear whether vascular smooth muscle cells also express miR‐25.35 Nevertheless, it is possible that changes in the plasma level of these miRNAs may reflect pathological alterations in the vascular tissue.
Of other altered miRNAs, we found that several members of the let‐7 family miRNAs and miRNA‐18a were also changed in IA patients. These miRNAs are highly expressed in vascular endothelial cells and involved in modulating important endothelial cell functions such as angiogenesis.36–37 miRNA‐486 is a muscle‐enriched miRNA that has critical roles in regulating functions of the phosphoinositide 3‐kinase/Akt signaling pathway.38 A recent study has reported that miR‐7 is a negative regulator of collagen expression in dermal fibroblasts.39 Although these biological effects may all be relevant to the development of IA, the functional interrelationships between IA and each individual miRNA remain to be clarified. Alternatively, system biology approaches may provide a basis for understanding of the biological significance of the differential expression in miRNAs. Hence, we performed additional functional network analysis on all of the changed miRNAs. We found that the most overrepresented biological processes associated with these miRNAs are inflammatory disease, inflammatory response, and connective tissue disorders. This finding is consistent with the notion that inflammation may have a pivotal role in the pathogenesis of IA.40
In summary, we demonstrated that a battery of plasma miRNAs were significantly changed in patients with either ruptured or unruptured IAs. Our data suggest that circulating miRNAs may be used as novel biological markers in assessing the likelihood of occurrence of IAs in high‐risk individuals.
Sources of Funding
This study was partially supported by research grants from National 973 Basic Research Program (grant 2010CB732605 to Jiang and grant 2012CB518603 to Zhang), Natural Science Foundation of China (grant 81271269 for Jiang and grants 81220108007, 81171078, and 81171079 to Yang), National High‐tech Research and Development Program of China (grant 2012AA02A510 to Zhang), State Program of National Natural Science Foundation of China for Innovative Research Group (grant 81021001 to Zhang), and High‐Level Health Technique Talent Training Plan of Beijing Health System (grant 2009‐3‐22 to Yang).
Disclosures
None.
References
- 1.Brown RD. Unruptured intracranial aneurysms. Semin Neurol. 2010; 30:537-544. [DOI] [PubMed] [Google Scholar]
- 2.Vlak MH, Algra A, Brandenburg R, Rinkel GJ. Prevalence of unruptured intracranial aneurysms, with emphasis on sex, age, comorbidity, country, and time period: a systematic review and meta‐analysis. Lancet Neurol. 2011; 10:626-636. [DOI] [PubMed] [Google Scholar]
- 3.Bederson JB, Connolly ES, Jr, Batjer HH, Dacey RG, Dion JE, Diringer MN, Duldner JE, Jr, Harbaugh RE, Patel AB, Rosenwasser RH. Guidelines for the management of aneurysmal subarachnoid hemorrhage: a statement for healthcare professionals from a special writing group of the Stroke Council, American Heart Association. Stroke. 2009; 40:994-1025. [DOI] [PubMed] [Google Scholar]
- 4.Juvela S, Poussa K, Porras M. Factors affecting formation and growth of intracranial aneurysms: a long‐term follow‐up study. Stroke. 2001; 32:485-491. [DOI] [PubMed] [Google Scholar]
- 5.Vlak MH, Rinkel GJ, Greebe P, Algra A. Independent risk factors for intracranial aneurysms and their joint effect: a case‐control study. Stroke. 2013; 44:984-987. [DOI] [PubMed] [Google Scholar]
- 6.Fontanella M, Rainero I, Gallone S, Rubino E, Fenoglio P, Valfre W, Garbossa D, Carlino C, Ducati A, Pinessi L. Tumor necrosis factor‐alpha gene and cerebral aneurysms. Neurosurgery. 2007; 60:668-672. [DOI] [PubMed] [Google Scholar]
- 7.Weinsheimer S, Goddard KA, Parrado AR, Lu Q, Sinha M, Lebedeva ER, Ronkainen A, Niemela M, Khusnutdinova EK, Khusainova RI, Helin K, Jaaskelainen JE, Sakovich VP, Land S, Kuivaniemi H, Tromp G. Association of kallikrein gene polymorphisms with intracranial aneurysms. Stroke. 2007; 38:2670-2676. [DOI] [PubMed] [Google Scholar]
- 8.Mineharu Y, Inoue K, Inoue S, Yamada S, Nozaki K, Takenaka K, Hashimoto N, Koizumi A. Association analysis of common variants of ELN, NOS2A, APOE and ACE2 to intracranial aneurysm. Stroke. 2006; 37:1189-1194. [DOI] [PubMed] [Google Scholar]
- 9.McColgan P, Thant KZ, Sharma P. The genetics of sporadic ruptured and unruptured intracranial aneurysms: a genetic meta‐analysis of 8 genes and 13 polymorphisms in approximately 20,000 individuals. J Neurosurg. 2010; 112:714-721. [DOI] [PubMed] [Google Scholar]
- 10.Phillips J, Roberts G, Bolger C, el Baghdady A, Bouchier‐Hayes D, Farrell M, Collins P. Lipoprotein (a): a potential biological marker for unruptured intracranial aneurysms. Neurosurgery. 1997; 40:1112-1115. [DOI] [PubMed] [Google Scholar]
- 11.Clarke M. Systematic review of reviews of risk factors for intracranial aneurysms. Neuroradiology. 2008; 50:653-664. [DOI] [PubMed] [Google Scholar]
- 12.Inagawa T. Risk factors for aneurysmal subarachnoid hemorrhage in patients in Izumo City, Japan. J Neurosurg. 2005; 102:60-67. [DOI] [PubMed] [Google Scholar]
- 13.Vlak MH, Rinkel GJ, Greebe P, Greving JP, Algra A. Lifetime risks for aneurysmal subarachnoid haemorrhage: multivariable risk stratification. J Neurol Neurosurg Psychiatry. 2013; 84:619-623. [DOI] [PubMed] [Google Scholar]
- 14.Bartel DP. MicroRNAs: genomics, biogenesis, mechanism, and function. Cell. 2004; 116:281-297. [DOI] [PubMed] [Google Scholar]
- 15.Creemers EE, Tijsen AJ, Pinto YM. Circulating microRNAs: novel biomarkers and extracellular communicators in cardiovascular disease? Circ Res. 2012; 110:483-495. [DOI] [PubMed] [Google Scholar]
- 16.Allegra A, Alonci A, Campo S, Penna G, Petrungaro A, Gerace D, Musolino C. Circulating microRNAs: new biomarkers in diagnosis, prognosis and treatment of cancer. Int J Oncol. 2012; 41:1897-1912. [DOI] [PubMed] [Google Scholar]
- 17.Guo D, Liu J, Wang W, Hao F, Sun X, Wu X, Bu P, Zhang Y, Liu Y, Liu F, Zhang Q, Jiang F. Alteration in abundance and compartmentalization of inflammation‐related mirnas in plasma after intracerebral hemorrhage. Stroke. 2013; 44:1739-1742. [DOI] [PubMed] [Google Scholar]
- 18.Mo MH, Chen L, Fu Y, Wang W, Fu SW. Cell‐free circulating miRNA biomarkers in cancer. J Cancer. 2012; 3:432-448. [DOI] [PMC free article] [PubMed] [Google Scholar]
- 19.Roder C, Kasuya H, Harati A, Tatagiba M, Inoue I, Krischek B. Meta‐analysis of microarray gene expression studies on intracranial aneurysms. Neuroscience. 2012; 201:105-113. [DOI] [PubMed] [Google Scholar]
- 20.Reid G, Kirschner MB, van Zandwijk N. Circulating microRNAs: association with disease and potential use as biomarkers. Crit Rev Oncol Hematol. 2010; 80:193-208. [DOI] [PubMed] [Google Scholar]
- 21.Williams Z, Ben‐Dov IZ, Elias R, Mihailovic A, Brown M, Rosenwaks Z, Tuschl T. Comprehensive profiling of circulating microRNA via small RNA sequencing of cDNA libraries reveals biomarker potential and limitations. Proc Natl Acad Sci USA. 2013; 110:4255-4260. [DOI] [PMC free article] [PubMed] [Google Scholar]
- 22.LaValley MP. Logistic regression. Circulation. 2008; 117:2395-2399. [DOI] [PubMed] [Google Scholar]
- 23.Fan J, Upadhye S, Worster A. Understanding receiver operating characteristic (ROC) curves. CJEM. 2006; 8:19-20. [DOI] [PubMed] [Google Scholar]
- 24.Gu YX, Chen XC, Song DL, Leng B, Zhao F. Risk factors for intracranial aneurysm in a Chinese ethnic population. Chin Med J (Engl). 2006; 119:1359-1364. [PubMed] [Google Scholar]
- 25.Juvela S. Natural history of unruptured intracranial aneurysms: risks for aneurysm formation, growth, and rupture. Acta Neurochir Suppl. 2002; 82:27-30. [DOI] [PubMed] [Google Scholar]
- 26.Sandalcioglu IE, Wende D, Eggert A, Regel JP, Stolke D, Wiedemayer H. VEGF plasma levels in non‐ruptured intracranial aneurysms. Neurosurg Rev. 2006; 29:26-29. [DOI] [PubMed] [Google Scholar]
- 27.Raaymakers TW, Rinkel GJ, Ramos LM. Initial and follow‐up screening for aneurysms in families with familial subarachnoid hemorrhage. Neurology. 1998; 51:1125-1130. [DOI] [PubMed] [Google Scholar]
- 28.Kirschner MB, Kao SC, Edelman JJ, Armstrong NJ, Vallely MP, van Zandwijk N, Reid G. Haemolysis during sample preparation alters microRNA content of plasma. PLoS One. 2011; 6:e24145. [DOI] [PMC free article] [PubMed] [Google Scholar]
- 29.Fichtlscherer S, De Rosa S, Fox H, Schwietz T, Fischer A, Liebetrau C, Weber M, Hamm CW, Roxe T, Muller‐Ardogan M, Bonauer A, Zeiher AM, Dimmeler S. Circulating microRNAs in patients with coronary artery disease. Circ Res. 2010; 107:677-684. [DOI] [PubMed] [Google Scholar]
- 30.Turchinovich A, Weiz L, Langheinz A, Burwinkel B. Characterization of extracellular circulating microRNA. Nucleic Acids Res. 2011; 39:7223-7233. [DOI] [PMC free article] [PubMed] [Google Scholar]
- 31.Kroh EM, Parkin RK, Mitchell PS, Tewari M. Analysis of circulating microRNA biomarkers in plasma and serum using quantitative reverse transcription‐PCR (qRT‐PCR). Methods. 2010; 50:298-301. [DOI] [PMC free article] [PubMed] [Google Scholar]
- 32.Redell JB, Moore AN, Ward NH, III, Hergenroeder GW, Dash PK. Human traumatic brain injury alters plasma microRNA levels. J Neurotrauma. 2010; 27:2147-2156. [DOI] [PMC free article] [PubMed] [Google Scholar]
- 33.Zuo Z, Calin GA, de Paula HM, Medeiros LJ, Fernandez MH, Shimizu M, Garcia‐Manero G, Bueso‐Ramos CE. Circulating microRNAs let‐7a and miR‐16 predict progression‐free survival and overall survival in patients with myelodysplastic syndrome. Blood. 2011; 118:413-415. [DOI] [PMC free article] [PubMed] [Google Scholar]
- 34.Chamorro‐Jorganes A, Araldi E, Penalva LO, Sandhu D, Fernandez‐Hernando C, Suarez Y. MicroRNA‐16 and microRNA‐424 regulate cell‐autonomous angiogenic functions in endothelial cells via targeting vascular endothelial growth factor receptor‐2 and fibroblast growth factor receptor‐1. Arterioscler Thromb Vasc Biol. 2011; 31:2595-2606. [DOI] [PMC free article] [PubMed] [Google Scholar]
- 35.Kuhn AR, Schlauch K, Lao R, Halayko AJ, Gerthoffer WT, Singer CA. MicroRNA expression in human airway smooth muscle cells: role of miR‐25 in regulation of airway smooth muscle phenotype. Am J Respir Cell Mol Biol. 2010; 42:506-513. [DOI] [PMC free article] [PubMed] [Google Scholar]
- 36.Kuehbacher A, Urbich C, Zeiher AM, Dimmeler S. Role of Dicer and Drosha for endothelial microRNA expression and angiogenesis. Circ Res. 2007; 101:59-68. [DOI] [PubMed] [Google Scholar]
- 37.Santoro MM, Nicoli S. miRNAs in endothelial cell signaling: the endomiRNAs. Exp Cell Res. 2013; 319:1324-1330. [DOI] [PMC free article] [PubMed] [Google Scholar]
- 38.Small EM, O'Rourke JR, Moresi V, Sutherland LB, McAnally J, Gerard RD, Richardson JA, Olson EN. Regulation of PI3‐kinase/Akt signaling by muscle‐enriched microRNA‐486. Proc Natl Acad Sci USA. 2010; 107:4218-4223. [DOI] [PMC free article] [PubMed] [Google Scholar]
- 39.Etoh M, Jinnin M, Makino K, Yamane K, Nakayama W, Aoi J, Honda N, Kajihara I, Makino T, Fukushima S, Ihn H. microRNA‐7 down‐regulation mediates excessive collagen expression in localized scleroderma. Arch Dermatol Res. 2013; 305:9-15. [DOI] [PubMed] [Google Scholar]
- 40.Chalouhi N, Ali MS, Jabbour PM, Tjoumakaris SI, Gonzalez LF, Rosenwasser RH, Koch WJ, Dumont AS. Biology of intracranial aneurysms: role of inflammation. J Cereb Blood Flow Metab. 2012; 32:1659-1676. [DOI] [PMC free article] [PubMed] [Google Scholar]