

Abstract
Background
The healthiest dietary pattern for myocardial infarction (MI) survivors is not known. Specific long‐term benefits of a low‐carbohydrate diet (LCD) are unknown, whether from animal or vegetable sources. There is a need to examine the associations between post‐MI adherence to an LCD and all‐cause and cardiovascular mortality.
Methods and Results
We included 2258 women from the Nurses' Health Study and 1840 men from the Health Professional Follow‐Up Study who had survived a first MI during follow‐up and provided a pre‐MI and at least 1 post‐MI food frequency questionnaire. Adherence to an LCD high in animal sources of protein and fat was associated with higher all‐cause and cardiovascular mortality (hazard ratios of 1.33 [95% CI: 1.06 to 1.65] for all‐cause mortality and 1.51 [95% CI: 1.09 to 2.07] for cardiovascular mortality comparing extreme quintiles). An increase in adherence to an animal‐based LCD prospectively assessed from the pre‐ to post‐MI period was associated with higher all‐cause mortality and cardiovascular mortality (hazard ratios of 1.30 [95% CI: 1.03 to 1.65] for all‐cause mortality and 1.53 [95% CI: 1.10 to 2.13] for cardiovascular mortality comparing extreme quintiles). An increase in adherence to a plant‐based LCD was not associated with lower all‐cause or cardiovascular mortality.
Conclusions
Greater adherence to an LCD high in animal sources of fat and protein was associated with higher all‐cause and cardiovascular mortality post‐MI. We did not find a health benefit from greater adherence to an LCD overall after MI.
Keywords: low‐carbohydrate diet, mortality, myocardial infarction, secondary prevention
Introduction
Over the past several decades, improvements in clinical care, including more frequent use of reperfusion therapy and secondary prevention medications, have greatly increased patients' survival following myocardial infarction (MI).1–6 At the same time, the characteristics of MI survivors have changed, with higher prevalence of obesity, metabolic syndrome, and type 2 diabetes.1–4
The American Heart Association guidelines for coronary heart disease state that patients should be instructed to achieve and maintain a healthy weight (body mass index 18.5 to 24.9 kg/m2) through changes in diet and physical activity5–8; however, the effect of a weight‐loss diet among MI survivors is unknown. Many nutritionists still recommended low‐fat diets for post‐MI patients despite the potential unfavorable effects this may have on triglycerides and high‐density lipoprotein cholesterol.9–11 Low‐carbohydrate diets (LCDs) have become extremely popular in recent years. Their purported benefits are generally linked to short‐term weight loss,12 improved fasting glucose and insulin sensitivity, improved triglycerides and high‐density lipoprotein cholesterol, reduced systemic inflammation,12–13 lower systolic and diastolic blood pressure,12 and reduced overall glycemic load and risk of type 2 diabetes12,14–15; however, data on long‐term effects of LCDs are sparse, and no data are available for MI survivors. It is unknown whether an LCD is a safe weight‐loss diet for MI patients. Furthermore, not all LCDs are equal: They may be rich in animal‐based protein and fat or may be mainly from plant‐based sources.
Using a previously developed LCD score (LCDS) based specifically on total, animal, and plant sources,16 we prospectively examined the long‐term benefit of adhering to an LCD after initial MI in 2 large existing cohort studies with dietary information collected both before and after initial MI and with long‐term follow‐up. We hypothesized that an LCD may have benefits for MI survivors but could be detrimental if the diet is higher in saturated fat and protein. We hypothesized that greater adherence to an LCD in the period following MI is associated with lower mortality.
Methods
Study Population
The Nurses' Health Study is a prospective cohort of 121 700 registered female nurses who were aged between 30 and 55 years at enrollment in 1976.17 The Health Professional Follow‐up Study is a prospective cohort of 51 529 US male health professionals aged 40 to 75 years at baseline in 1986.18 Participants in both studies received biennial questionnaires on lifestyle and medical history.
Our study included 2258 women and 1840 men who were free of cardiovascular disease, stroke, and cancer at the time of enrollment, survived their initial MI, were free of stroke at the time of initial MI onset, and provided at least 1 pre‐MI and post‐MI food frequency questionnaire (FFQ) before death. We calculated the post‐MI period from the date of the first FFQ returned after the initial MI until death or the end of the study period (June 30, 2008).
Exposure Assessment
Dietary intake was assessed using a validated FFQ every 4 years.19 A valid FFQ was defined as within a preset estimated caloric range (600 to 3500 kcal/day for women and 800 to 4200 kcal/day for men) and had <70 food items with missing data. The average nutrient intake was calculated by multiplying the nutrient content for each food, as assembled from the Harvard University Food Composition Database, by the frequency of consumption and then summed across all food items. This FFQ has been validated and shown to adequately reflect average food and nutrient intake over the previous year (Pearson's correlations range from 0.5 to 0.7 for total fat, carbohydrate, and protein).19–21
We calculated the percentage of energy from fat, proteins, and carbohydrates for each study participant and separately calculated the intake from animal and plant sources.16 We divided participants into 11 strata for each macronutrient. Those in the highest stratum were assigned scores of 10 for fat, 10 for protein, and 0 for carbohydrate. We summed the scores for percentage of energy from total fat, protein, and carbohydrate to represent the overall LCDS for each study participant. The score ranged from 0 (the lowest fat and protein intake and highest carbohydrate intake) to 30 (the highest protein and fat intake and lowest carbohydrate intake). A plant‐based LCDS was calculated based on percentages of energy from carbohydrates, vegetable protein, and vegetable fat; we calculated the animal‐based LCDS in a similar manner. The higher the score, the more closely the participant adhered to a specific type of LCD.16
Confirmation of Incident MI
Study physicians who were blinded to participants' exposure status reviewed medical records to confirm incident MI diagnosis.22 MI was confirmed based on the World Health Organization's criteria.23
Outcome Assessment
Our primary outcomes were all‐cause and cardiovascular mortality. After the initial nonfatal MI, deaths occurring during the follow‐up period were identified from vital records, the National Death Index, and reports by the participant's next of kin or the postal system.24 Cardiovascular mortality consisted of fatal coronary heart disease or fatal stroke, confirmed through a review of death certificates, medical records, or autopsy reports, with the permission of the next of kin.
Covariate Assessment
Covariates were chosen a priori based on the literature and on previous studies of MI survival. We considered medication use, medical history, and lifestyles factors that have been reported to be associated with MI risk. All covariates were updated with each questionnaire cycle, and we dropped the following covariates from the multivariate models because their inclusion did not change the β‐coefficient for the main effect by at least 10%: beta blocker medication use, antihypertension medication use, height, MI site, ST‐elevation MI, family history of MI, hypercholesterolemia, and multivitamin use.
Statistical Analyses
Baseline characteristics by quintile of adherence to the LCD are presented as means or frequencies. Pre‐MI LCDS was estimated from the most recent FFQ before initial MI onset. Change of LCDS from pre‐ to post‐MI periods was defined as the absolute difference of the LCDS (post‐MI LCDS−pre‐MI LCDS). We categorized each exposure of interest (total, plant‐ and animal‐based LCD in the post‐MI period and changes from pre‐ to post‐MI periods) into quintiles.
To assess the associations between LCD and post‐MI mortality, a Cox proportional hazards model was used with time since return of the first post‐MI FFQ as the underlying time scale. For analyses of dose‐response trends, the medians of each quintile were fit as a continuous variable. We evaluated heterogeneity of results for men and women using Cochrane Q statistics 25 and then meta‐analyzed across cohorts using a fixed‐effect model.26–27 The proportional hazards assumption was assessed by testing the significance of the interaction term between LCDS and time in the study. We further performed substitution analysis to estimate the relative risk for all‐cause and cardiovascular mortality associated with replacement of 10% energy from animal sources with plant sources of food.
To evaluate the rate of mortality associated with changes in the LCDS from before to after MI, we adjusted for corresponding changes in covariates from pre‐ to post‐MI periods. For missing data, the missing indicator method was used for categorical variables and replaced the missing value for continuous variables with the median change.
To evaluate whether the association between animal‐based LCDs and mortality differed by diabetes status (yes versus no), we tested for potential effect modification using the likelihood ratio test. We also adjusted for cereal fiber, omega‐3 fatty acids, and saturated fat in the multivariate model to assess whether the association with animal‐based LCDs was driven mainly by these dietary factors.
Participants who returned an FFQ within 1 year of initial MI may not accurately represent their post‐MI diet because the time frame would bridge the pre‐ and post‐MI periods. In a sensitivity analysis, we excluded these FFQs and included only those participants with a subsequent FFQ at least 12 months after MI (total sample size: 1689 men and 2059 women). If the 381 women and 241 men who died before they completed a post‐MI FFQ were substantially different with respect to their LCDs, we may have introduced a modest selection bias. Consequently, we estimated the probability of being selected into this study and assigned each study participant a weight by the inverse of this probability.28
We also conducted analyses among the subset of participants who were in the lower half of the LCDS before initial MI onset (pre‐MI LCDS less than the median of 15). We defined those who had an LCDS <15 before MI but >15 after MI as the new adherent group, and those who had an LCDS <15 in both the pre‐ and post‐MI periods as nonadherent. In this analysis, we had a sample size of 1059 for women (294 new adherents and 765 nonadherents) and 804 for men (216 new adherents and 588 nonadherents).
This study complies with the Declaration of Helsinki. The Harvard School of Public Health ethics committee approved the research protocol, and informed consent was obtained from the study participants.
Results
During follow‐up of 2258 women and 1840 men who survived an initial MI, we confirmed 682 total and 336 cardiovascular deaths for women and 451 total and 222 cardiovascular deaths for men. Median interval between initial MI onset and the first post‐MI dietary assessment was 2 years. Median survival time was 8 years for women and 9 years for men. At the time of first post‐MI questionnaire, median body mass index was 26.5 kg/m2 among women and 25.8 kg/m2 among men. Participants on average increased their consumption of carbohydrates following MI and thus had a lower LCDS after MI (Table 1). Spearman correlation coefficients between pre‐ and post‐MI total LCDSs were 0.31 for women and 0.38 for men; 0.35 and 0.41, respectively, for animal‐based LCDSs; and 0.34 and 0.40, respectively, for vegetable‐based LCDSs. Prevalence of baseline diabetes was higher among participants with high LCDSs.
Table 1.
Age‐Standardized Baseline Characteristics of 2258 Post‐MI Women in the Nurses' Health Study and 1840 Post‐MI Men in the Health Professional Follow‐up Study by Quintiles of Total Low‐Carbohydrate Diet Score
| Women | Men | |||||
|---|---|---|---|---|---|---|
| Q1 | Q3 | Q5 | Q1 | Q3 | Q5 | |
| n | 407 | 491 | 424 | 410 | 382 | 321 |
| Post‐MI total LCDS* | 3.5 (2.0) | 13.4 (1.1) | 24.0 (2.6) | 4.1 (2.2) | 12.4 (1.1) | 24.3 (2.7) |
| Pre‐MI total LCDS* | 11.3 (6.7) | 15.2 (6.8) | 19.3 (6.9) | 12.2 (7.3) | 15.4 (6.3) | 19.9 (6.3) |
| Change of total LCDS from pre‐ to post MI* | −7.8 (6.8) | −1.8 (6.8) | 4.7 (7.1) | −8.1 (7.4) | −3.0 (6.4) | 4.5 (6.5) |
| Post‐MI plant‐based LCDS* | 6.3 (2.4) | 13.9 (0.8) | 22.0 (2.2) | 6.9 (2.2) | 14.0 (0.8) | 21.8 (2.6) |
| Pre‐MI plant‐based LCDS* | 12.0 (5.4) | 14.6 (5.2) | 17.7 (5.2) | 12.2 (5.0) | 15.2 (4.9) | 17.9 (5.3) |
| Change of plant‐based LCDS from pre‐ to post‐MI periods* | −5.7 (5.2) | −0.7 (5.2) | 4.3 (5.4) | −5.3 (5.1) | −1.2 (4.9) | 3.8 (5.5) |
| Post‐MI animal‐based LCDS* | 2.7 (1.7) | 13.0 (1.4) | 25.5 (2.5) | 2.4 (1.7) | 13.0 (1.4) | 24.8 (2.8) |
| Pre‐MI animal‐based LCDS* | 11.1 (7.9) | 15.7 (7.2) | 19.8 (7.3) | 11.2 (7.9) | 15.3 (7.0) | 20.3 (6.7) |
| Change of animal‐based LCDS from pre‐ to post‐MI periods* | −8.4 (8.0) | −2.7 (7.3) | 5.7 (7.4) | −8.8 (7.9) | −2.3 (7.0) | 4.5 (6.9) |
| Age at diagnosis, y* | 65.1 (8.4) | 64.9 (8.6) | 64.4 (8.6) | 66.0 (9.0) | 66.1 (9.1) | 66.1 (9.3) |
| Body mass index, kg/m2 | 25.8 (5.4) | 26.6 (5.2) | 28.2 (5.9) | 25.3 (3.4) | 26.1 (3.7) | 26.8 (3.8) |
| Physical activity, MET hours/week | 14.3 (18.2) | 14.7 (16.9) | 12.7 (17.4) | 35.6 (34.0) | 32.9 (48.7) | 32.1 (38.5) |
| Smoking status | ||||||
| Never smoker, % | 36 | 32 | 27 | 39 | 37 | 26 |
| Past smoker, % | 55 | 59 | 57 | 49 | 52 | 58 |
| Current smoker, % | 9 | 9 | 16 | 12 | 11 | 16 |
| Currently married, % | 52 | 57 | 58 | 88 | 89 | 87 |
| Diabetes, % | 13 | 21 | 36 | 8 | 17 | 24 |
| High blood pressure, % | 66 | 69 | 72 | 54 | 56 | 59 |
| Elevated cholesterol, % | 75 | 72 | 78 | 67 | 64 | 65 |
| Aspirin use, % | 65 | 61 | 62 | 84 | 84 | 79 |
| Lipid‐lowering medication use, % | 44 | 52 | 48 | 51 | 56 | 47 |
| CABG, % | 56 | 56 | 57 | 74 | 75 | 72 |
| Reproductive factors | ||||||
| Premenopause, % | 4 | 5 | 4 | n/a | n/a | n/a |
| Past PMH user, % | 31 | 30 | 29 | n/a | n/a | n/a |
| Current PMH user, % | 58 | 57 | 55 | n/a | n/a | n/a |
| Post‐MI dietary intake | ||||||
| Total energy, kcal/day | 1581 (534) | 1628 (515) | 1607 (536) | 2006 (632) | 1880 (595) | 1927 (658) |
| Saturated fat, % of energy | 6.9 (2.0) | 9.0 (2.3) | 12.0 (2.5) | 6.2 (2.0) | 8.2 (2.2) | 11.7 (2.7) |
| Omega‐3 fatty acids, % of energy | 0.6 (0.3) | 0.7 (0.3) | 0.9 (0.4) | 0.6 (0.3) | 0.8 (0.4) | 0.8 (0.6) |
| Trans fat, % of energy | 1.2 (0.6) | 1.4 (0.6) | 1.8 (0.6) | 1.2 (0.7) | 1.4 (0.6) | 1.8 (0.7) |
| Animal fat, % of energy | 9.5 (3.4) | 13.3 (4.0) | 19.3 (5.4) | 8.0 (3.2) | 12.1 (3.6) | 19.5 (6.0) |
| Vegetable fat, % of energy | 12.3 (4.0) | 14.5 (4.8) | 17.0 (6.2) | 13.1 (4.3) | 14.6 (4.9) | 17.2 (6.1) |
| Animal protein, % of energy | 9.3 (2.7) | 12.8 (3.3) | 15.5 (3.8) | 9.0 (2.7) | 12.5 (3.3) | 15.2 (3.7) |
| Vegetable protein, % of energy | 6.0 (1.4) | 5.8 (1.3) | 5.2 (1.2) | 6.5 (1.6) | 6.0 (1.3) | 5.2 (1.4) |
| Carbohydrate, % of energy | 64.4 (5.6) | 53.9 (4.1) | 43.2 (5.7) | 64.1 (6.1) | 53.8 (4.2) | 41.1 (6.2) |
| Cereal fiber intake, g/day | 6.7 (3.3) | 6.3 (2.9) | 5.2 (2.7) | 9.5 (4.1) | 8.5 (3.7) | 6.0 (2.5) |
| Alcohol intake, g/day | 3.7 (7.5) | 4.6 (9.3) | 3.6 (7.2) | 8.1 (12.3) | 9.4 (12.8) | 8.9 (11.4) |
| Folate intake, μg/day | 515 (282) | 498 (262) | 450 (269) | 787 (421) | 721 (370) | 631 (395) |
| Chicken/turkey, servings/day | 0.3 (0.2) | 0.4 (0.2) | 0.4 (0.2) | 0.4 (0.2) | 0.4 (0.2) | 0.4 (0.3) |
| Total fish, servings/day | 0.2 (0.2) | 0.3 (0.2) | 0.3 (0.2) | 0.3 (0.2) | 0.4 (0.3) | 0.3 (0.2) |
| Total fruit, servings/day | 2.6 (1.3) | 2.4 (1.2) | 2.0 (1.0) | 3.2 (1.5) | 2.6 (1.3) | 2.0 (1.2) |
| Total vegetables, servings/day | 2.8 (1.2) | 2.9 (1.2) | 2.8 (1.3) | 3.5 (1.6) | 3.3 (1.4) | 3.0 (1.4) |
| Total red meat, servings/day | 0.8 (0.4) | 1.0 (0.5) | 1.1 (0.6) | 0.7 (0.5) | 1.0 (0.5) | 1.5 (0.8) |
| High‐fat dairy, servings/day | 1.1 (0.9) | 1.2 (0.9) | 1.4 (1.1) | 0.9 (0.8) | 1.1 (1.0) | 1.4 (1.3) |
| Low‐fat dairy, servings/day | 1.1 (0.8) | 1.1 (0.8) | 0.9 (0.8) | 1.1 (0.8) | 1.3 (1.0) | 1.1 (1.0) |
Values are means (SD) or percentages and are standardized to the age distribution of the study population. Body mass index is calculated as weight in kilograms divided by the square of height in meters. CABG indicates coronary artery bypass grafting; LCDS, low‐carbohydrate diet score; MET, metabolic equivalent task; MI, myocardial infarction; n/a, not available; PMH, postmenopausal hormone use; Q, quintile.
Baseline diet and lifestyle factors are taken from participants' first post‐MI questionnaire.
Pre‐MI diet is taken from participants' most recent food frequency questionnaire before initial MI onset.
Change of diet from pre‐ to post‐MI periods is calculated as: change=(post‐MI diet−pre‐MI diet).
Age is not age standardized.
LCDS Post‐MI Analyses
A greater total LCDS was associated with higher all‐cause mortality for women but not for men after adjustment for time since MI onset, age at diagnosis, and calendar year (Table 2). A test for trend across increasing quintiles of LCDS for women was attenuated but remained significant after multivariate adjustment (hazard ratio [HR] 1.31, 95% CI 0.99 to 1.73; Ptrend=0.02, comparing extreme quintiles). The pooled multivariate HR for total LCDS was 1.13 (95% CI 0.91 to 1.40; P=0.10 for heterogeneity, fifth versus first quintile). A higher animal‐based LCDS was associated with increased all‐cause mortality (pooled HR 1.33, 95% CI 1.06 to 1.65), but a higher plant‐based LCDS was not (pooled HR 0.95, 95% CI 0.77 to 1.18 comparing fifth and first quintiles) (Table 2).
Table 2.
Multivariate Adjusted Hazard Ratios for All‐Cause and Cardiovascular Mortality According to Post‐MI Low‐Carbohydrate Diet Score After Initial MI
| Q1 | Q2 | Q3 | Q4 | Q5 | P trend | |
|---|---|---|---|---|---|---|
| All‐cause mortality | ||||||
| Total LCDS | ||||||
| Women (n=682) | ||||||
| Median score | 4 | 9 | 13 | 18 | 23 | |
| Cases per person‐year | 113/3855 | 139/4861 | 145/4273 | 143/4122 | 142/3909 | |
| Basic model‐adjusted HR (95% CI)* | 1.00 | 1.03 (0.80 to 1.33) | 1.34 (1.04 to 1.73) | 1.33 (1.03 to 1.72) | 1.61 (1.24 to 2.08) | <0.0001 |
| Multivariate‐adjusted HR (95% CI)* | 1.00 | 1.06 (0.81 to 1.38) | 1.36 (1.04 to 1.77) | 1.31 (1.00 to 1.72) | 1.31 (0.99 to 1.73) | 0.02 |
| Men (n=451) | ||||||
| Median score | 4 | 9 | 12 | 17 | 24 | |
| Cases per person‐year | 93/3434 | 63/2580 | 88/3242 | 121/3920 | 86/2893 | |
| Basic model‐adjusted HR (95% CI)* | 1.00 | 0.88 (0.63 to 1.23) | 0.96 (0.71 to 1.3) | 1.15 (0.87 to 1.52) | 1.16 (0.85 to 1.57) | 0.12 |
| Multivariate‐adjusted HR (95% CI)* | 1.00 | 1.03 (0.73 to 1.47) | 0.96 (0.70 to 1.33) | 1.23 (0.91 to 1.66) | 0.90 (0.64 to 1.27) | 0.94 |
| Pooled | ||||||
| Multivariate‐adjusted HR (95% CI) | 1.00 | 1.05 (0.85 to 1.30) | 1.18 (0.96 to 1.45) | 1.27 (1.04 to 1.56) | 1.13 (0.91 to 1.40)* | 0.27 |
| Plant‐based LCDS | ||||||
| Women (n=682) | ||||||
| Median score | 7 | 11 | 14 | 17 | 22 | |
| Cases per person‐year | 151/4214 | 144/4226 | 147/4294 | 129/4477 | 110/3778 | |
| Basic model‐adjusted HR (95% CI)* | 1.00 | 1.01 (0.80 to 1.28) | 0.98 (0.78 to 1.24) | 0.83 (0.65 to 1.06) | 0.89 (0.69 to 1.15) | 0.15 |
| Multivariate‐adjusted HR (95% CI)* | 1.00 | 1.04 (0.82 to 1.33) | 1.06 (0.83 to 1.36) | 0.93 (0.72 to 1.20) | 1.04 (0.79 to 1.37) | 0.93 |
| Men (n=451) | ||||||
| Median score | 7 | 11 | 14 | 17 | 21 | |
| Cases per person‐year | 100/3100 | 103/3428 | 99/3271 | 67/2842 | 82/3428 | |
| Basic model‐adjusted HR (95% CI)* | 1.00 | 0.94 (0.70 to 1.25) | 0.96 (0.72 to 1.29) | 0.82 (0.60 to 1.13) | 0.84 (0.62 to 1.13) | 0.18 |
| Multivariate‐adjusted HR (95% CI)* | 1.00 | 0.93 (0.69 to 1.26) | 0.92 (0.67 to 1.25) | 0.84 (0.60 to 1.19) | 0.85 (0.61 to 1.18) | 0.28 |
| Pooled | ||||||
| Multivariate‐adjusted HR (95% CI) | 1.00 | 1.01 (0.83 to 1.22) | 1.00 (0.83 to 1.22) | 0.91 (0.74 to 1.12) | 0.95 (0.77 to 1.18)* | 0.70 |
| Animal‐based LCDS | ||||||
| Women (n=682) | ||||||
| Median score | 3 | 8 | 13 | 18 | 25 | |
| Cases per person‐year | 115/3813 | 109/4370 | 142/4386 | 166/4470 | 149/3951 | |
| Basic model‐adjusted HR (95% CI)* | 1.00 | 0.91 (0.69 to 1.19) | 1.25 (0.97 to 1.62) | 1.52 (1.18 to 1.95) | 1.57 (1.21 to 2.03) | <0.0001 |
| Multivariate‐adjusted HR (95% CI)* | 1.00 | 0.91 (0.68 to 1.20) | 1.31 (1.00 to 1.72) | 1.50 (1.15 to 1.96) | 1.33 (1.01 to 1.77) | 0.001 |
| Men (n=451) | ||||||
| Median score | 2 | 8 | 13 | 18 | 24 | |
| Cases per person‐year | 69/3055 | 90/3313 | 86/3491 | 100/2959 | 106/3250 | |
| Basic model‐adjusted HR (95% CI)* | 1.00 | 1.10 (0.80 to 1.53) | 1.00 (0.72 to 1.39) | 1.35 (0.99 to 1.85) | 1.48 (1.08 to 2.02) | 0.004 |
| Multivariate‐adjusted HR (95% CI)* | 1.00 | 1.44 (1.02 to 2.04) | 1.08 (0.76 to 1.53) | 1.53 (1.08 to 2.15) | 1.27 (0.89 to 1.81) | 0.23 |
| Pooled | ||||||
| Multivariate‐adjusted HR (95% CI) | 1.00 | 1.11 (0.89 to 1.38) | 1.21 (0.98 to 1.51) | 1.51 (1.22 to 1.87) | 1.33 (1.06 to 1.65)* | 0.02 |
| Cardiovascular mortality | ||||||
| Total LCDS | ||||||
| Women (n=336) | ||||||
| Median score | 4 | 9 | 13 | 18 | 23 | |
| Cases per person‐year | 48/3855 | 74/4861 | 67/4273 | 75/4112 | 72/3909 | |
| Basic model‐adjusted HR (95% CI)* | 1.00 | 1.34 (0.93 to 1.95) | 1.57 (1.07 to 2.30) | 1.72 (1.18 to 2.50) | 1.94 (1.33 to 2.83) | 0.33 |
| Multivariate‐adjusted HR (95% CI)* | 1.00 | 1.36 (0.92 to 2.00) | 1.49 (1.00 to 2.22) | 1.72 (1.15 to 2.55) | 1.46 (0.97 to 2.20) | 0.82 |
| Men (n=222) | ||||||
| Median score | 4 | 9 | 12 | 17 | 24 | |
| Cases per person‐year | 48/3434 | 32/2580 | 40/3242 | 58/3920 | 44/2893 | |
| Basic model‐adjusted HR (95% CI)* | 1.00 | 0.89 (0.56 to 1.40) | 0.82 (0.53 to 1.26) | 1.10 (0.74 to 1.62) | 1.17 (0.77 to 1.79) | 0.26 |
| Multivariate‐adjusted HR (95% CI)* | 1.00 | 0.97 (0.59 to 1.58) | 0.75 (0.47 to 1.19) | 1.11 (0.72 to 1.69) | 0.93 (0.58 to 1.50) | 0.91 |
| Pooled | ||||||
| Multivariate‐adjusted HR (95% CI) | 1.00 | 1.20 (0.88 to 1.62) | 1.11 (0.82 to 1.51) | 1.40 (1.05 to 1.88) | 1.21 (0.88 to 1.64)* | 0.23 |
| Plant‐based LCDS | ||||||
| Women (n=336) | ||||||
| Median score | 7 | 11 | 14 | 17 | 22 | |
| Cases per person‐year | 76/4214 | 61/4226 | 77/4294 | 72/4477 | 49/3778 | |
| Basic model‐adjusted HR (95% CI)* | 1.00 | 0.83 (0.59 to 1.18) | 1.05 (0.75 to 1.45) | 0.89 (0.64 to 1.24) | 0.80 (0.55 to 1.15) | 0.33 |
| Multivariate‐adjusted HR (95% CI)* | 1.00 | 0.86 (0.60 to 1.23) | 1.14 (0.81 to 1.61) | 1.03 (0.73 to 1.46) | 0.97 (0.65 to 1.44) | 0.82 |
| Men (n=222) | ||||||
| Median score | 7 | 11 | 14 | 17 | 21 | |
| Cases per person‐year | 50/3100 | 56/3428 | 39/3271 | 33/2842 | 44/3428 | |
| Basic model‐adjusted HR (95% CI)* | 1.00 | 0.97 (0.65 to 1.43) | 0.76 (0.50 to 1.18) | 0.81 (0.51 to 1.27) | 0.87 (0.58 to 1.33) | 0.37 |
| Multivariate‐adjusted HR (95% CI)* | 1.00 | 0.93 (0.61 to 1.42) | 0.71 (0.45 to 1.12) | 0.74 (0.45 to 1.21) | 0.86 (0.54 to 1.38) | 0.36 |
| Pooled | ||||||
| Multivariate‐adjusted HR (95% CI) | 1.00 | 0.90 (0.68 to 1.18) | 0.96 (0.73 to 1.26) | 0.93 (0.70 to 1.23) | 0.92 (0.68 to 1.25)* | 0.59 |
| Animal‐based LCDS | ||||||
| Women (n=336) | ||||||
| Median score | 3 | 8 | 13 | 18 | 25 | |
| Cases per person‐year | 49/3813 | 49/4370 | 72/4386 | 89/4470 | 76/3951 | |
| Basic model‐adjusted HR (95% CI)* | 1.00 | 0.97 (0.64 to 1.45) | 1.50 (1.03 to 2.18) | 1.89 (1.32 to 2.73) | 1.84 (1.26 to 2.67) | <0.0001 |
| Multivariate‐adjusted HR (95% CI)* | 1.00 | 0.98 (0.64 to 1.50) | 1.59 (1.06 to 2.36) | 1.93 (1.31 to 2.85) | 1.55 (1.03 to 2.33) | 0.002 |
| Men (n=222) | ||||||
| Median score | 2 | 8 | 13 | 18 | 24 | |
| Cases per person‐year | 33/3055 | 46/3313 | 46/3491 | 49/2959 | 48/3250 | |
| Basic model‐adjusted HR (95% CI)* | 1.00 | 1.28 (0.81 to 2.03) | 1.14 (0.72 to 1.81) | 1.48 (0.94 to 2.32) | 1.52 (0.96 to 2.40) | 0.06 |
| Multivariate‐adjusted HR (95% CI)* | 1.00 | 1.67 (1.02 to 2.71) | 1.23 (0.75 to 2.01) | 1.74 (1.06 to 2.85) | 1.40 (0.83 to 2.36) | 0.25 |
| Pooled | ||||||
| Multivariate‐adjusted HR (95% CI) | 1.00 | 1.24 (0.90 to 1.70) | 1.42 (1.04 to 1.94) | 1.87 (1.38 to 2.53) | 1.51 (1.09 to 2.07)* | 0.02 |
CABG indicates coronary artery bypass grafting; CI, confidence interval; HR, hazard ratio; LCDS, low‐carbohydrate diet score; MI, myocardial infarction; Q, quintile.
Adjusted for time since MI onset, age at diagnosis (continuous), calendar year (questionnaire cycle, continuous, 2‐year period).
Additionally adjusted for: total caloric intake (quintiles of kilocalories), physical activity (simple updated, quintiles of metabolic equivalents per week), aspirin use (yes or no), diabetes (yes or no), high blood pressure (yes or no), lipid‐lowering medication use (yes or no), alcohol consumption (0 g/day, 0.1 to 9.9 g/day, 10 to 29.9 g/day, or ≥30 g/day), currently married (yes or no), body mass index (<21, 21 to 22.9, 23 to 24.9, 25 to 27.4, 27.5 to 29.9, >30 kg/m2), CABG (yes or no), and pre‐MI score (quintiles). For women, additionally adjusted for postmenopausal hormone use status (premenopause, postmenopausal hormone never user, postmenopausal hormone current user, postmenopausal hormone past user), and smoking (never smoker or missing, past smoker, current smoker 1 to 14 cigarettes per day, current smoker 15 to 24 cigarettes per day, current smoker ≥25 cigarettes per day). For men, additionally adjusted for heart failure (yes or no), left ventricular ejection fraction (≥40%, <40%, or missing), acute therapy during hospitalization (received either angioplasty or thrombolytics, or none), and smoking (never smoker or missing, past smoker, current smoker <15 cigarettes per day, current smoker ≥15 cigarettes per day).
Pheterogeneity=0.10.
Pheterogeneity=0.36.
Pheterogeneity=0.84.
Pheterogeneity=0.16.
Pheterogeneity=0.70.
Pheterogeneity=0.09.
The higher animal‐based LCDS was associated with higher cardiovascular mortality (pooled HR 1.51, 95% CI 1.09 to 2.07, comparing extreme quintiles), but the plant‐based LCDS was not (Table 2). Substituting 10% energy of animal‐based foods with plant‐based food was associated, albeit not significantly, with lower risk for all‐cause and cardiovascular mortality (pooled HR 0.91, 95% CI 0.81 to 1.03 for all‐cause mortality; pooled HR 0.87, 95% CI 0.73 to 1.04 for cardiovascular mortality).
Changes in LCDS From Pre‐ to Post‐MI Analyses
In women, an increase in total LCDS was associated with a trend toward increased risk of all‐cause mortality (HR 1.35, 95% CI 0.99 to 1.84; Ptrend=0.01) (Table 3). In particular, a greater increase in the animal‐based LCDS was associated with higher all‐cause and cardiovascular mortality in women (HR 1.62, 95% CI 1.19 to 2.20 for all‐cause mortality; HR 1.97, 95% CI 1.29 to 3.03 for cardiovascular mortality). No significant associations in LCDS dietary change and mortality were observed in men. After pooling the results from women and men, the pooled HR for animal‐based LCDS was 1.30 (95% CI 1.03 to 1.65) for all‐cause mortality and 1.53 (95% CI 1.10 to 2.13) for cardiovascular mortality, comparing extreme quintiles (Table 3).
Table 3.
Multivariate Adjusted Hazard Ratios for All‐Cause and Cardiovascular Mortality According to Changes of Low‐Carbohydrate Diet Score From Pre‐ to Post‐MI Periods After Initial MI
| Q1 | Q2 | Q3 | Q4 | Q5 | P Trend | |
|---|---|---|---|---|---|---|
| All‐cause mortality | ||||||
| Total LCDS | ||||||
| Women (n=682) | ||||||
| Median score | −12 | −6 | −1 | 3 | 9 | |
| Cases per person‐year | 137/4361 | 128/4300 | 130/4278 | 157/4092 | 130/3980 | |
| Basic model‐adjusted HR (95% CI)* | 1.00 | 1.06 (0.82 to 1.35) | 1.12 (0.88 to 1.43) | 1.30 (1.03 to 1.65) | 1.11 (0.87 to 1.43) | 0.13 |
| Multivariate‐adjusted HR (95% CI)* | 1.00 | 1.14 (0.88 to 1.48) | 1.32 (1.01 to 1.74) | 1.55 (1.18 to 2.04) | 1.35 (0.99 to 1.84) | 0.01 |
| Men (n=451) | ||||||
| Median score | −12 | −6 | −2 | 2 | 8 | |
| Cases per person‐year | 93/3434 | 63/2580 | 88/3242 | 121/3920 | 86/2893 | |
| Basic model‐adjusted HR (95% CI)* | 1.00 | 1.06 (0.78 to 1.45) | 0.78 (0.58 to 1.05) | 0.89 (0.66 to 1.19) | 0.99 (0.73 to 1.34) | 0.62 |
| Multivariate‐adjusted HR (95% CI)* | 1.00 | 1.28 (0.92 to 1.78) | 0.85 (0.61 to 1.19) | 0.99 (0.71 to 1.39) | 0.94 (0.65 to 1.36) | 0.52 |
| Pooled | ||||||
| Multivariate‐adjusted HR (95% CI) | 1.00 | 1.19 (0.97 to 1.46) | 1.10 (0.90 to 1.37) | 1.30 (1.05 to 1.61) | 1.16 (0.92 to 1.48)* | 0.23 |
| Plant‐based LCDS | ||||||
| Women (n=682) | ||||||
| Median score | −8 | −4 | −1 | 2 | 7 | |
| Cases per person‐year | 170/4418 | 107/3380 | 148/4992 | 136/4279 | 120/3921 | |
| Basic model‐adjusted HR (95% CI)* | 1.00 | 0.91 (0.71 to 1.17) | 0.89 (0.71 to 1.12) | 0.93 (0.74 to 1.18) | 0.90 (0.71 to 1.15) | 0.41 |
| Multivariate‐adjusted HR (95% CI)* | 1.00 | 0.93 (0.71 to 1.21) | 0.90 (0.70 to 1.16) | 1.02 (0.79 to 1.32) | 1.10 (0.82 to 1.47) | 0.50 |
| Men (n=451) | ||||||
| Median score | −8 | −4 | −1 | 2 | 6 | |
| Cases per person‐year | 100/3100 | 103/3428 | 99/3271 | 67/2842 | 82/3428 | |
| Basic model‐adjusted HR (95% CI)* | 1.00 | 1.06 (0.78 to 1.43) | 0.93 (0.69 to 1.24) | 1.26 (0.94 to 1.70) | 0.96 (0.71 to 1.30) | 0.83 |
| Multivariate‐adjusted HR (95% CI)* | 1.00 | 1.13 (0.82 to 1.57) | 0.89 (0.64 to 1.23) | 1.25 (0.89 to 1.75) | 0.84 (0.59 to 1.20) | 0.51 |
| Pooled | ||||||
| Multivariate‐adjusted HR (95% CI) | 1.00 | 1.01 (0.82 to 1.23) | 0.86 (0.70 to 1.05) | 1.09 (0.89 to 1.35) | 0.98 (0.78 to 1.23)* | 0.93 |
| Animal‐based LCDS | ||||||
| Women (n=682) | ||||||
| Median score | −14 | −6 | −1 | 3 | 10 | |
| Cases per person‐year | 128/3974 | 127/4468 | 146/4751 | 141/3828 | 139/3969 | |
| Basic model‐adjusted HR (95% CI)* | 1.00 | 0.97 (0.75 to 1.25) | 1.03 (0.80 to 1.32) | 1.24 (0.97 to 1.58) | 1.14 (0.89 to 1.47) | 0.10 |
| Multivariate‐adjusted HR (95% CI)* | 1.00 | 1.18 (0.90 to 1.55) | 1.26 (0.95 to 1.66) | 1.54 (1.16 to 2.04) | 1.62 (1.19 to 2.20) | 0.0005 |
| Men (n=451) | ||||||
| Median score | −14 | −7 | −3 | 2 | 9 | |
| Cases per person‐year | 69/3055 | 90/3313 | 86/3491 | 100/2959 | 106/3250 | |
| Basic model‐adjusted HR (95% CI)* | 1.00 | 0.80 (0.58 to 1.10) | 0.95 (0.71 to 1.29) | 0.93 (0.69 to 1.26) | 0.96 (0.71 to 1.29) | 0.91 |
| Multivariate‐adjusted HR (95% CI)* | 1.00 | 0.96 (0.68 to 1.34) | 1.10 (0.79 to 1.53) | 1.06 (0.75 to 1.49) | 0.95 (0.66 to 1.37) | 0.89 |
| Pooled | ||||||
| Multivariate‐adjusted HR (95% CI) | 1.00 | 1.09 (0.88 to 1.35) | 1.19 (0.96 to 1.47) | 1.32 (1.07 to 1.64) | 1.30 (1.03 to 1.65)* | 0.03 |
| Cardiovascular mortality | ||||||
| Total LCDS | ||||||
| Women (n=336) | ||||||
| Median score | −12 | −6 | −1 | 3 | 9 | |
| Cases per person‐year | 64/4361 | 65/4300 | 68/4278 | 70/4092 | 69/3980 | |
| Basic model‐adjusted HR (95% CI)* | 1.00 | 1.23 (0.86 to 1.75) | 1.35 (0.95 to 1.91) | 1.37 (0.96 to 1.94) | 1.32 (0.93 to 1.87) | 0.09 |
| Multivariate‐adjusted HR (95% CI)* | 1.00 | 1.37 (0.94 to 1.99) | 1.65 (1.12 to 2.45) | 1.55 (1.04 to 2.32) | 1.53 (0.99 to 2.38) | 0.05 |
| Men (n=224) | ||||||
| Median score | −12 | −6 | −2 | 2 | 8 | |
| Cases per person‐year | 48/3434 | 32/2580 | 40/3242 | 58/3920 | 44/2893 | |
| Basic model‐adjusted HR (95% CI)* | 1.00 | 1.29 (0.84 to 2.00) | 0.99 (0.64 to 1.51) | 0.93 (0.61 to 1.43) | 1.06 (0.68 to 1.64) | 0.76 |
| Multivariate‐adjusted HR (95% CI)* | 1.00 | 1.58 (0.99 to 2.52) | 1.06 (0.66 to 1.73) | 1.03 (0.62 to 1.68) | 0.91 (0.53 to 1.57) | 0.41 |
| Pooled | ||||||
| Multivariate‐adjusted HR (95% CI) | 1.00 | 1.46 (1.08 to 1.94) | 1.39 (1.02 to 1.88) | 1.32 (0.96 to 1.80) | 1.25 (0.89 to 1.75)* | 0.19 |
| Plant‐based LCDS | ||||||
| Women (n=336) | ||||||
| Median score | −8 | −4 | −1 | 2 | 7 | |
| Cases per person‐year | 89/4418 | 46/3380 | 69/4992 | 70/4279 | 61/3921 | |
| Basic model‐adjusted HR (95% CI)* | 1.00 | 0.74 (0.51 to 1.06) | 0.84 (0.61 to 1.16) | 0.90 (0.65 to 1.24) | 0.88 (0.63 to 1.24) | 0.67 |
| Multivariate‐adjusted HR (95% CI)* | 1.00 | 0.75 (0.51 to 1.10) | 0.92 (0.64 to 1.31) | 0.98 (0.68 to 1.41) | 1.09 (0.72 to 1.65) | 0.47 |
| Men (n=224) | ||||||
| Median score | −8 | −4 | −1 | 2 | 6 | |
| Cases per person year | 50/3100 | 56/3428 | 39/3271 | 33/2842 | 44/3428 | |
| Basic model‐adjusted HR (95% CI)* | 1.00 | 1.03 (0.68 to 1.57) | 0.94 (0.63 to 1.40) | 1.18 (0.77 to 1.79) | 0.78 (0.50 to 1.21) | 0.45 |
| Multivariate‐adjusted HR (95% CI)* | 1.00 | 1.10 (0.70 to 1.74) | 0.99 (0.62 to 1.56) | 1.28 (0.79 to 2.10) | 0.77 (0.46 to 1.30) | 0.49 |
| Pooled | ||||||
| Multivariate‐adjusted HR (95% CI) | 1.00 | 0.88 (0.66 to 1.19) | 0.95 (0.71 to 1.26) | 1.08 (0.80 to 1.45) | 0.96 (0.69 to 1.32)* | 0.76 |
| Animal‐based LCDS | ||||||
| Women (n=336) | ||||||
| Median score | −14 | −6 | −1 | 3 | 10 | |
| Cases per person‐year | 60/3974 | 61/4468 | 63/4751 | 72/3828 | 79/3969 | |
| Basic model‐adjusted HR (95% CI)* | 1.00 | 1.07 (0.74 to 1.54) | 1.09 (0.76 to 1.57) | 1.45 (1.02 to 2.06) | 1.38 (0.98 to 1.96) | 0.02 |
| Multivariate‐adjusted HR (95% CI)* | 1.00 | 1.31 (0.89 to 1.93) | 1.37 (0.91 to 2.05) | 1.78 (1.20 to 2.65) | 1.97 (1.29 to 3.03) | 0.0006 |
| Men (n=224) | ||||||
| Median score | −8 | −4 | −1 | 2 | 6 | |
| Cases per person‐year | 33/3055 | 46/3313 | 46/3491 | 49/2959 | 48/3250 | |
| Basic model‐adjusted HR (95% CI)* | 1.00 | 1.01 (0.65 to 1.59) | 1.15 (0.74 to 1.78) | 1.02 (0.65 to 1.58) | 1.15 (0.76 to 1.76) | 0.54 |
| Multivariate‐adjusted HR (95% CI)* | 1.00 | 1.14 (0.71 to 1.84) | 1.27 (0.78 to 2.08) | 1.04 (0.63 to 1.72) | 1.03 (0.61 to 1.74) | 0.87 |
| Pooled | ||||||
| Multivariate‐adjusted HR (95% CI) | 1.00 | 1.24 (0.92 to 1.67) | 1.33 (0.98 to 1.81) | 1.45 (1.06 to 1.98) | 1.53 (1.10 to 2.13)* | 0.01 |
CABG indicates coronary artery bypass grafting; CI, confidence interval; HR, hazard ratio; LCDS, low‐carbohydrate diet score; MI, myocardial infarction.
Adjusted for time since MI onset, age at diagnosis (continuous), calendar year (questionnaire cycle, continuous, 2‐year period).
Additionally adjusted for aspirin use (never taker, new taker, always taker), diabetes(no diabetes, new diabetes, always diabetes), high blood pressure (no high blood pressure, new high blood pressure, always high blood pressure), lipid‐lowering medication use (never taker, new taker, always taker), married (never married, always married, not married anymore), CABG (never CABG, always CABG, new CABG), changes in smoking status (always never smoker, always past smokers, always current smoking 1 to 14 cigarettes per day post‐MI period, always current smoking ≥15 cigarettes per day post‐MI period, quit smoking after MI 1 to 14 cigarettes per day pre‐MI period, quit smoking after MI ≥15 cigarettes per day pre‐MI period), and pre‐MI score (quintiles). For women, additionally adjusted for changes in total caloric intake (quintiles of kilocalories), changes in physical activity (quintiles of changes in metabolic equivalents per week), changes in alcohol consumption (quintiles of changes in g/day), changes in body mass index (quintiles of changes in kg/m2), and postmenopausal hormone use status (simple updated, premenopause, postmenopausal hormone never user, postmenopausal hormone current user, postmenopausal hormone past user). For men, additionally adjusted for changes in total caloric intake (tertiles of kilocalories), changes in physical activity (tertiles of changes in metabolic equivalents per week), changes in alcohol consumption (tertiles of changes in g/day), changes in body mass index (tertiles of changes in kg/m2), heart failure (simple updated, yes or no), left ventricular ejection fraction (simple updated, ≥40%, <40%, or missing), and acute therapy during hospitalization (simple updated, received either angioplasty or thrombolytics, or none).
Pheterogeneity=0.13.
Pheterogeneity=0.25.
Pheterogeneity=0.03.
Pheterogeneity=0.16.
Pheterogeneity=0.31.
Pheterogeneity=0.06.
Subgroup Analyses
We did not observe significant effect modification by diabetes status (Pinteraction=0.94 for women and 0.75 for men). Associations between the animal‐based LCD and mortality were attenuated after additionally adjusting for saturated fat (pooled HR 1.21, 95% CI 0.93 to 1.59 for all‐cause mortality; pooled HR 1.45, 95% CI 0.98 to 2.14 for cardiovascular mortality, comparing the highest and lowest quintiles).
A change in the animal‐based LCDS from below to above the median was associated with higher all‐cause mortality (pooled HR 1.28, 95% CI 1.03 to 1.60, fifth versus first quintile) and higher cardiovascular mortality (pooled HR 1.42, 95% CI 1.04 to 1.93, fifth versus first quintile) (Figure), but change in total LCDS or plant‐based LCDS was not (Figure).
Figure 1.
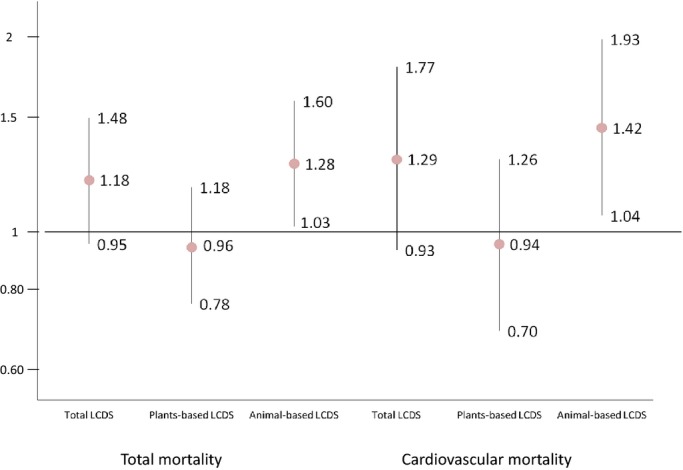
Multivariate adjusted hazard ratios (HRs) for all‐cause and cardiovascular mortality comparing new adherents versus nonadherents (n=1059 for women, with 294 new adherents and 765 nonadherents; n=804 for men, with 216 new adherents and 588 nonadherents). LCDS indicates low‐carbohydrate diet score.
Sensitivity Analyses
Results were similar after using the inverse probability weighting method to account for potential selection bias, with pooled HRs for total mortality of 1.17 (95% CI 0.96 to 1.43) for the total LCDS, 1.14 (95% CI 0.93 to 1.40) for the vegetable‐based LCDS, and 1.30 (95% CI 1.06 to 1.61) for the animal‐based LCDS. In a separate sensitivity analysis, the results were similar when we further excluded FFQs returned within 1 year after MI (data not shown). We did not observe significant violation of the proportional hazards assumption.
Discussion
In our combined prospective cohorts of MI survivors, we found that adherence to an LCD overall was not associated with all‐cause or cardiovascular mortality. There was no benefit from adherence to a plant‐based LCD; however, an animal‐based LCD was associated with higher all‐cause and cardiovascular mortality.
Our results among MI survivors are not completely consistent with our previous results with regard to primary prevention of MI in these same cohorts.16,29 Halton et al found that an LCD was not associated with increased risk of coronary heart disease in women and that a diet low in carbohydrate but high in plant sources of fat and protein moderately reduced coronary heart disease risk.16 Fung et al showed that a plant‐based LCD was associated with lower all‐cause and cardiovascular mortality in our populations that were free of cardiovascular disease at baseline.29 In contrast, among MI survivors, we did not find a reduction in all‐cause or cardiovascular mortality with a plant‐based LCD. This may be due to insufficient power in our post‐MI population, a relatively narrow range of percentages of energy from vegetable protein and fat, or lack of sufficient follow‐up after MI.
The results have also been mixed in other studies of LCDS and primary prevention of cardiovascular disease and mortality.29–32 A high‐protein LCD was associated with higher all‐cause and cardiovascular mortality after 12 years of follow‐up in a Swedish cohort of women.30 In a cohort from Greece, consumption of an LCD was also associated with increased all‐cause mortality after 10 years of follow‐up.31 In a separate Swedish cohort with both men and women, a low high‐protein LCD was not associated with mortality.32 These discrepancies may be due to differences in the underlying degree of hyperglycemia and insulin resistance in the study populations or in the sources of foods represented in the LCDs from these populations.33 It is difficult to compare these results with those from our cohorts because none reported separately on animal or plant sources of fats and proteins.
Even within our own cohorts, the mortality rates associated with an animal‐based LCD may differ depending on the composition of the food sources. The fat consumed from an animal‐based LCD, for example, could be greater in saturated fat from high‐fat dairy or red meat and processed meat or could be higher in eicosapentaenoic acid and docosahexaenoic acid if consumed mainly from fatty fish. We did not have enough high fish consumption to further separate the animal‐based LCDs into LCDs high in red meat or dairy fat or high in fish, although the participants with the highest total LCDSs had greater intake of red meat and high‐fat diary and less consumption of dietary fiber. In a previous study in these same populations, better overall diet quality after MI was associated with substantially lower all‐cause and cardiovascular mortality.34 In our analyses, associations with animal‐based LCDs were attenuated after additionally adjusting for saturated fat intake. This suggests that the higher mortality may be due, in part, to saturated fat intake in the animal‐based LCDs.
We and others have reported an association between glycemic load and elevated risk of diabetes and cardiovascular disease.35–40 One limitation of using the LCDS to assess total carbohydrates is that it cannot differentiate carbohydrate quality. Refined carbohydrates can be digested rapidly and can generate elevated concentrations of blood glucose and insulin demand that may ultimately lead to lipid and inflammation disorders after MI.41–42 In contrast, an LCD could also be low in whole grains and dietary fiber, both of which—when consumed in greater amounts—have been associated with a 20% to 40% lower risk of coronary heart disease in the general population.36,43–44 Results in our study were similar after we additionally adjusted for cereal fiber in the model. The study was underpowered to explore this dimension of carbohydrate quality, but future larger studies of MI survivors should explore the specific attributes of carbohydrates when assessing health risks associated with adherence to an LCD.
Our study has several other limitations. Because of the observational nature of the study, there may be residual or unmeasured confounding that was not captured in our multivariate adjustment. In addition, in the Nurses' Health Study, we did not collect detailed clinical characteristics or treatment during hospitalization and thus could not adjust for these factors in the analyses. For men, the results were similar both with and without adjustment for these characteristics, so this limitation does not seem likely confound our overall associations. In our study we found that the associations with LCD after MI were stronger for women than for men; however, there was no significant heterogeneity between sexes. The discrepancy may be due to the limited number of events in the extreme quintiles; the greater case‐fatality rate among women; or the differences in MI pathophysiology, clinical presentation, initial management, and prognosis.45 Future studies are needed to investigate this. The case‐fatality rate in our cohorts may be different from other MI‐survivor populations because our participants were all health professionals and may have had better access to acute care. Nonetheless, it is unlikely that the underlying biology associated with an LCD would differ dramatically, regardless of survivorship differences.
We acknowledge a degree of measurement error associated with using the FFQ to assess average diet. Previous validation studies in our cohorts have shown that the self‐reported FFQ is valid and reliable for measuring average dietary intake.19–20,46 Although the FFQ was validated among healthy participants, it is unlikely to be substantially different among post‐MI populations. If anything, bias in assessment of an LCDS is likely to be random because of the prospective nature of the study and thus would bias our results toward the null. The LCDS was originally developed in our cohorts and has not been formally validated; however, estimated micro‐ and macronutrient intakes in our cohorts have been validated.
The dietary LCDS calculated from the FFQ was limited to participants who had at least 1 pre‐ and post‐MI dietary assessment. The participants who died before the return of the first post‐MI FFQ or who had all post‐MI FFQs missing were not included in the study. If participants who were most susceptible to the detrimental (or beneficial) effects of an LCD died, this could potentially introduce a survival bias, which would likely attenuate any true association towards the null; however, the results were similar after using inverse probability weighting to account for this potential survival bias. Another limitation of our study is that we do not have biomarker information on the whole population and thus could not evaluate the specific biological mechanisms responsible for any potential risk reduction.
In our prospective study evaluating the long‐term association between adherence to an LCD and mortality among MI survivors, we provided the first evidence that, overall, an LCD after MI was not associated with all‐cause or cardiovascular mortality. We did not find a benefit for better adherence to a plant‐based LCD; however, adherence to an LCD high in animal sources of fat and protein was associated with higher all‐cause and cardiovascular mortality. MI patients who intend to follow an LCD should avoid consuming mainly animal sources of fat and protein.
Acknowledgment
We thank Lydia Liu, Dr Donna Spiegelman, Ellen Hertzmark, and Molin Wang for their help with programming for this study. We thank staff and participants in the Nurses' Health Study and the Health Professional Follow‐up Study. Li, Rimm, Hu, Willett, and Mukamal designed the study. Rimm, Hu, Willett, and Mukamal developed the overall research plan and provided statistical expertise. Li performed statistical analysis and wrote the first draft of the manuscript. All authors contributed to the interpretation of the results and critical revision of the manuscript for important intellectual content. All authors read and approved the final manuscript.
Sources of Funding
This study was supported by National Institutes of Health grants AA11181, HL35464, HL34594, HL60712, CA55075, CA87969, and CA055075.
Disclosures
None.
References
- 1.Boyer NM, Laskey WK, Cox M, Hernandez AF, Peterson ED, Bhatt DL, Cannon CP, Fonarow GC. Trends in clinical, demographic, and biochemical characteristics of patients with acute myocardial infarction from 2003 to 2008: a report from the American Heart Association get with the guidelines coronary artery disease program. J Am Heart Assoc. 2012; 1:e00120610.1161/JAHA.112.001206 [DOI] [PMC free article] [PubMed] [Google Scholar]
- 2.Kuczmarski RJ, Flegal KM, Campbell SM, Johnson CL. Increasing prevalence ofoverweight among US adults. The National Health and Nutrition Examination Surveys, 1960 to 1991. JAMA. 1994; 272:205-211. [DOI] [PubMed] [Google Scholar]
- 3.Austin GL, Ogden LG, Hill JO. Trends in carbohydrate, fat, and protein intakes and association with energy intake in normal‐weight, overweight, and obese individuals: 1971–2006. Am J Clin Nutr. 2011; 93:836-843. [DOI] [PubMed] [Google Scholar]
- 4.Norgaard ML, Andersson C, Hansen PR, Andersen SS, Vaag A, Schramm TK, Folke F, Køber L, Torp‐Pedersen C, Gislason GH. Temporal trends in the initiation of glucose‐lowering medications after a first‐time myocardial infarction—a nationwide study between 1997 and 2006. Cardiovasc Diabetol. 2011; 10:510.1186/1475‐2840‐10‐5 [DOI] [PMC free article] [PubMed] [Google Scholar]
- 5.Antman EM, Anbe DT, Armstrong PW, Bates ER, Green LA, Hand M, Hochman JS, Krumholz HM, Kushner FG, Lamas GA, Mullany CJ, Ornato JP, Pearle DL, Sloan MA, Smith SC, Jr, Alpert JS, Anderson JL, Faxon DP, Fuster V, Gibbons RJ, Gregoratos G, Halperin JL, Hiratzka LF, Hunt SA, Jacobs AK, Ornato JP. ACC/AHA guidelines for the management of patients with ST‐elevation myocardial infarction; A report of the American College of Cardiology/American Heart Association Task Force on Practice Guidelines (Committee to Revise the 1999 Guidelines for the Management of patients with acute myocardial infarction). J Am Coll Cardiol. 2004; 44:E1-E211. [DOI] [PubMed] [Google Scholar]
- 6.Antman EM, Hand M, Armstrong PW, Bates ER, Green LA, Halasyamani LK, Hochman JS, Krumholz HM, Lamas GA, Mullany CJ, Pearle DL, Sloan MA, Smith SC, Jr2004 Writing Committee Members.Anbe DT, Kushner FG, Ornato JP, Jacobs AK, Adams CD, Anderson JL, Buller CE, Creager MA, Ettinger SM, Halperin JL, Hunt SA, Lytle BW, Nishimura R, Page RL, Riegel B, Tarkington LG, Yancy CW. 2007 Focused Update of the ACC/AHA 2004 Guidelines for the Management of Patients With ST‐Elevation Myocardial Infarction: a report of the American College of Cardiology/American Heart Association Task Force on Practice Guidelines: developed in collaboration With the Canadian Cardiovascular Society endorsed by the American Academy of Family Physicians: 2007 Writing Group to Review New Evidence and Update the ACC/AHA 2004 Guidelines for the Management of Patients With ST‐Elevation Myocardial Infarction, Writing on Behalf of the 2004 Writing Committee. Circulation. 2008; 117:296-329. [DOI] [PubMed] [Google Scholar]
- 7.Artinian NT, Fletcher GF, Mozaffarian D, Kris‐Etherton P, Van Horn L, Lichtenstein AH, Kumanyika S, Kraus WE, Fleg JL, Redeker NS, Meininger JC, Banks J, Stuart‐Shor EM, Fletcher BJ, Miller TD, Hughes S, Braun LT, Kopin LA, Berra K, Hayman LL, Ewing LJ, Ades PA, Durstine JL, Houston‐Miller N, Burke LEAmerican Heart Association Prevention Committee of the Council on Cardiovascular Nursing. Interventions to promote physical activity and dietary lifestyle changes for cardiovascular risk factor reduction in adults: a scientific statement from the American Heart Association. Circulation. 2010; 122:406-441. [DOI] [PMC free article] [PubMed] [Google Scholar]
- 8.Scrutinio D. The potential of lifestyle changes for improving the clinical outcome of patients with coronary heart disease: mechanisms of benefit and clinical results. Rev Recent Clin Trials. 2010; 5:1-13. [DOI] [PubMed] [Google Scholar]
- 9.Ebbeling CB, Swain JF, Feldman HA, Wong WW, Hachey DL, Garcia‐Lago E, Ludwig DS. Effects of dietary composition on energy expenditure during weight‐loss maintenance. JAMA. 2012; 307:2627-2634. [DOI] [PMC free article] [PubMed] [Google Scholar]
- 10.Appel LJ, Sacks FM, Carey VJ, Obarzanek E, Swain JF, Miller ER 3rd, Conlin PR, Erlinger TP, Rosner BA, Laranjo NM, Charleston J, McCarron P, Bishop LMOmniHeart Collaborative Research Group. Effects of protein, monounsaturated fat, and carbohydrate intake on blood pressure and serum lipids: results of the OmniHeart randomized trial. JAMA. 2005; 294:2455-2464. [DOI] [PubMed] [Google Scholar]
- 11.Sacks FM, Katan M. Randomized clinical trials on the effects of dietary fat and carbohydrate on plasma lipoproteins and cardiovascular disease. Am J Med. 2002; 113suppl 9B:13S-24S. [DOI] [PubMed] [Google Scholar]
- 12.Shai I, Schwarzfuchs D, Henkin Y, Shahar DR, Witkow S, Greenberg I, Golan R, Fraser D, Bolotin A, Vardi H, Tangi‐Rozental O, Zuk‐Ramot R, Sarusi B, Brickner D, Schwartz Z, Sheiner E, Marko R, Katorza E, Thiery J, Fiedler GM, Blüher M, Stumvoll M, Stampfer MJDietary Intervention Randomized Controlled Trial (DIRECT) Group. Weight loss with a low‐carbohydrate, Mediterranean, or low‐fat diet. N Engl J Med. 2008; 359:229-241. [DOI] [PubMed] [Google Scholar]
- 13.Kodama S, Saito K, Tanaka S, Maki M, Yachi Y, Sato M, Sugawara A, Totsuka K, Shimano H, Ohashi Y, Yamada N, Sone H. Influence of fat and carbohydrate proportions on the metabolic profile in patients with type 2 diabetes: a meta‐analysis. Diabetes Care. 2009; 32:959-965. [DOI] [PMC free article] [PubMed] [Google Scholar]
- 14.Kirk JK, Graves DE, Craven TE, Lipkin EW, Austin M, Margolis KL. Restricted‐carbohydrate diets in patients with type 2 diabetes: a meta‐analysis. J Am Diet Assoc. 2008; 108:91-100. [DOI] [PubMed] [Google Scholar]
- 15.Hite AH, Berkowitz VG, Berkowitz K. Low‐carbohydrate diet review: shifting the paradigm. Nutr Clin Pract. 2011; 26:300-308. [DOI] [PubMed] [Google Scholar]
- 16.Halton TL, Willett WC, Liu S, Manson JE, Albert CM, Rexrode K, Hu FB. Low‐carbohydrate‐diet score and the risk of coronary heart disease in women. N Engl J Med. 2006; 355:1991-2002. [DOI] [PubMed] [Google Scholar]
- 17.Willett WC, Green A, Stampfer MJ, Speizer FE, Colditz GA, Rosner B, Monson RR, Stason W, Hennekens CH. Relative and absolute excess risks of coronary heart disease among women who smoke cigarettes. N Engl J Med. 1987; 317:1303-1309. [DOI] [PubMed] [Google Scholar]
- 18.Colditz GA, Rimm EB, Giovannucci E, Stampfer MJ, Rosner B, Willett WC. A prospective study of parental history of myocardial infarction and coronary artery disease in men. Am J Cardiol. 1991; 67:933-938. [DOI] [PubMed] [Google Scholar]
- 19.Rimm EB, Giovannucci EL, Stampfer MJ, Colditz GA, Litin LB, Willett WC. Reproducibility and validity of an expanded self‐administered semiquantitative food frequency questionnaire among male health professionals. Am J Epidemiol. 1992; 135:1114-1126. [DOI] [PubMed] [Google Scholar]
- 20.Feskanich D, Rimm EB, Giovannucci EL, Colditz GA, Stampfer MJ, Litin LB, Willett WC. Reproducibility and validity of food intake measurements from a semiquantitative food frequency questionnaire. J Am Diet Assoc. 1993; 93:790-796. [DOI] [PubMed] [Google Scholar]
- 21.Willett WC, Sampson L, Stampfer MJ, Rosner B, Bain C, Witschi J, Hennekens CH, Speizer FE. Reproducibility and validity of a semiquantitative food frequency questionnaire. Am J Epidemiol. 1985; 122:51-65. [DOI] [PubMed] [Google Scholar]
- 22.Mendis S, Thygesen K, Kuulasmaa K, Giampaoli S, Mähönen M, Ngu Blackett K, Lisheng LWriting group on behalf of the participating experts of the WHO consultation for revision of WHO definition of myocardial infarction. World Health Organization definition of myocardial infarction: 2008‐09 revision. Int J Epidemiol. 2011; 40:139-146. [DOI] [PubMed] [Google Scholar]
- 23.Luepker RV, Apple FS, Christenson RH, Crow RS, Fortmann SP, Goff D, Goldberg RJ, Hand MM, Jaffe AS, Julian DG, Levy D, Manolio T, Mendis S, Mensah G, Pajak A, Prineas RJ, Reddy KS, Roger VL, Rosamond WD, Shahar E, Sharrett AR, Sorlie P, Tunstall‐Pedoe HAHA Council on Epidemiology and Prevention; AHA Statistics Committee; World Heart Federation Council on Epidemiology and Prevention; European Society of Cardiology Working Group on Epidemiology and Prevention; Centers for Disease Control and Prevention; National Heart, Lung, and Blood Institute. Case definitions for acute coronary heart disease in epidemiology and clinical research studies: a statement from the AHA Council on Epidemiology and Prevention; AHA Statistics Committee; World Heart Federation Council on Epidemiology and Prevention; the European Society of Cardiology Working Group on Epidemiology and Prevention; Centers for Disease Control and Prevention; and the National Heart, Lung, and Blood Institute. Circulation. 2003; 108:2543-2549. [DOI] [PubMed] [Google Scholar]
- 24.Rich‐Edwards JW, Corsano KA, Stampfer MJ. Test of the National Death Index and Equifax Nationwide Death Search. Am J Epidemiol. 1994; 140:1016-1019. [DOI] [PubMed] [Google Scholar]
- 25.Higgins JP, Thompson SG. Quantifying heterogeneity in a meta‐analysis. Stat Med. 2002; 21:1539-1558. [DOI] [PubMed] [Google Scholar]
- 26.Higgins JP, Thompson SG, Deeks JJ, Altman DG. Measuring inconsistency in meta‐analyses. BMJ. 2003; 327:557-560. [DOI] [PMC free article] [PubMed] [Google Scholar]
- 27.DerSimonian R, Laird N. Meta‐analysis in clinical trials. Control Clin Trials. 1986; 7:177-188. [DOI] [PubMed] [Google Scholar]
- 28.Cole SR, Hernán MA. Constructing inverse probability weights for marginal structural models. Am J Epidemiol. 2008; 168:656-664. [DOI] [PMC free article] [PubMed] [Google Scholar]
- 29.Fung TT, van Dam RM, Hankinson SE, Stampfer M, Willett WC, Hu FB. Low‐carbohydrate diets and all‐cause and cause‐specific mortality: two cohort studies. Ann Intern Med. 2010; 153:289-298. [DOI] [PMC free article] [PubMed] [Google Scholar]
- 30.Lagiou P, Sandin S, Weiderpass E, Lagiou A, Mucci L, Trichopoulos D, Adami HO. Low carbohydrate‐high protein diet and mortality in a cohort of Swedish women. J Intern Med. 2007; 261:366-374. [DOI] [PubMed] [Google Scholar]
- 31.Trichopoulou A, Psaltopoulou T, Orfanos P, Hsieh CC, Trichopoulos D. Low‐carbohydrate‐high‐protein diet and long‐term survival in a general population cohort. Eur J Clin Nutr. 2007; 61:575-581. [DOI] [PubMed] [Google Scholar]
- 32.Nilsson LM, Winkvist A, Eliasson M, Jansson JH, Hallmans G, Johansson I, Lindahl B, Lenner P, Van Guelpen B. Low‐carbohydrate, high‐protein score and mortality in a northern Swedish population‐based cohort. Eur J Clin Nutr. 2012; 66:694-700. [DOI] [PubMed] [Google Scholar]
- 33.Willett WC. Low‐carbohydrate diets: a place in health promotion? J Intern Med. 2007; 261:363-365. [DOI] [PubMed] [Google Scholar]
- 34.Li S, Chiuve SE, Flint A, Pai JK, Forman JP, Hu FB, Willett WC, Mukamal KJ, Rimm EB. Better diet quality and decreased mortality among myocardial infarction survivors. JAMA Intern Med. 2013; 173:1808-1818. [DOI] [PMC free article] [PubMed] [Google Scholar]
- 35.Liu S, Buring JE, Sesso HD, Rimm EB, Willett WC, Manson JE. A prospective study of dietary fiber intake and risk of cardiovascular disease among women. J Am Coll Cardiol. 2002; 39:49-56. [DOI] [PubMed] [Google Scholar]
- 36.Liu S, Stampfer MJ, Hu FB, Giovannucci E, Rimm E, Manson JE, Hennekens CH, Willett WC. Whole‐grain consumption and risk of coronary heart disease: results from the Nurses' Health Study. Am J Clin Nutr. 1999; 70:412-419. [DOI] [PubMed] [Google Scholar]
- 37.Liu S, Willett WC. Dietary glycemic load and atherothrombotic risk. Curr Atheroscler Rep. 2002; 4:454-461. [DOI] [PubMed] [Google Scholar]
- 38.Liu S, Willett WC, Stampfer MJ, Hu FB, Franz M, Sampson L, Hennekens CH, Manson JE. A prospective study of dietary glycemic load, carbohydrate intake, and risk of coronary heart disease in US women. Am J Clin Nutr. 2000; 71:1455-1461. [DOI] [PubMed] [Google Scholar]
- 39.Sieri S, Krogh V, Berrino F, Evangelista A, Agnoli C, Brighenti F, Pellegrini N, Palli D, Masala G, Sacerdote C, Veglia F, Tumino R, Frasca G, Grioni S, Pala V, Mattiello A, Chiodini P, Panico S. Dietary glycemic load and index and risk of coronary heart disease in a large italian cohort: the EPICOR study. Arch Intern Med. 2010; 170:640-647. [DOI] [PubMed] [Google Scholar]
- 40.Grau K, Tetens I, Bjørnsbo KS, Heitman BL. Overall glycaemic index and glycaemic load of habitual diet and risk of heart disease. Public Health Nutr. 2011; 14:109-118. [DOI] [PubMed] [Google Scholar]
- 41.Liu S, Manson JE, Buring JE, Stampfer MJ, Willett WC, Ridker PM. Relation between a diet with a high glycemic load and plasma concentrations of high‐sensitivity C‐reactive protein in middle‐aged women. Am J Clin Nutr. 2002; 75:492-498. [DOI] [PubMed] [Google Scholar]
- 42.McKeown NM, Meigs JB, Liu S, Saltzman E, Wilson PW, Jacques PF. Carbohydrate nutrition, insulin resistance, and the prevalence of the metabolic syndrome in the Framingham Offspring Cohort. Diabetes Care. 2004; 27:538-546. [DOI] [PubMed] [Google Scholar]
- 43.Pereira MA, O'Reilly E, Augustsson K, Fraser GE, Goldbourt U, Heitmann BL, Hallmans G, Knekt P, Liu S, Pietinen P, Spiegelman D, Stevens J, Virtamo J, Willett WC, Ascherio A. Dietary fiber and risk of coronary heart disease: a pooled analysis of cohort studies. Arch Intern Med. 2004; 164:370-376. [DOI] [PubMed] [Google Scholar]
- 44.Jensen MK, Koh‐Banerjee P, Hu FB, Franz M, Sampson L, Grønbaek M, Rimm EB. Intakes of whole grains, bran, and germ and the risk of coronary heart disease in men. Am J Clin Nutr. 2004; 80:1492-1499. [DOI] [PubMed] [Google Scholar]
- 45.Lansky AJ, Ng VG, Maehara A, Weisz G, Lerman A, Mintz GS, De Bruyne B, Farhat N, Niess G, Jankovic I, Lazar D, Xu K, Fahy M, Serruys PW, Stone GW. Gender and the extent of coronary atherosclerosis, plaque composition, and clinical outcomes in acute coronary syndromes. JACC: Cardiovascular Imaging. 2012; 53 suppl:S62-S72. [DOI] [PubMed] [Google Scholar]
- 46.Hu FB, Rimm E, Smith‐Warner SA, Feskanich D, Stampfer MJ, Ascherio A, Sampson L, Willett WC. Reproducibility and validity of dietary patterns assessed with a food‐frequency questionnaire. Am J Clin Nutr. 1999; 69:243-249. [DOI] [PubMed] [Google Scholar]