

Abstract
Background
Poor outcomes have been reported for stroke patients admitted outside of regular working hours. However, few studies have adjusted for case severity. In this nationwide assessment, we examined relationships between hospital admission time and disabilities at discharge while considering case severity.
Methods and Results
We analyzed 35 685 acute stroke patients admitted to 262 hospitals between April 2010 and May 2011 for ischemic stroke (IS), intracerebral hemorrhage (ICH), or subarachnoid hemorrhage (SAH). The proportion of disabilities/death at discharge as measured by the modified Rankin Scale (mRS) was quantified. We constructed 2 hierarchical logistic regression models to estimate the effect of admission time, one adjusted for age, sex, comorbidities, and number of beds; and the second adjusted for the effect of consciousness levels and the above variables at admission. The percentage of severe disabilities/death at discharge increased for patients admitted outside of regular hours (22.8%, 27.2%, and 28.2% for working‐hour, off‐hour, and nighttime; P<0.001). These tendencies were significant in the bivariate and multivariable models without adjusting for consciousness level. However, the effects of off‐hour or nighttime admissions were negated when adjusted for consciousness levels at admission (adjusted OR, 1.00 and 0.99; 95% CI, 1.00 to 1.13 and 0.89 to 1.10; P=0.067 and 0.851 for off‐hour and nighttime, respectively, versus working‐hour). The same trend was observed when each stroke subtype was stratified.
Conclusions
The well‐known off‐hour effect might be attributed to the severely ill patient population. Thus, sustained stroke care that is sufficient to treat severely ill patients during off‐hours is important.
Keywords: hemorrhagic stroke, ischemic stroke, mortality, stroke, weekend effect
Introduction
Stroke is a major cause of death in Japan, and residual disability after stroke is a heavy societal burden.1 Death risk tendencies are high for patients hospitalized with serious medical conditions (including stroke) during off hours, especially on weekends.2–7 Reduced quality of care during off hours because of insufficient physician volume, uneven staffing pattern for urgent procedures, and insufficient management of operative procedures, are among the possible reasons for this tendency.2–3,2–9 Acute stroke severity is an important prognostic factor,10 and stroke symptom severity is associated with healthcare‐seeking behavior.11–13 However, only 5 previous studies have adjusted for case severity, and these reports included relatively small numbers of hospitals (2 to 28).14–18 Furthermore, the results of these studies were inconsistent; 2 reported positive relationships between admission hours and outcomes14–15 and 3 reported negative relationships.16–18 We examined the relationship between admission time and disabilities/deaths at discharge by adjusting for case severity using data from a nationwide cohort of Japanese hospitals.
Materials and Methods
Database
This study included a nationwide retrospective cohort of stroke patients (J‐ASPECT study).19 Among 749 certified training hospitals of the Japan Neurosurgical Society, the Societas Neurologica Japonica, and/or the Japan Stroke Society, 262 participated in this study. We collected Japanese Diagnosis Procedure Combination/Per Diem Payment System (DPC/PDPS) data, which list the lump‐sum system of medical expenses evaluated based on diagnostic and procedural costs beginning in 2002.20 Subject data were extracted from DPC/PDPS data at each hospital using specially developed computer software.
Inclusion and Exclusion Criteria
We included consecutive patients admitted to 262 hospitals between April 1, 2010 and May 31, 2011 for acute ischemic stroke (IS), non‐traumatic intracerebral hemorrhage (ICH), or subarachnoid hemorrhage (SAH) according to the International Classification of Disease 10th revision (ICD‐10 codes, I60.0 to I60.9, I61.0 to I61.9, I62.0, I62.1, I62.9, and I63.0 to I63.9). Because of major differences in their typical prognoses, we excluded patients with transient ischemic attack (TIA) (G45). We also excluded patients who experienced in‐hospital stroke during treatment for other diseases.
Variables
The outcome measure was the proportion of severe disability/death (score 5 to 6 on the modified Rankin Scale [mRS]) at discharge.21 We classified admission into (1) working‐hour (professed work hours [usually 8 h] in each hospital from Monday to Friday, except for national holidays), (2) off‐hour (hours not included in working‐hour or nighttime classifications), or (3) nighttime (22:00 to 6:00 on any day) by using calendar time and additional medical billings in case of admission outside of working hours (Figure 1). We could not count the total hours of each admission‐hour category. Proportions of total numbers of hours were hypothesized to be 22.2%, 44.5%, and 33.3% for working‐hours, off‐hours, and nighttime categories, respectively.
Figure 1.
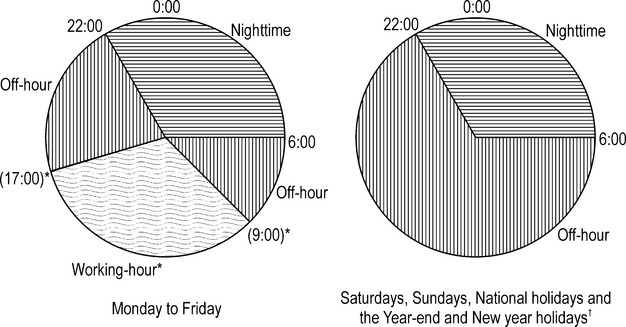
Classification of hospital admission time. *Working‐hour was defined as working‐hours professed by each hospital on consultation day (from Monday to Friday except for national holiday). †The YEAR‐end and New Year holidays are from 29th December to 3rd January.
To account for the classical confounding factors for stroke and the capability of stroke care provided by hospitals, we adjusted for the following factors to estimate the effect of admission time: age (categorized as <35 years, every 5 years from 35 to 100 years, and ≥100 years), sex, comorbidities (hypertension, diabetes mellitus, and hyperlipidemia), and number of hospital beds (<100, 100 to 299, 300 to 499, and ≥500). Comorbidities were assessed from recorded disease name and prescription history in patient medical records.
To adjust effects of baseline consciousness level at admission, we used the Japan Coma Scale (JCS).22–25 The JCS – originally published in 1974 for the assessment of impaired consciousness of head trauma and stroke patients22 and published in the same year as the Glasgow Coma Scale26 – remains one of the most popular scales used among health care professionals and personnel for emergency medical services in Japan.25 Briefly, a normal level of consciousness is graded as 0. Other levels are graded with 1‐, 2‐, or 3‐digit codes depending on status as shown in Table 1. We treated JCS as a categorical variable and classified patients as grade 0, 1 to 3, 10 to 30, or 100 to 300 for analysis. A 3‐digit JCS score is roughly equivalent to a GCS score of ≤7 (≤E1V1M5).
Table 1.
Japan Coma Scale for Grading Impaired Consciousness*
| Grade | Consciousness Level |
|---|---|
| 1‐digit code | The patient is awake without any stimuli, and is: |
| 1 | Almost fully conscious |
| 2 | Unable to recognize time, place, and person |
| 3 | Unable to recall name or date of birth |
| 2‐digit code | The patient can be aroused (then reverts to previous state after cessation of stimulation): |
| 10 | By easily by being spoken to (or is responsive with purposeful movements, phrases, or words)* |
| 20 | With a loud voice or shaking of shoulders (or is almost always responsive to very simple words like yes or no or to movements) |
| 30 | Only by repeated mechanical stimuli |
| 3‐digit code | The patient cannot be aroused with any forceful mechanical stimuli, and: |
| 100 | Responds with movements to avoid the stimulus |
| 200 | Responds with slight movements, including decerebrate and decorticate posture |
| 300 | Does not respond at all except for changes in respiratory rhythm |
”R” and “I” are added to the grade to indicate restlessness and incontinence of urine and feces, respectively: for example; 100‐R and 30‐RI.
Criteria in parentheses are used in patients who cannot open their eyes for any reason.
Statistical Analysis
We performed descriptive analyses for demographic and clinical characteristics for each group using the working‐hour group as the control. Chi‐square tests and t tests were used to compare categorical and continuous variables, respectively. For outcome analysis, we first compared crude outcome proportions among admission times in the total population, and then analyzed for each stroke subtype (IS, ICH, and SAH). For multivariable analysis, we used unique hospital ID in random‐intercept hierarchical regression models to assess the relationships between hospital admission times and outcomes, while adjusting for patient characteristics and the hospitals at which patients received stroke care. This modeling adjusts for hospital‐level cluster effects on outcome, which arise from various factors such as geographical location and ageing of the local population. We constructed 2 models to assess the impact of case severity. Model 1 included age, sex, hypertension, diabetes mellitus, hyperlipidemia, and number of beds. Baseline consciousness level was included in model 2 in addition to the variables in model 1. Moreover, to examine whether outcomes were consistent across admission times for patients with the same level of consciousness at admission, we performed subgroup analysis by JCS. To test the sex‐specific differences, we performed sex‐stratified analysis after the main analysis. Furthermore, to test whether results differ when age is treated as a continuous variable, we performed additional analyses. For sensitivity analyses, we substituted outcomes to death (mRS=6) (sensitivity analysis 1) and moderately severe disability to death (mRS=4 to 6) (sensitivity analysis 2). To confirm the robustness of our results, we also estimated the off‐hours effects at admission using the modified Rankin Scale. Unlike JCS, mRS uses 5 categories to assess severity. All statistical analyses were performed using STATA version 12 (StataCorp LP). All tests were 2‐tailed, and P<0.025 was considered statistically significant in consideration of multiple comparisons.
Ethical Approval
The Institutional Review Board of the National Cerebral and Cardiovascular Center and the University of Tokyo approved this research.
Results
Demographic and Clinical Characteristics
Out of 53 170 patients, we analyzed 35 685 patients. The inclusion criteria are shown in Figure 2. Demographics and clinical characteristics of excluded and included subjects for each stroke subtype are shown in Tables 2 and 3. IS, SAH, and ICH patients accounted for 58.2% (n=20 758), 10.9% (n=3899), and 31.1% (n=11 111), respectively. Overall, 42.3% (n=15 084), 47.4% (n=16 908), and 10.4% (n=3693) of patients were admitted during working hours, off hours, and nighttime, respectively. Patient demographics and clinical characteristics categorized according to admission time are shown in Table 4. Patients admitted during off hours and nighttime had lower baseline consciousness levels, and the percentage of these patients transferred to hospitals by ambulance was higher than that of patients admitted by ambulance during working hours. Patient demographics and clinical characteristics for each stroke subtype are shown in Table 5. The trends for age, baseline consciousness levels, and ambulance use by admission time were the same for each stroke subtype as observed for the total population.
Figure 2.
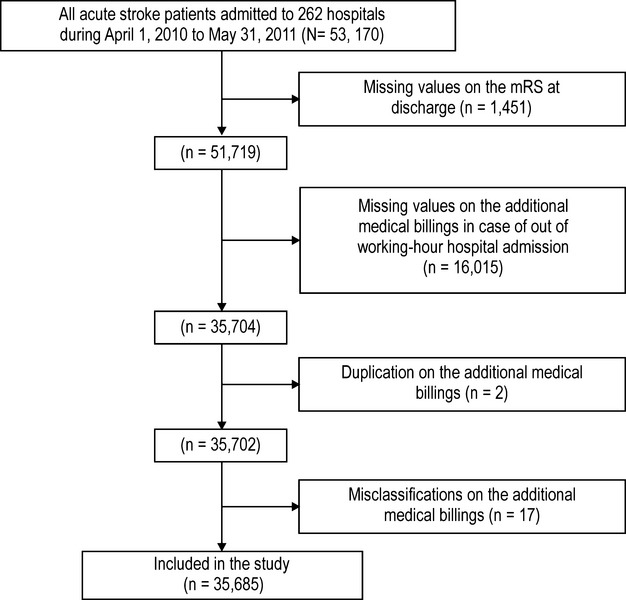
Flow chart for inclusion criteria.
Table 2.
Demographics and Clinical Characteristics of Patients Included and Excluded in the Analyses
| Total (n=53 170) | |||
|---|---|---|---|
| Excluded Subjects | Included Subjects | P Value | |
| Number, % | n=17 485 (32.9) | n=35 685 (67.1) | |
| Male, % | 58.1 | 53.8 | <0.001 |
| Age mean (SD) | 74.0 (12.0) | 71.7 (13.6) | <0.001 |
| Stroke subtype, n (%) | |||
| IS | 68.1 | 58.2 | <0.001 |
| SAH | 5.9 | 10.9 | <0.001 |
| ICH | 26.2 | 31.1 | <0.001 |
| Comorbidity, % | |||
| Hypertension | 72.7 | 76.2 | <0.001 |
| Diabetes mellitus | 28.9 | 24.3 | <0.001 |
| Hyperlipidemia | 29.3 | 27.7 | <0.001 |
| Current/past smoking history (n=44 842) (%) | 26.7 | 29.3 | <0.001 |
| Japan Coma Scale, % | |||
| 0 | 42.0 | 34.5 | <0.001 |
| 1‐digit code | 34.8 | 37.2 | |
| 2‐digit code | 11.6 | 13.8 | |
| 3‐digit code | 11.6 | 14.6 | |
| Emergency admission by ambulance (%) | 51.4 | 64.5 | <0.001 |
| mRS at discharge (n=51 719) (%) | |||
| mRS=6 | 11.4 | 12.2 | 0.014 |
| mRS=5/6 | 24.1 | 25.4 | 0.001 |
| mRS=4 to 6 | 41.3 | 44.0 | <0.001 |
ICH indicates intracerebral hemorrhage; IS, ischemic stroke; mRS, modified Rankin Scale; SAH, subarachnoid hemorrhage.
Table 3.
Patient Demographics and Clinical Characteristics by Inclusion in the Analyses for Each Stroke Subtype
| IS (n=32 671) | SAH (n=4934) | ICH (n=15 699) | |||||||
|---|---|---|---|---|---|---|---|---|---|
| Excluded | Included | P Value* | Excluded | Included | P Value* | Excluded | Included | P Value* | |
| Number, % | 11 913 (36.5) | 20 758 (63.5) | 1035 (21.0) | 3899 (79.0) | 4588 (29.2) | 11 111 (70.8) | |||
| Male, % | 59.8 | 56.3 | <0.001 | 29.1 | 32.9 | 0.019 | 60.4 | 56.3 | <0.001 |
| Age mean (SD) | 75.1 (11.4) | 74.1 (12.5) | <0.001 | 67.9 (14.1) | 63.8 (14.8) | <0.001 | 72.5 (12.6) | 70.0 (13.8) | <0.001 |
| Comorbidity, % | |||||||||
| Hypertension | 69.8 | 68.5 | 0.013 | 82.4 | 86.6 | 0.001 | 78.3 | 87.2 | <0.001 |
| Diabetes mellitus | 31.3 | 27 | <0.001 | 25.6 | 23.3 | 0.124 | 23.6 | 19.8 | <0.001 |
| Hyperlipidemia | 34.2 | 33.9 | 0.511 | 26.5 | 29.2 | 0.086 | 17.2 | 15.7 | 0.015 |
| Current/past smoking history (n=44 842) (%) | 27.6 | 30.1 | <0.001 | 22.5 | 28.2 | 0.001 | 25.1 | 28.2 | <0.001 |
| Japan Coma Scale, % | |||||||||
| 0 | 48.8 | 44.4 | <0.001 | 23.4 | 20.1 | <0.001 | 28.6 | 20.8 | <0.001 |
| 1‐digit code | 35.7 | 39.2 | 19.3 | 23.5 | 36.2 | 38.5 | |||
| 2‐digit code | 9.9 | 10.7 | 14.7 | 18 | 15.2 | 18.1 | |||
| 3‐digit code | 5.7 | 5.7 | 42.6 | 38.5 | 20 | 22.7 | |||
| Emergency admission by ambulance (%) | 46.3 | 57 | <0.001 | 73.8 | 78.6 | 0.001 | 59.7 | 73.5 | <0.001 |
| mRS at discharge (n=51 719) (%) | |||||||||
| mRS=6 | 7.8 | 7.2 | 0.099 | 29.1 | 26.8 | 0.165 | 17 | 16.3 | 0.284 |
| mRS=5/6 | 19.1 | 19.5 | 0.413 | 46.4 | 37.8 | <0.001 | 32.1 | 32.3 | 0.812 |
| mRS=4 to 6 | 36.4 | 37.5 | 0.061 | 56.8 | 47.8 | <0.001 | 50.8 | 55 | <0.001 |
ICH indicates intracerebral hemorrhage; IS, ischemic stroke; mRS, modified Rankin Scale; SAH, subarachnoid hemorrhage.
Off‐hour and nighttime were compared with working‐hours.
Table 4.
Patient Demographic and Clinical Characteristics by Admission Time
| Total (n=35 685) | |||||
|---|---|---|---|---|---|
| Working‐Hour | Off‐Hour | P Value* | Nighttime | P Value* | |
| Number, % | 15 084 (42.3) | 16 908 (47.4) | 3693 (10.4) | ||
| Male, % | 54.7 | 52.8 | 0.001 | 54.6 | 0.957 |
| Age mean (SD) | 72.4 (13.3) | 71.8 (13.5) | <0.001 | 68.3 (14.3) | <0.001 |
| Comorbidity, % | |||||
| Hypertension | 74.8 | 77.2 | <0.001 | 77.8 | <0.001 |
| Diabetes mellitus | 24.9 | 23.8 | 0.015 | 24.2 | 0.329 |
| Hyperlipidemia | 29.5 | 26.5 | <0.001 | 26.1 | <0.001 |
| Current/past smoking history (n=30 179) (%) | 30 | 28.3 | 0.001 | 31.3 | 0.191 |
| Japan Coma Scale, % | |||||
| 0 | 38.4 | 32.1 | <0.001 | 29.2 | <0.001 |
| 1‐digit code | 37.7 | 37.6 | 33.9 | ||
| 2‐digit code | 12.4 | 14.6 | 15.7 | ||
| 3‐digit code | 11.6 | 15.8 | 21.3 | ||
| Emergency admission by ambulance (%) | 54.2 | 69.9 | <0.001 | 81.4 | <0.001 |
Off‐hour and nighttime were compared with working‐hours.
Table 5.
Patient Demographic and Clinical Characteristics by Admission Time for Each Stroke Subtype
| Stroke Subtype | IS (n=20 758) | SAH (n=3899) | ICH (n=11 111) | ||||||||||||
|---|---|---|---|---|---|---|---|---|---|---|---|---|---|---|---|
| Admission Time | W | O | P Value* | N | P Value* | W | O | P Value* | N | P Value* | W | O | P Value* | N | P Value* |
| Number, % | 9275 (44.7) | 9630 (46.4) | 1853 (8.9) | 1407 (36.1) | 1886 (48.4) | 606 (15.5) | 4436 (39.9) | 5434 (48.9) | 1241 (11.2) | ||||||
| Male, % | 56.7 | 55.2 | 0.047 | 60.7 | <0.001 | 33.6 | 31.9 | 0.289 | 34.5 | 0.705 | 57.3 | 55.8 | 0.134 | 44.7 | 0.208 |
| Age mean (SD) | 74.2 (12.4) | 74.5 (12.5) | 0.046 | 71.4 (13.0) | <0.001 | 64.0 (14.6) | 64.6 (14.7) | 0.219 | 61.2 (15.3) | <0.001 | 71.3 (13.7) | 69.6 (13.6) | <0.001 | 67.2 (14.3) | <0.001 |
| Comorbidity, % | |||||||||||||||
| Hypertension | 68.5 | 68.6 | 0.930 | 67.6 | 0.411 | 88.2 | 86.2 | 0.085 | 84.2 | 0.013 | 83.5 | 89.6 | <0.001 | 90.1 | <0.001 |
| Diabetes mellitus | 28.0 | 26.1 | 0.003 | 26.2 | 0.111 | 24.1 | 23.3 | 0.610 | 21.5 | 0.198 | 18.9 | 19.8 | 0.215 | 22.6 | 0.004 |
| Hyperlipidemia | 35.9 | 32.3 | <0.001 | 32.0 | 0.002 | 28.8 | 29.6 | 0.594 | 28.7 | 0.974 | 16.3 | 15.1 | 0.107 | 15.9 | 0.734 |
| Smoking history (n=30 179) (%) | 30.9 | 28.8 | 0.002 | 33.1 | 0.092 | 28.7 | 27.7 | 0.550 | 28.9 | 0.943 | 28.5 | 27.7 | 0.388 | 29.6 | 0.492 |
| JCS, % | |||||||||||||||
| 0 | 47.3 | 42.1 | <0.001 | 42.2 | <0.001 | 24.5 | 17.9 | <0.001 | 16.5 | <0.001 | 24.1 | 19.2 | <0.001 | 16.0 | <0.001 |
| 1‐digit code | 38.2 | 40.2 | 38.5 | 24.5 | 22.9 | 23.4 | 40.6 | 38.2 | 32.1 | ||||||
| 2‐digit code | 9.6 | 11.5 | 11.7 | 17.8 | 18.0 | 18.2 | 16.4 | 18.9 | 20.4 | ||||||
| 3‐digit code | 4.8 | 6.3 | 7.7 | 33.3 | 41.3 | 41.9 | 19.0 | 23.8 | 31.5 | ||||||
| Ambulance admission (%) | 46.9 | 62.8 | <0.001 | 77.1 | <0.001 | 72.2 | 80.9 | <0.001 | 86.6 | <0.001 | 63.9 | 78.7 | <0.001 | 85.4 | <0.001 |
ICH indicates intracerebral hemorrhage; IS, ischemic stroke; JCS, Japan Coma Scale; SAH, subarachnoid hemorrhage.
Off‐hour (O) and Nighttime (N) were separately compared with Working‐hour (W).
Table 6 shows differences in primary outcomes among the 3 admission times for each stroke subtype. In the total population, increasing proportions of severe disability/death (mRS=5 to 6) at discharge were observed (22.8%, 27.2% and 28.2% for working‐hour, off‐hour, and nighttime, respectively). This remained the case when results were stratified by stroke subtype, although nighttime IS and off‐hour and nighttime SAH patients did not have statistically significant higher disabilities/death at discharge compared with patients admitted during working hours.
Table 6.
Crude Primary Outcome Comparisons Between Each Admission Time by Stroke Subtype
| Stroke Subtype | Admission Time | N | Severe Disability/Death at Discharge, n (%) | Crude OR (95% CI) | P Value |
|---|---|---|---|---|---|
| Total population | Working‐hour | 15 084 | 3434 (22.8) | — | |
| Off‐hour | 16 908 | 4597 (27.2) | 1.24 (1.18 to 1.31) | <0.001 | |
| Nighttime | 3693 | 1042 (28.2) | 1.30 (1.19 to 1.41) | <0.001 | |
| IS | Working‐hour | 9275 | 1659 (17.9) | — | — |
| Off‐hour | 9630 | 2039 (21.2) | 1.21 (1.13 to 1.31) | <0.001 | |
| Nighttime | 1853 | 355 (19.2) | 1.06 (0.93 to 1.21) | 0.361 | |
| SAH | Working‐hour | 1407 | 499 (35.5) | — | — |
| Off‐hour | 1886 | 733 (38.9) | 1.14 (0.99 to 1.32) | 0.077 | |
| Nighttime | 606 | 240 (39.6) | 1.18 (0.97 to 1.44) | 0.105 | |
| ICH | Working‐hour | 4436 | 1293 (29.2) | — | — |
| Off‐hour | 5434 | 1842 (33.9) | 1.24 (1.13 to 1.35) | <0.001 | |
| Nighttime | 1241 | 449 (36.2) | 1.38 (1.20 to 1.58) | <0.001 |
ICH indicates intracerebral hemorrhage; IS, ischemic stroke; SAH, subarachnoid hemorrhage.
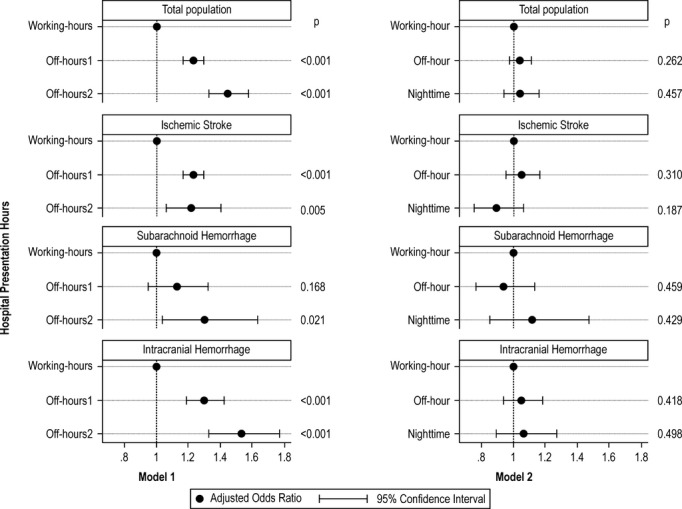
Figure 3 shows adjusted odds ratios (ORs) and 95% confidence intervals (CIs) for severe disability/death at discharge depending on stroke subtype and admission time. In model 1, which was adjusted for age, sex, comorbidities, and number of beds, off‐hour and nighttime admitted patients had higher risks of severe disability/death than working‐hour admitted patients irrespective of stroke subtype (adjusted OR, 1.23; 95% CI, 1.17 to 1.30 for off‐hour and adjusted OR, 1.45; 95% CI, 1.33 to 1.58 for nighttime). When we further adjusted for consciousness level at admission (model 2), the effects of admission time were no longer significant (adjusted OR, 1.06; 95% CI, 1.00 to 1.13; P=0.067 for off‐hour and adjusted OR, 0.99; 95% CI, 0.89 to 1.10; P=0.851 for nighttime compared with working‐hour). The same trends were observed when we stratified by stroke subtype: off‐hour and nighttime admission times were associated with significantly higher risks of severe disability/death at discharge in each stroke subtype except for off‐hour SAH (adjusted OR, 1.12; 95% CI, 0.95 to 1.32, P=0.168) in model 1, and these effects were no longer significant in model 2 (Figure 3). Table 7 shows the effects of consciousness level at admission using Model 2.
Figure 3.
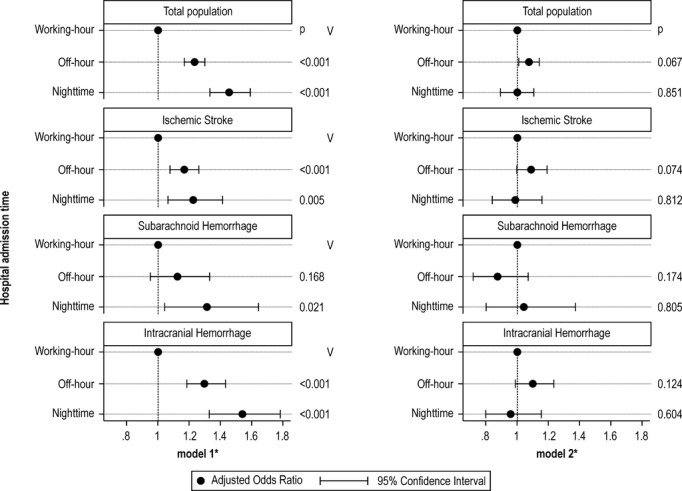
Effects of admission time on primary outcomes (modified Rankin Scale [mRS]=5 to 6) among acute stroke patients with 2 different models. *Model 1 adjusted for age, sex, hypertension, diabetes mellitus, hyperlipidemia, and number of beds. Model 2 further adjusted for Japan Coma Scale.
Table 7.
Effects of Consciousness Level at Admission on Primary Outcomes (mRS=5 to 6) Among Acute Stroke Patients Determined Using Model 2
| Admission Time | Japan Coma Scale | Total Population | IS | SAH | ICH | ||||
|---|---|---|---|---|---|---|---|---|---|
| Adjusted OR (95% CI) | P Value | Adjusted OR (95% CI) | P Value | Adjusted OR (95% CI) | P Value | Adjusted OR (95% CI) | P Value | ||
| Off‐hour | 0 | 1.00 (reference) | — | 1.00 (reference) | — | 1.00 (reference) | — | 1.00 (reference) | — |
| 1 digit | 3.53 (3.18 to 3.90) | <0.001 | 4.08 (3.60 to 4.62) | <0.001 | 1.72 (1.22 to 2.44) | 0.002 | 2.87 (2.32 to 3.56) | <0.001 | |
| 2 digit | 12.31 (11.00 to 13.78) | <0.001 | 16.70 (14.41 to 19.35) | <0.001 | 2.68 (1.88 to 3.81) | <0.001 | 10.33 (8.25 to 12.92) | <0.001 | |
| 3 digit | 72.27 (64.01 to 81.59) | <0.001 | 45.98 (38.17 to 55.39) | <0.001 | 24.79 (17.93 to 34.28) | <0.001 | 90.05 (71.19 to 113.91) | <0.001 | |
| Nighttime | 0 | 1.00 (reference) | — | 1.00 (reference) | — | 1.00 (reference) | — | 1.00 (reference) | — |
| 1 digit | 3.10 (2.72 to 3.53) | <0.001 | 3.66 (3.10 to 4.31) | <0.001 | 1.73 (1.13 to 2.64) | 0.011 | 2.28 (1.75 to 2.97) | <0.001 | |
| 2 digit | 10.89 (9.42 to 12.58) | <0.001 | 15.89 (13.08 to 19.31) | <0.001 | 2.96 (1.90 to 4.59) | <0.001 | 7.79 (5.91 to 10.26) | <0.001 | |
| 3 digit | 69.17 (59.18 to 80.85) | <0.001 | 51.80 (40.27 to 66.64) | <0.001 | 24.79 (16.49 to 37.28) | <0.001 | 68.28 (51.33 to 90.82) | <0.001 | |
ICH indicates intracerebral hemorrhage; IS, ischemic stroke; mRS, modified Rankin Scale; SAH, subarachnoid hemorrhage.
In the subgroup analysis by using JCS at admission, proportions of severe disabilities/death were larger during off hours/nighttime than during working hours among IS and ICH patients with a JCS of 0. Proportions of primary outcome were larger during working hours than off hours/nighttime among IS and ICH patients who had a 3‐digit JCS score (Table 8). Table 9 shows the results of subgroup analysis adjusted for age, sex, comorbidities, and number of hospital beds. Effects of nighttime admission were significantly higher (adjusted OR, 1.59; 95% CI, 1.11 to 2.29; IS and adjusted OR, 2.87; 95% CI, 1.66 to 4.98; for ICH) in patients with a JCS score of 0 and significantly lower (adjusted OR, 0.50; 95% CI, 0.31 to 0.81; for IS and adjusted OR, 0.67; 95% CI, 0.49 to 0.90; for ICH) in patients with a 3‐digit JCS score. Furthermore, no sex‐based differences were present in these trends. Results obtained with age as a continuous variable were comparable with those obtained when it was treated as a categorical variable.
Table 8.
Crude Primary Outcome Comparisons Between Each Admission Time by Stroke Subtype and Japan Coma Scale
| Japan Coma Scale | Admission Time | Total Population | IS | SAH | ICH | ||||
|---|---|---|---|---|---|---|---|---|---|
| Admission (n) | Severe Disability/Death at Discharge, n (%) | Admission (n) | Severe Disability/Death at Discharge, n (%) | Admission (n) | Severe Disability/Death at Discharge, n (%) | Admission (n) | Severe Disability/Death at Discharge, n (%) | ||
| 0 | Working‐hours | 5793 | 286 (4.9) | 4388 | 193 (4.4) | 345 | 37 (10.7) | 1069 | 56 (5.2) |
| Off‐hour | 5420 | 293 (5.4) | 4051 | 203 (5.0) | 337 | 29 (8.6) | 1042 | 62 (6.0) | |
| Nighttime | 1079 | 78 (7.2) | 781 | 46 (5.9) | 100 | 8 (8.0) | 199 | 25 (12.6) | |
| 1‐digit | Working‐hours | 5679 | 991 (17.5) | 3546 | 664 (18.7) | 344 | 57 (16.6) | 1799 | 276 (15.3) |
| Off‐hour | 6354 | 1243 (19.6) | 3869 | 831 (21.5) | 431 | 65 (15.1) | 2075 | 355 (17.1) | |
| Nighttime | 1250 | 202 (16.2) | 713 | 120 (16.8) | 142 | 25 (17.6) | 398 | 57 (14.3) | |
| 2‐digit | Working‐hours | 1867 | 774 (41.5) | 894 | 451 (50.5) | 250 | 55 (22.0) | 727 | 271 (37.3) |
| Off‐hour | 2469 | 1034 (41.9) | 1108 | 576 (52.0) | 340 | 74 (21.8) | 1026 | 387 (37.7) | |
| Nighttime | 579 | 195 (33.7) | 217 | 94 (43.3) | 110 | 29 (26.4) | 253 | 73 (28.9) | |
| 3‐digit | Working‐hours | 1745 | 1383 (79.3) | 447 | 351 (78.5) | 468 | 350 (74.8) | 841 | 690 (82.1) |
| Off‐hour | 2665 | 2027 (76.1) | 602 | 429 (71.3) | 778 | 565 (72.6) | 1291 | 1038 (80.4) | |
| Nighttime | 785 | 567 (72.2) | 142 | 95 (66.9) | 254 | 178 (70.1) | 391 | 294 (75.2) | |
ICH indicates intracerebral hemorrhage; IS, ischemic stroke; SAH, subarachnoid hemorrhage.
Table 9.
Effects of Admission Time on Primary Outcomes (mRS=5 to 6) Among Acute Stroke Patients by Japan Coma Scale
| Japan Coma Scale | Admission Time | Total Population | IS | SAH | ICH | ||||
|---|---|---|---|---|---|---|---|---|---|
| Adjusted OR* (95% CI) | P Value* | Adjusted OR* (95% CI) | P Value* | Adjusted OR* (95% CI) | P Value* | Adjusted OR* (95% CI) | P Value* | ||
| 0 | Working‐hours | 1.00 (reference) | — | 1.00 (reference) | — | 1.00 (reference) | — | 1.00 (reference) | — |
| Off‐hour | 1.45 (1.33 to 1.58) | <0.001 | 1.07 (0.87 to 1.33) | 0.515 | 0.87 (0.48 to 1.56) | 0.633 | 1.29 (0.86 to 1.93) | 0.220 | |
| Nighttime | 1.45 (1.33 to 1.58) | <0.001 | 1.59 (1.11 to 2.29) | 0.011 | 0.83 (0.34 to 1.99) | 0.672 | 2.87 (1.66 to 4.98) | <0.001 | |
| 1‐digit | Working‐hours | 1.00 (reference) | — | 1.00 (reference) | — | 1.00 (reference) | — | 1.00 (reference) | — |
| Off‐hour | 1.20 (1.09 to 1.33) | <0.001 | 1.20 (1.07 to 1.36) | 0.003 | 1.00 (0.64 to 1.55) | 0.998 | 1.21 (1.00 to 1.45) | 0.044 | |
| Nighttime | 1.06 (0.89 to 1.26) | 0.536 | 0.98 (0.78 to 1.23) | 0.856 | 1.28 (0.71 to 2.31) | 0.416 | 1.01 (0.73 to 1.41) | 0.941 | |
| 2‐digit | Working‐hours | 1.00 (reference) | — | 1.00 (reference) | — | 1.00 (reference) | — | 1.00 (reference) | — |
| Off‐hour | 1.08 (0.94 to 1.24) | 0.295 | 1.03 (0.85 to 1.25) | 0.770 | 0.93 (0.60 to 1.44) | 0.751 | 1.18 (0.93 to 1.48) | 0.170 | |
| Nighttime | 0.91 (0.73 to 1.14) | 0.406 | 0.89 (0.63 to 1.25) | 0.498 | 1.56 (0.84 to 2.88) | 0.160 | 0.81 (0.57 to 1.16) | 0.250 | |
| 3‐digit | Working‐hours | 1.00 (reference) | — | 1.00 (reference) | — | 1.00 (reference) | — | 1.00 (reference) | — |
| Off‐hour | 0.81 (0.69 to 0.95) | 0.008 | 0.65 (0.48 to 0.88) | 0.006 | 0.81 (0.60 to 1.10) | 0.169 | 0.89 (0.70 to 1.13) | 0.325 | |
| Nighttime | 0.70 (0.57 to 0.86) | 0.001 | 0.50 (0.31 to 0.81) | 0.005 | 0.77 (0.51 to 1.15) | 0.196 | 0.67 (0.49 to 0.90) | 0.009 | |
ICH indicates intracerebral hemorrhage; IS, ischemic stroke; mRS, modified Rankin Scale; SAH, subarachnoid hemorrhage.
Off‐hour and nighttime were compared with working‐hours.
Adjusted for age, sex, hypertension, diabetes mellitus, hyperlipidemia, and hospital volume.
Two sensitivity analyses that used different outcomes showed almost the same trend observed in the original analysis, except for ICH patients in sensitivity analysis 2 (Figure 4). Here, the effect of admission time was observed in ICH patients even when adjusted for consciousness level at admission (adjusted OR, 1.17; 95% CI 1.06 to 1.30; P=0.003 for off‐hour compared to working‐hour). Additional sensitivity analyses performed using mRS at admission as a confounder instead of JCS revealed a trend similar to that observed in the original analysis (Figure 5). Here, the effects of admission time were no longer significant even when stratified to each stroke subtype.
Figure 4.
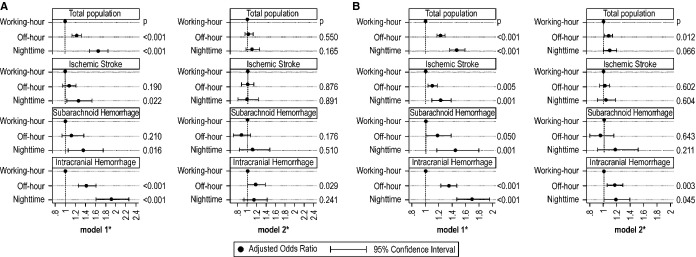
Sensitivity analyses for effects of admission time on modified Rankin Scale (mRS)=6 (A) and mRS=4 to 6 (B) among acute stroke patients with 2 different models. *Model 1 adjusted for age, sex, hypertension, diabetes mellitus, hyperlipidemia, and number of beds. Model 2 further adjusted for Japan Coma Scale.
Figure 5.
Sensitivity analysis for effects of admission time on primary outcomes (modified Rankin Scale [mRS]=5 to 6) among acute stroke patients with 2 different models using mRS at admission as a confounder instead of JCS. *Model 1 adjusted for age, sex, hypertension, diabetes mellitus, hyperlipidemia, and hospital volume. Model 2 further adjusted for modified Rankin Scale at admission instead of Japan Coma Scale.
Discussion
Using nationwide population data on acute stroke patients, we found that outcome varied with admission time. Patients admitted outside of regular working hours were about 1.2 times more likely to have a poor outcome than those admitted during working hours. The effect of admission time remained significant for almost all stroke subtypes without adjusting for consciousness level at admission, which is similar to what has been reported previously. However, once we adjusted for consciousness level, the effects of admission time were dramatically attenuated; comatose patients were approximately 70 times more likely to suffer severe disabilities or death than lucid patients. Therefore, the different outcomes observed depending upon admission times were because of differences in stroke severity.
This study has several strengths. First, we included a large number of subjects from hospitals certified for training by the Japan Neurosurgical Society, the Societas Neurologica Japonica, and/or the Japan Stroke Society. Therefore, our results accurately reflect current practice in acute stroke care and are not influenced by changes in therapeutic strategy. The second strength is that we highlighted risks associated with nighttime admission. During the nighttime shift, hospital functions are reduced, and we observed a higher percentage of poorer outcomes for nighttime admitted patients. This finding is in accordance with a Dutch study that did not adjust for case severity, but did describe risk among IS patients admitted during the night.27 Third, we adjusted for case severity at admission by using consciousness level. Case severity is a major confounding factor because it is one of the most important prognosis factors and is related to healthcare‐seeking behaviors in stroke patients.10–13 However, only 5 previous studies adjusted for case severity and they reported inconsistent results.14–18 Among these, the Canadian study was the only one including a large number of subjects and reported a positive relationship between weekend hospital admission and stroke mortality among 20 000 acute stroke or TIA patients at 11 hospitals.14 The major differences of this study and the Canadian study are the number of participating hospitals and the definition of stroke subtypes. The Canadian study did not perform subtype‐specific analyses, whereas we evaluated both total population and stroke subtype outcomes. Therapeutic strategies and responses vary with stroke subtypes. Therefore, we considered that stratified analysis by subtype was more appropriate.
The reason why admission outside of working hours is related to case severity remains unknown. A circadian rhythm of stroke has been reported in large studies and may partially explain this phenomenon. Stroke is more frequent in the morning and evening,28–31 and a surge in blood pressure and altered heart rate may be responsible for diurnal variation in stroke incidence.32–33 However, the exact effect of circadian rhythm on stroke severity is unclear. Other factors such as limited access, minor symptoms, and age are known to be reasons that patients delay coming to the hospital.10–12 Larger percentages of patients are admitted at off hours because baseline consciousness levels decrease during nighttime. Delayed perception of stroke symptoms or postponement of hospital consultation until regular working hours by patients with minor symptoms might have caused the perceived diurnal variation in stroke admission, though we could not confirm this from our data. Interestingly, in the subgroup analysis by baseline consciousness level, effects of admission time were reversed to a favorable outcome, as baseline consciousness levels got poorer in IS and ICH patients. These results may be inconsistent with the true values as a result of over stratification. Compared with patients with good consciousness level, patients with poor consciousness level could have been transferred to skilled hospitals by emergency medical services personnel and this may have led to this reverse effect of admission time, although we could not verify whether selective transfers existed in our dataset. Thus, health service managers must ensure that adequate stroke care is provided during off hours to promptly identify and treat severe stroke cases. Moreover, it is important to increase awareness among the general population about the appropriate facilities at Japanese hospitals for receiving stroke treatment in the acute phase.
In the sensitivity analyses, ICH patients admitted outside of working hours did not show robust results, but the effects of admission outside of working hours remained significant even when adjusted for baseline consciousness level among ICH patients. This is an important point because the numbers of hemorrhagic patients who are admitted outside of working hours are increasing. Although we could not measure any metrics of acute stroke care, our results suggest that the quality of acute stroke care provided by hospitals in Japan for hemorrhagic patients during the day are inconsistent. The results of a study published by the Get With The Guidelines‐Stroke Program may support these findings; appropriate care and prevention were less frequently provided for ICH and SAH patients than for IS patients.34 Systematic care processes for ICH and SAH may be poor during off‐hours because of impaired healthcare systems, such as differential response times by night‐shift workers and the presence of less skilled neurosurgeons, general physicians, residents, and paramedics.
We could not detect outcome differences for SAH patients probably because of the poor clinical prognosis associated with this stroke subtype. However, further studies that measure acute stroke care quality, such as prompt examination or available procedures during working hours and off hours, are necessary to verify this hypothesis.
This study has some limitations. Because the Japanese DPC/PDPS data were used, JCS scores were used to adjust for severity instead of the National Institute of Health Stroke Scale (NIHSS) or GCS.25–26 However, our findings did not change even when data were adjusted by mRS at admission. Second, we used information on the occurrence of additional billings from the DPC/PDPS data to classify admission time; therefore, some data on the occurrence of additional billings were missing. We excluded subjects with missing values from analysis, and this may have biased our results. However, we believe that this exclusion does not alter our findings because severities of consciousness levels at admission and outcomes at discharge were not significantly different between subjects who were excluded and those who were included. Third, as for the classification of hospital admission time, we could not split the times in a more detailed manner because of data restriction, ie, daytime admissions during weekends and on national holidays were considered to be off‐hour admissions. However, if patients admitted during this time exhibited less severe stroke symptoms or if hospitals during this time indeed provided better stroke care than at other off‐hour times among off‐hour, it could underestimate the effects of differences in severity on relationships between admission time and outcome at discharge. Fourth, although we collected nationwide data, we may have underestimated the relationship between admission time and outcomes because participating hospitals were certified training hospitals, which are considered to offer similar qualities of care. If hospitals that provide fewer resources and less professional stroke care were included in the analysis, stronger relationships may have been identified. Furthermore, we could not follow‐up on post‐discharge outcomes and we were unable to include multiple metrics representing acute stroke care quality, such as promptness or execution of specific procedures and protocols. Most studies have dealt with the inequality of care between working hours and off hours, such as reduced availability of highly skilled personnel and less access to urgent procedures, as the main reason for outcome disparity.2–3 Further studies that focus on acute stroke care metrics are needed to better identify variability in care quality between admission times.
Sources of Funding
This study was supported by a Grant‐in‐Aid from the Ministry of Health, Labour, and Welfare of Japan.
Disclosures
All authors have completed the Unified Competing Interest form at www.icmje.org/coi_disclosure.pdf (available on request from the corresponding author) and declare support from the Ministry of Health, Labor and Welfare, Japan; no financial relationships with any organizations that might have an interest in the submitted work in the previous 3 years; and no other relationships or activities that could seem to have influenced the submitted work.
References
- 1.Statistics & Other Data. Vital Statistics. Statistics and Information Department Minister's Secretariat Ministry of Health, Labour and Welfare JAPAN. Vital Statistics. Summary of Vital Statistics. Trends in leading causes of death. Ministry of Health, Labour and Welfare; website. Available at: http://www.mhlw.go.jp/english/database/db-hw/populate/dl/03.pdf. Accessed December 16, 2013. [Google Scholar]
- 2.Bell CM, Redelmeier DA. Mortality among patients admitted to hospitals on weekends as compared with weekdays. N Engl J Med. 2001; 345:663-668. [DOI] [PubMed] [Google Scholar]
- 3.Bell CM, Redelmeier DA. Waiting for urgent procedures on the weekend among emergently hospitalized patients. Am J Med. 2004; 117:175-181. [DOI] [PubMed] [Google Scholar]
- 4.Saposnik G, Baibergenova A, Bayer N, Hachinski V. Weekends: a dangerous time for having a stroke? Stroke. 2007; 38:1211-1215. [DOI] [PubMed] [Google Scholar]
- 5.Crowley RW, Yeoh HK, Stukenborg GJ, Medel R, Kassell NF, Dumont AS. Influence of weekend hospital admission on short‐term mortality after intracerebral hemorrhage. Stroke. 2009; 40:2387-2392. [DOI] [PubMed] [Google Scholar]
- 6.Tung YC, Chang GM, Chen YH. Associations of physician volume and weekend admissions with ischemic stroke outcome in Taiwan: a nationwide population‐based study. Med Care. 2009; 47:1018-1025. [DOI] [PubMed] [Google Scholar]
- 7.Palmer WL, Bottle A, Davie C, Vincent CA, Aylin P. Dying for the weekend: a retrospective cohort study on the association between day of hospital presentation and the quality and safety of stroke care. Arch Neurol. 2012; 9:1-7. [DOI] [PubMed] [Google Scholar]
- 8.Hoh BL, Chi YY, Waters MF, Mocco J, Barker FG., II Effect of weekend compared with weekday stroke admission on thrombolytic use, in‐hospital mortality, discharge disposition, hospital charges, and length of stay in the Nationwide Inpatient Sample Database, 2002 to 2007. Stroke. 2010; 41:2323-2328. [DOI] [PubMed] [Google Scholar]
- 9.Reeves MJ, Smith E, Fonarow G, Hernandez A, Pan W, Schwamm LHGWTG‐Stroke Steering Committee & Investigators. Off‐hour admission and in‐hospital stroke case fatality in the get with the guidelines‐stroke program. Stroke. 2009; 40:569-576. [DOI] [PubMed] [Google Scholar]
- 10.Weimar C, Konig IR, Kraywinkel K, Ziegler A, Diener HCGerman Stroke Study Collaboration. Age and National Institutes of Health Stroke Scale Score within 6 hours after onset are accurate predictors of outcome after cerebral ischemia: development and external validation of prognostic models. Stroke. 2004; 35:158-162. [DOI] [PubMed] [Google Scholar]
- 11.Kothari R, Sauerbeck L, Jauch E, Broderick J, Brott T, Khoury J, Liu T. Patients’ awareness of stroke signs, symptoms, and risk factors. Stroke. 1997; 28:1871-1875. [DOI] [PubMed] [Google Scholar]
- 12.Chang KC, Tseng MC, Tan TY. Prehospital delay after acute stroke in Kaohsiung, Taiwan. Stroke. 2004; 35:700-704. [DOI] [PubMed] [Google Scholar]
- 13.Lasserson DS, Chandratheva A, Giles MF, Mant D, Rothwell PM. Influence of general practice opening hours on delay in seeking medical attention after transient ischaemic attack (TIA) and minor stroke: prospective population based study. BMJ. 2008; 337:a1569. [DOI] [PMC free article] [PubMed] [Google Scholar]
- 14.Fang J, Saposnik G, Silver FL, Kapral MKInvestigators of the Registry of the Canadian Stroke Network. Association between weekend hospital presentation and stroke fatality. Neurology. 2010; 75:1589-1596. [DOI] [PubMed] [Google Scholar]
- 15.Hasegawa Y, Yoneda Y, Okuda S, Hamada R, Toyota A, Gotoh J, Watanabe M, Okada Y, Ikeda K, Ibayashi SAcute Stroke Rehabilitation Study Group. The effect of weekends and holidays on stroke outcome in acute stroke units. Cerebrovasc Dis. 2005; 20:325-331. [DOI] [PubMed] [Google Scholar]
- 16.Albright KC, Raman R, Ernstrom K, Hallevi H, Martin‐Schild S, Meyer BC, Meyer DM, Morales MM, Grotta JC, Lyden PD, Savitz SI. Can comprehensive stroke centers erase the ‘weekend effect’? Cerebrovasc Dis. 2009; 27:107-113. [DOI] [PMC free article] [PubMed] [Google Scholar]
- 17.Streifler JY, Benderly M, Molshatzki N, Bornstein N, Tanne D. Off‐hours admission for acute stroke is not associated with worse outcome–a nationwide Israeli stroke project. Eur J Neurol. 2012; 19:643-647. [DOI] [PubMed] [Google Scholar]
- 18.Albright KC, Savitz SI, Raman R, Martin‐Schild S, Broderick J, Ernstrom K, Ford A, Khatri R, Kleindorfer D, Liebeskind D, Marshall R, Merino JG, Meyer DM, Rost N, Meyer BC. Comprehensive stroke centers and the ‘weekend effect’: the SPOTRIAS experience. Cerebrovasc Dis. 2012; 34:424-429. [DOI] [PMC free article] [PubMed] [Google Scholar]
- 19.Iihara K, Nishimura K, Kada A, Nakagawara J, Toyoda K, Ogasawara K, Ono J, Shiokawa Y, Aruga T, Miyachi S, Nagata I, Matsuda S, Ishikawa KB, Suzuki A, Mori H, Nakamura FJ‐ASPECT Study Collaborators. The impact of comprehensive stroke care capacity on the hospital volume of stroke interventions: a nationwide study in Japan: J‐ASPECT study. J Stroke Cerebrovasc Dis. 2014; 23:1001-1018. [DOI] [PubMed] [Google Scholar]
- 20.Yasunaga H, Ide H, Imamura T, Ohe K. Impact of the Japanese Diagnosis Procedure Combination‐based Payment System on cardiovascular medicine‐related costs. Int Heart J. 2005; 46:855-866. [DOI] [PubMed] [Google Scholar]
- 21.Quinn TJ, Dawson J, Walters MR, Lees KR. Reliability of the modified Rankin Scale: a systematic review. Stroke. 2009; 40:3393-3395. [DOI] [PubMed] [Google Scholar]
- 22.Ohta T, Waga S, Handa W, Saito I, Takeuchi K. New grading of level of disordered consiousness (author's transl). No Shinkei Geka. 1974; 2:623-627. [PubMed] [Google Scholar]
- 23.Ohta T, Kikuchi H, Hashi K, Kudo Y. Nizofenone administration in the acute stage following subarachnoid hemorrhage. Results of a multi‐center controlled double‐blind clinical study. J Neurosurg. 1986; 64:420-426. [DOI] [PubMed] [Google Scholar]
- 24.Takagi K, Aoki M, Ishii T, Nagashima Y, Narita K, Nakagomi T, Tamura A, Yasui N, Hadeishi H, Taneda M, Sano K. Japan Coma Scale as a grading scale of subarachnoid hemorrhage: a way to determine the scale. No Shinkei Geka. 1998; 26:509-515. [PubMed] [Google Scholar]
- 25.Shigematsu K, Nakano H, Watanabe Y. The eye response test alone is sufficient to predict stroke outcome‐reintroduction of Japan Coma Scale: a cohort study. BMJ Open. 2013; 3:e002736. [DOI] [PMC free article] [PubMed] [Google Scholar]
- 26.Teasdale G, Jennett B. Assessment of coma and impaired consciousness. A practical scale. Lancet. 1974; 2:81-84. [DOI] [PubMed] [Google Scholar]
- 27.Ogbu UC, Westert GP, Slobbe LC, Stronks K, Arah OA. A multifaceted look at time of admission and its impact on case‐fatality among a cohort of ischaemic stroke patients. J Neurol Neurosurg Psychiatry. 2011; 82:8-13. [DOI] [PubMed] [Google Scholar]
- 28.Cheung RT, Mak W, Chan KH. Circadian variation of stroke onset in Hong Kong Chinese: a hospital‐based study. Cerebrovasc Dis. 2001; 12:1-6. [DOI] [PubMed] [Google Scholar]
- 29.Spengos K, Vemmos K, Tsivgoulis G, Manios E, Zakopoulos N, Mavrikakis M, Vassilopoulos D. Diurnal and seasonal variation of stroke incidence in patients with cardioembolic stroke due to atrial fibrillation. Neuroepidemiology. 2003; 22:204-210. [DOI] [PubMed] [Google Scholar]
- 30.Turin TC, Kita Y, Rumana N, Takashima N, Ichikawa M, Sugihara H, Morita Y, Hirose K, Murakami Y, Miura K, Okayama A, Nakamura Y, Abbott RD, Ueshima H. Morning surge in circadian periodicity of ischaemic stroke is independent of conventional risk factor status: findings from the Takashima Stroke Registry 1990–2003. Eur J Neurol. 2009; 16:843-851. [DOI] [PubMed] [Google Scholar]
- 31.Turin TC, Kita Y, Rumana N, Takashima N, Ichikawa M, Sugihara H, Morita Y, Hirose K, Murakami Y, Miura K, Okayama A, Nakamura Y, Abbott RD, Ueshima H. Diurnal variation in onset of hemorrhagic stroke is independent of risk factor status: Takashima Stroke Registry. Neuroepidemiology. 2010; 34:25-33. [DOI] [PubMed] [Google Scholar]
- 32.Kario K, Pickering TG, Umeda Y, Hoshide S, Hoshide Y, Morinari M, Murata M, Kuroda T, Schwartz JE, Shimada K. Morning surge in blood pressure as a predictor of silent and clinical cerebrovascular disease in elderly hypertensives: a prospective study. Circulation. 2003; 107:1401-1406. [DOI] [PubMed] [Google Scholar]
- 33.Stergiou GS, Vemmos KN, Pliarchopoulou KM, Synetos AG, Roussias LG, Mountokalakis TD. Parallel morning and evening surge in stroke onset, blood pressure, and physical activity. Stroke. 2002; 33:1480-1486. [DOI] [PubMed] [Google Scholar]
- 34.Smith EE, Liang L, Hernandez A, Reeves MJ, Cannon CP, Fonarow GC, Schwamm LH. Influence of stroke subtype on quality of care in the Get With The Guidelines‐Stroke Program. Neurology. 2009; 73:709-716. [DOI] [PMC free article] [PubMed] [Google Scholar]