

Abstract
Background
Individuals with rheumatoid arthritis (RA) are at increased risk for cardiovascular disease, partly due to systemic inflammation and endothelial dysfunction. B‐cells play an important pathogenic role in the inflammatory process that drives RA disease activity. Rituximab, a chimeric murine/human monoclonal antibody that depletes B‐cells, is an effective therapy for RA. The purpose of this study was to determine whether B‐cell depletion with rituximab reduces systemic inflammation and improves macrovascular (brachial artery flow‐mediated dilation, FMD) and microvascular (reactive hyperemia) endothelial function in RA patients.
Methods and Results
RA patients received a single course of rituximab (1000 mg IV infusion at baseline and on day 15). FMD, reactive hyperemia, inflammatory markers, and clinical assessments were performed at baseline, week 12, and week 24. Twenty patients (95% female, median age 54 years) completed the study. Following treatment, FMD improved from a baseline of 4.5±0.4% to 6.4±0.6% at 12 weeks (mean±SE; P<0.0001), followed by a decline at week 24; a similar pattern was observed for hyperemic velocity. Significant decreases in RA disease scores, high‐sensitivity C‐reactive protein, erythrocyte sedimentation rate, and circulating CD19+ B‐cells were sustained through week 24. Cholesterol and triglycerides became significantly although modestly elevated during the study.
Conclusions
Depletion of B‐cells with rituximab improved macrovascular and microvascular endothelial function and reduced systemic inflammation, despite modest elevation in lipids. Given these results, rituximab should be evaluated in the future for its possible role in reducing excess cardiovascular risk in RA.
Clinical Trial Registration
URL http://ClinicalTrials.gov. Unique identifier: NCT00844714.
Keywords: B‐cells, endothelial function, inflammation, rheumatoid arthritis
Introduction
Individuals with rheumatoid arthritis (RA) have a higher risk of cardiovascular (CV) morbidity and mortality relative to persons without RA.1–3 This increased risk is not entirely attributable to traditional cardiac risk factors,4 but has been strongly associated with high levels of systemic inflammation5 as well as polymorphisms associated with inflammation.6 Chronic inflammation is an essential component of RA disease activity and likely promotes the progression of both RA and atherosclerosis7; for example, proinflammatory cytokines that include tumor necrosis factor‐α (TNF) and interleukin‐6 are produced in the synovium of RA patients and also play a key role in the development of atherosclerosis.7 Advances in disease‐modifying RA therapy not only more effectively control joint activity and inflammation but also likely reduce CV risk, as suggested by observational cohort studies in which treatment with agents such as methotrexate8 and anti‐TNF‐α therapy was associated with a reduced risk for CV events.9
Endothelial dysfunction is one of the earliest manifestations of atherosclerosis10 that can be studied noninvasively using brachial artery flow‐mediated vasodilation (FMD).11 In addition, during the brachial artery ultrasound/Doppler test, microvascular endothelial function can be assessed by the magnitude of reactive hyperemia following the deflation of an occlusive cuff.12 Endothelial dysfunction is prevalent in RA patients,13 correlates with higher levels of high‐sensitivity C‐reactive protein (hsCRP),14 and is improved with anti‐TNF‐α therapy after 12 weeks of treatment.14 However, a proportion of RA patients experience persistent disease activity and inflammation despite treatment with anti‐TNF therapy. Rituximab is a monoclonal antibody that induces rapid and sustained depletion of peripheral B‐cells by binding specifically to CD20 antigen on the surface of B lymphocytes15; it is indicated for the treatment of patients with moderate to severe RA who have had inadequate response to TNF inhibitor therapy.16–17 After treatment using the standard approved dosage (two 1000‐mg infusions given 2 weeks apart), most individuals achieve a significant improvement in RA disease activity.18 We studied whether RA patients who are refractory or intolerant to anti‐TNF‐α therapy derive a CV benefit from treatment with rituximab by measuring changes in systemic inflammatory markers and endothelial function using FMD. The primary objective of this study was to determine the effect of a single course of rituximab on brachial artery FMD (ie, macrovascular endothelial function) in the setting of RA. Secondary objectives included determination of the effect of rituximab on hyperemic velocity (ie, microvascular function), inflammatory markers and lipid profiles, RA disease activity, and subclinical vascular disease (as assessed by carotid artery intima‐media thickness [IMT]).
Methods
Patients were recruited from the University of California, San Francisco observational RA cohort, which requires individuals to fulfill the 1987 American College of Rheumatology classification criteria for RA.19 To qualify for enrollment in our study, patients had to inadequately respond to, be intolerant of, or otherwise be clinically appropriate for treatment with rituximab as determined by their treating rheumatologist, and they had to demonstrate high levels of RA disease activity as assessed by (1) disease activity score using 28 joints (DAS28 >5.1), or (2) a swollen joint count ≥8 plus either hsCRP ≥10 mg/L or erythrocyte sedimentation rate (ESR) >30 mm/h. Eligibility for enrollment was determined at a screening visit 2 weeks prior to the baseline visit. Patients were allowed to take disease‐modifying antirheumatic medication (defined as methotrexate, leflunomide, sulfasalazine, hydroxychloroquine, or prednisone) during the study. Stable doses of methotrexate <25 mg/week for at least 4 months or prednisone ≤10 mg/d for 1 month) were required if patients were taking these medicines. Individuals who were treated with anti‐TNF‐α therapies were required to discontinue infliximab and adalimumab 2 months prior to study entry and etanercept 1 month before study entry. Patients were excluded if they had a history of coronary artery disease, HIV infection, hepatitis B/C infection, prior treatment with rituximab, blood pressure >140/90 mm Hg (individuals with treated hypertension were allowed as long as the blood pressure was ≤140/90), and use of high or unstable doses of prednisone (>10 mg/d). Use of phosphodiesterase type 5 inhibitors (ie, sildenafil, tadafil, and vardenafil) was not permitted 1 week prior to the FMD study to avoid potential interactions with nitroglycerin given as part of the FMD test.
Study Protocol
A detailed chart review was used to ascertain age, gender, RA disease duration, history of erosive arthritis, medication history, and presence of traditional CV risk factors. At the baseline visit, patients underwent a physical examination by a trained rheumatologist, including determination of the numbers of tender and swollen joints, and global assessments of disease by both the physician and patient using standardized visual analog scales. A blood draw was performed for assessment of inflammatory markers and lipids, and FMD and carotid IMT studies were performed as detailed below. All of these procedures were repeated at weeks 12 and 24. In addition, paired FMD tests were performed 14 days apart at baseline in a subset of study individuals to demonstrate stability and establish reproducibility of this measurement before treatment was given. A single course of rituximab 1000 mg IV was administered at the baseline visit and on day 15 according to standard practice guidelines (rituximab product insert). The University of California, San Francisco Committee on Human Research approved the study, and all subjects provided written informed consent.
Laboratory Measurements
Fasting serum lipids (total cholesterol, high‐density lipoprotein [HDL] cholesterol, and triglycerides) and hsCRP (Dade Behring, Deerfield, IL) were measured at the San Francisco General Hospital clinical lab. Blood was drawn in the fasting state at the San Francisco General Hospital clinical laboratories and aliquots of serum and plasma were stored at −80°C until analysis. Total cholesterol, HDL‐cholesterol, and triglycerides were measured by colorimetric assay kits (Thermo Fisher Scientific, Middletown, VA). ApoA1 and apoB were measured by nephelometric immunoassays (BNII; Siemens Healthcare Diagnostics, Deerfield, IL). Platelet‐activating factors acetylhydrolase activity (PAH) and secretory phospholipase A2 levels were measured by kits from Cayman Chemical (Ann Arbor, MI). Lecithin‐cholesterol acyltransferase, and oxidized low‐density lipoprotein levels were measured with commercially available ELISA kits from ALPCO (Salem, NH), and Mercodia (Winston Salem, NC), respectively. Paraoxonase arylesterase activity was determined by using phenyl acetate as substrate as described by Furlong et al.20
Percentage of CD19 B‐cells was assessed using quantitative flow cytometry performed at the San Francisco General Hospital reference laboratory (ARUP Laboratories, test code 0095920).
Measurements of RA Disease Activity
RA disease activity was assessed using the following standardized measures: the Disease Activity Score 28‐joints (DAS28), the Clinical Disease Activity Index, and the Simplified Disease Activity Index.21–24 Each provides a numerical score of activity with defined cut points for remission and low, moderate, or severe activity.21–24 The DAS28 is based on the patient global assessment of disease, physician‐determined tender and swollen joint counts (28 joints), and a measure of inflammation: either the erythrocyte sedimentation rate (DAS28‐ESR) or the serum level of C‐reactive protein (DAS28‐CRP).21,24 The Clinical Disease Activity Index uses both patient and physician global assessments and the tender and swollen 28 joint counts (but no measure of inflammation).22 The Simplified Disease Activity Index incorporates CRP but otherwise is identical to the Clinical Disease Activity Index.23
Endothelial Function Studies
High‐resolution ultrasound and Doppler velocity measurements of the right brachial artery were performed using a 10‐MHz linear array probe and the GE Vivid 7 Imaging System. A blood pressure cuff was inflated to suprasystolic pressures on the forearm for 5 minutes, and the change in brachial artery diameter was measured during reactive hyperemia 1 minute following cuff deflation (FMD). Nitroglycerin‐mediated dilation was measured 3 minutes after administration of 0.4 mg sublingual nitroglycerin. Ten patients underwent repeat scans within 14 days of study enrollment prior to rituximab infusion with a difference in FMD of 0.01% (95% CI −0.06 to +0.04%, P=0.99). We also assessed microvascular function as maximal reactive hyperemia from the mean velocity–time integral of the Doppler signal of the first 3 complete, consecutive beats after cuff release, a measure that strongly correlates with CV disease risk.12,25 Ten individuals also had repeat assessment of hyperemic velocity 14 days apart at baseline before rituximab infusion with a mean difference in hyperemic velocity of −0.06 cm (95% CI −0.58 to 0.46, P=0.82). The coefficient of variation was 0.65%, and the intraclass correlation coefficient was 0.99.
Carotid IMT Studies
We used the GE Vivid 7 Imaging System and a 10‐MHz linear array probe to perform carotid artery IMT measurements. We used a protocol similar to that used in the Atherosclerosis Risk in Communities study, which includes measurements of the near and far wall of the common carotid artery, the bifurcation region, and the internal carotid artery.26–28 Our scanning protocol, reproducibility, and measurement techniques have been previously described.29
Statistical Analysis
Demographic and clinical characteristics were summarized at baseline using median and interquartile range for continuous parameters, and frequency and percentage for categorical parameters. We analyzed changes over time in FMD and other continuous measures using linear mixed models with a heterogeneous first‐order autoregressive structure for the within‐subject errors. There was a suggestion that the effects of time were nonlinear for several measures, including FMD; we incorporated nonlinear effects of time using linear splines that allowed different slopes for the first study period (weeks 0 to 12) and the second study period (weeks 12 to 24). We did not adjust for multiple comparisons, because there were many inter‐related positive results that reinforced each other by fitting together in a coherent pattern. Right‐skewed variables such as hsCRP and triglycerides were log‐transformed to normalize their distributions. We also used Spearman coefficients to evaluate correlations between continuous measures. All statistical analyses were conducted with the SAS system, version 9.3 (SAS Institute, Inc, Cary, NC).
Results
Patient Characteristics
Twenty‐four individuals were screened for the study; 2 patients decided not to enroll, another individual did not enroll due to a possible past history of heart failure, and 1 individual withdrew after the first infusion. Twenty patients completed the study; their median age was 53 years (interquartile range 46 to 62) and 95% were female (Table 1). Forty percent of participants had hypertension, 25% hyperlipidemia, 20% were diabetic, and 25% were current smokers. The median ESR and CRP were 43.5 mm/h (IQR 31.5 to 59.5) and 9.1 mg/L (interquartile range 6.5 to 46.7), respectively, and 90% of participants were using disease‐modifying antirheumatic drugs. At week 24, circulating levels of CD19+ B‐cells were undetectable or below normal in all but 1 patient.
Table 1.
Baseline Demographic and Clinical Characteristics
| Parameter | RA Patients (n=20) |
|---|---|
| Age, y | 53 (46, 62) |
| RA disease duration, y | 12 (6.5 to 14.75) |
| Female, n (%) | 19 (95) |
| Race | |
| Hispanic, n (%) | 17 (85) |
| Black, n (%) | 1 (5) |
| Other, n (%) | 2 (10) |
| Rheumatoid factor, n (%) | 17 (85) |
| Anti‐CCP positive, n (%) | 17 (89) |
| Radiographic changes, n (%) | 14 (70) |
| Prior CAD, n (%) | 1 (5) |
| Hypertension, n (%) | 8 (40) |
| Hyperlipidemia, n (%) | 5 (25) |
| Diabetes mellitus, n (%) | 4 (20) |
| Current smoking, n (%) | 5 (25) |
| Ever smoked, n (%) | 6 (30) |
| Family history of CAD, n (%) | 3 (15) |
| ASA/NSAID, n (%) | 12 (60) |
| Taking prednisone, n (%) | 16 (80) |
| Taking methotrexate, n (%) | 12 (60) |
| BMI, kg/m2 | 33.5 (27.6, 35.8) |
| DAS28‐ESR | 6.6 (6.1, 7.1) |
| DAS28‐CRP | 6.0 (5.2, 6.6) |
| Swollen joint count | 13.3 (10.0, 17.0) |
| Tender joint count | 12.8 (7.0, 16.0) |
| DMARD use, % | 18 (90) |
Values are represented as medians (interquartile range), unless otherwise noted. Anti‐CCP positive indicates anti‐cyclic citrullinated peptide antibodies; ASA/NSAID, use of aspirin or non‐steroidal anti‐inflammatory drugs; BMI, body mass index; CAD, coronary artery disease; DAS28‐CRP, disease activity score 28‐joints based on C‐reactive protein; DAS28‐ESR, disease activity score 28‐joints based on erythrocyte sedimentation rate; DMARD, disease‐modifying antirheumatic drugs; RA, rheumatoid arthritis.
Changes in Endothelial Function, Inflammatory Markers, Lipid Levels, and Disease Activity
The FMD and hyperemic velocity at baseline, week 12, and week 24 are shown in Figure 1A and Table 2. At 12 weeks of the study, we observed improvements from baseline in %FMD (from mean±SE: 4.5±0.4 to 6.5±0.6, P<0.0001) (Figure 1A), disease activity (including DAS score, physician/patient global, and tender/swollen joint counts) (Table 3 and Figure 1B), and inflammatory markers including ESR and hsCRP (as shown in Table 4). At week 24, there was a decline in %FMD toward baseline (5.2±0.6, P=0.25 versus baseline, P=0.0087 versus week 12). By contrast as shown in Tables 3 and 4, and Figure 1B, all assessments of disease activity and serologic markers of inflammation showed sustained improvement from baseline to 24 weeks. Hyperemic velocity improved numerically from baseline to week 12 (mean±SE: 54.8±4.5 versus 66.9±5.1 cm/s, P=0.065), but declined by week 24 to levels similar to baseline (mean±SE: 56.4±4.2, P=0.68, Figure 2). Results were similar in a sensitivity analysis in which we excluded the 1 male participant (data not shown). We found no change in mean carotidIMT from baseline to week 24 (mean±SE: 0.97±0.06 versus 0.98±0.06 mm, P=0.89). Likewise, there were no statistically significant changes in IMT from baseline to week 24 in either the bifurcation region, internal carotid, or common carotid regions (data not shown).
Figure 1.
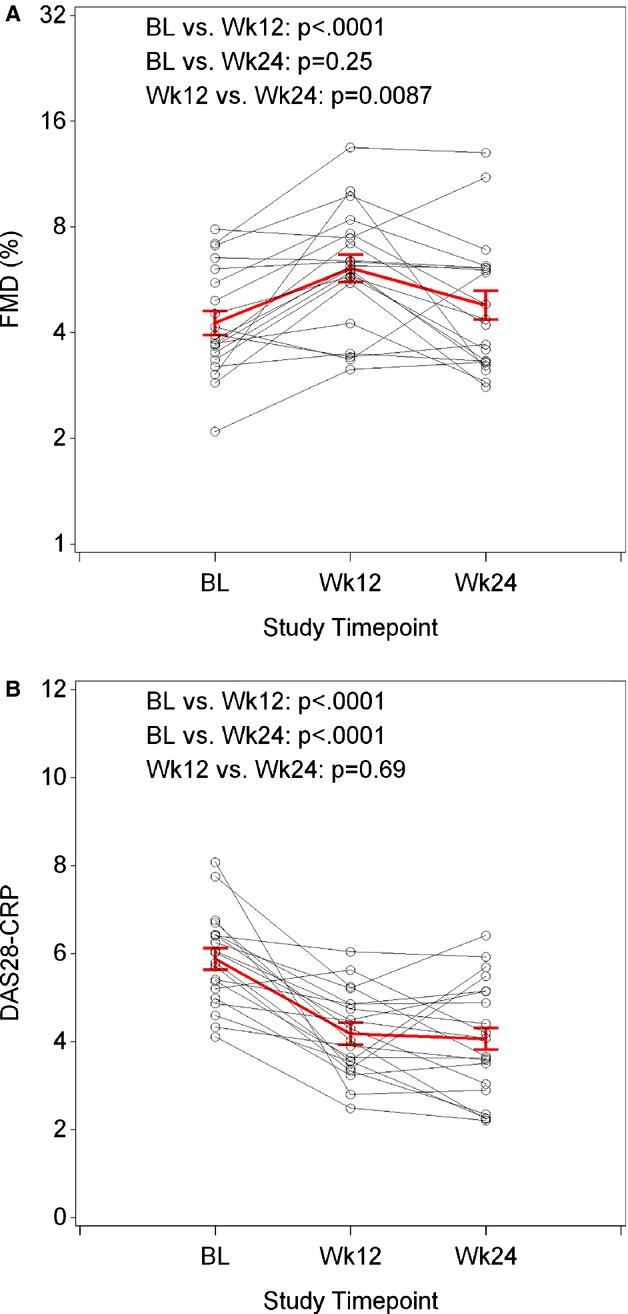
Changes in FMD from baseline to week 24 (A) and DAS28 CRP (B) following B‐cell depletion with rituximab. Following rituximab therapy, FMD improved significantly at week 12 as compared to baseline; however, by week 24, the FMD was no longer significantly different from baseline. In contrast, assessment of disease activity (DAS28 using CRP) improved significantly at week 12 as compared to baseline and remained improved at week 24. Red=overall raw or geometric mean±SE; black=individual participants. P‐values from linear mixed models, controlling for repeated measures over time. BL indicates baseline; CRP, C‐reactive protein; DAS, disease activity score; FMD, flow‐mediated dilation.
Table 2.
Assessments of Endothelial‐Dependent Vasodilation (FMD), Endothelial Independent Vasodilation (NMD), and HV and Changes From Baseline
| Parameter | Statistic | Baseline (n=20) | Week 12 (n=20) | Week 24 (n=20) |
|---|---|---|---|---|
| Baseline diameter (mm) | Median (IQR) | 3.4 (3.3 to 3.8) | 3.4 (3.2 to 3.7) | 3.4 (3.3 to 3.7) |
| Change from baseline | P=0.27 | P=0.86 | ||
| FMD, % | Median (IQR) | 3.9 (3.4 to 5.8) | 6.1 (4.9 to 7.6) | 4.3 (3.3 to 6.1) |
| Change from baseline | P<0.0001 | P=0.25 | ||
| NMD, % | Median (IQR) | 13.0 (11.9 to 16.5) | 16.7 (13.3 to 19) | 13.8 (11.3 to 15.9) |
| Change from baseline | P=0.021 | P=0.46 | ||
| HV, cm/s | Median (IQR) | 57.7 (38.6 to 68.0) | 58.0 (50.6 to 82.2) | 59.4 (49.8 to 65.6) |
| Change from baseline | P=0.065 | P=0.68 |
Values are represented as medians (interquartile range), unless otherwise noted. P values reported represent change from baseline. FMD indicates flow‐mediated vasodilation; HV, hyperemic velocity; IQR, interquartile range; NMD, nitroglycerin‐mediated vasodilation.
Table 3.
Assessments of Disease Category and Changes From Baseline
| Parameter | Statistic | Baseline (n=20) | Week 12 (n=20) | Week 24 (n=20) |
|---|---|---|---|---|
| Patient global | Median (IQR) | 70.5 (61.0 to 88.5) | 36.0 (23.0 to 56.0) | 50.5 (19.0 to 71.5) |
| Change from baseline | P<0.0001 | P=0.0007 | ||
| Physician global | Median (IQR) | 35.5 (32.0 to 43.5) | 24.0 (20.0 to 28.0) | 27.0 (13.5 to 31.5) |
| Change from baseline | P=0.0006 | P=0.0002 | ||
| Swollen joint count | Median (IQR) | 12.5 (10.0 to 17.0) | 7.0 (5.0 to 10.0) | 7.0 (5.0 to 13.0) |
| Change from baseline | P<0.0001 | P=0.0002 | ||
| Tender joint count | Median (IQR) | 12.0 (7.0 to 16.0) | 3.0 (2.0 to 7.0) | 2.0 (0.0 to 9.0) |
| Change from baseline | P<0.0001 | P<0.0001 | ||
| SDAI | Median (IQR) | 37.9 (31.5 to 45.8) | 15.7 (14.0 to 30.5) | 17.7 (11.5 to 31.0) |
| Change from baseline | P<0.0001 | P<0.0001 | ||
| CDAI | Median (IQR) | 35.0 (26.8 to 45.2) | 15.2 (12.4 to 28.6) | 17.2 (10.8 to 30.3) |
| Change from baseline | P<0.0001 | P<0.0001 | ||
| DAS‐ESR | Median (IQR) | 6.7 (6.1 to 7.1) | 4.7 (4.4 to 5.9) | 4.4 (3.2 to 6.0) |
| Change from baseline | P<0.0001 | P<0.0001 | ||
| DAS‐CRP | Median (IQR) | 5.9 (5.1 to 6.4) | 4.0 (3.4 to 4.9) | 3.9 (3.0 to 5.1) |
| Change from baseline | P<0.0001 | P<0.0001 |
Values are represented as medians (interquartile range), unless otherwise noted. P values reported represent change from baseline. CDAI indicates clinical disease activity index; DAS‐CRP, disease activity score based on C‐reactive protein; DAS‐ESR, disease activity score based on erythrocyte sedimentation rate; IQR, interquartile range; SDAI, simple disease activity index.
Table 4.
Assessments of Inflammatory and Coagulation Markers and Changes From Baseline
| Parameter | Statistic | Baseline (n=20) | Week 12 (n=20) | Week 24 (n=20) |
|---|---|---|---|---|
| hsCRP, mg/L | Median (IQR) | 9.1 (6.5 to 46.7) | 5.4 (4.0 to 16.1) | 5.7 (2.9 to 9.3) |
| Change from baseline | P=0.14 | P=0.012 | ||
| ESR, mm/h | Median (IQR) | 43.5 (31.5 to 59.5) | 33.0 (23.0 to 51.0) | 31.0 (18.0 to 37.5) |
| Change from baseline | P=0.0031 | P=0.0002 | ||
| SAA, mg/L | Median (IQR) | 41.6 (11.8 to 282.9) | 19.9 (7.9 to 62.5) | 14.7 (6.6 to 27.8) |
| Change from baseline | P=0.0065 | P=0.0029 | ||
| IL‐6, pg/mL | Median (IQR) | 5.5 (1.8 to 35.7) | 4.4 (1.7 to 12.9) | 2.3 (1.5 to 4.8) |
| Change from baseline | P=0.14 | P=0.0098 | ||
| Fibrinogen, mg/dL | Median (IQR) | 460 (357 to 615) | 473 (334 to 551) | 415 (339 to 491) |
| Change from baseline | P=0.43 | P=0.40 |
Values are represented as medians (interquartile range), unless otherwise noted. P values reported represent change from baseline. ESR indicates erythrocyte sedimentation rate; hsCRP, high‐sensitivity C‐reactive protein; IL‐6, interleukin 6; IQR, interquartile range; SAA, serum amyloid A.
Figure 2.

Change in hyperemic velocity from baseline to week 24 following B‐cell depletion with rituximab. After rituximab therapy, there was a trend toward improved microvascular function as assessed by hyperemic velocity from baseline to week 12 that was no longer present when comparing baseline to week 24. Red=overall mean±SE; black=individual participants. P‐values from linear mixed models, controlling for repeated measures over time. BL indicates baseline.
We observed modest but statistically significant increases in triglycerides and total cholesterol, as well as a transient increase in calculated LDL (Table 5). A similar trend was seen for HDL cholesterol from baseline to weeks 12 and 24, although the change did not reach statistical significance. Apo A1, apo B, and oxidized LDL did not change significantly from baseline to week 12 or from baseline to week 24. Paraoxonase arylesterase activity and PAH increased significantly from baseline to week 12. A reduction was seen at week 24 for paraoxonase arylesterase activity, while levels of PAH remained stable. There was a trend toward increases for lecithin‐cholesterol acyltransferase at both time points.
Table 5.
Assessments of Lipid Values and Changes From Baseline
| Parameter | Statistic | Baseline (n=20) | Week 12 (n=20) | Week 24 (n=20) |
|---|---|---|---|---|
| sPLA2, ng/mL | Median (IQR) | 16.1 (6.0 to 23.4) | 15.0 (6.5 to 33.3) | 10.6 (8.1 to 12.8) |
| Change from baseline | P=0.64 | P=0.19 | ||
| T cholesterol, mg/dL | Median (IQR) | 174 (145 to 224) | 196 (173 to 249) | 208 (163 to 258) |
| Change from baseline | P=0.0061 | P=0.066 | ||
| HDL‐c, mg/dL | Median (IQR) | 43.6 (35.1 to 52.8) | 48.1 (39.4 to 55.6) | 46.0 (37.8 to 55.6) |
| Change from baseline | P=0.076 | P=0.11 | ||
| TG, mg/dL | Median (IQR) | 113.4 (91.2 to 171.7) | 160.1 (96.2 to 186.5) | 155.6 (129.2 to 215.5) |
| Change from baseline | P=0.025 | P=0.012 | ||
| Non‐HDL, mg/dL | Median (IQR) | 138.1 (101.2 to 181.1) | 147.6 (125.1 to 200.1) | 151.7 (112.7 to 190.9) |
| Change from baseline | P=0.0090 | P=0.12 | ||
| LDL calculated, mg/dL | Median (IQR) | 104.4 (79.1 to 144.2) | 115.2 (100.0 to 167.0) | 108.6 (89.3 to 159.8) |
| Change from baseline | P=0.020 | P=0.34 | ||
| Apo A1, mg/dL | Median (IQR) | 147 (132 to 167) | 155 (141 to 170) | 155 (138 to 170) |
| Change from baseline | P=0.34 | P=0.085 | ||
| Apo B, mg/dL | Median (IQR) | 93.0 (71.8 to 108.0) | 94.9 (84.3 to 106.4) | 91.7 (77.6 to 111.9) |
| Change from baseline | P=0.21 | P=0.65 | ||
| PON Aryl, μ/min per milliliter | Median (IQR) | 90.0 (70.4 to 94.3) | 98.3 (82.8 to 101.5) | 94.7 (77.1 to 101.9) |
| Change from baseline | P=0.015 | P=0.12 | ||
| OxLDL, μ/L | Median (IQR) | 57.6 (46.8 to 63.5) | 58.1 (46.6 to 67.4) | 59.6 (46.4 to 76.5) |
| Change from baseline | P=0.50 | P=0.11 | ||
| LCAT, μg/mL | Median (IQR) | 10.4 (9.0 to 11.2) | 12.0 (10.0 to 12.8) | 10.9 (9.6 to 11.9) |
| Change from baseline | P=0.067 | P=0.088 | ||
| PAH, nmol/min per milliliter | Median (IQR) | 8.4 (8.4 to 12.7) | 10.6 (8.4 to 12.7) | 10.6 (8.4 to 12.7) |
| Change from baseline | P=0.043 | P=0.083 |
Values are represented as medians (interquartile range), unless otherwise noted. P values reported represent change from baseline. Apo A1 indicates apolipoprotein A1; Apo B, apolipoprotein B; HDL‐c, high‐density lipoprotein‐cholesterol; IQR, interquartile range; LCAT, lecithin‐cholesterol acyltransferase; LDL, low‐density lipoprotein; OxLDL, oxidized low‐density lipoprotein; PAH, platelet‐activating factor acetylhydrolase; PON Aryl, paraoxonase arylesterase; sPLA2, secretory phospholipase A2; TG, triglycerides; T cholesterol, total cholesterol.
Predictors of Baseline Endothelial Function and Change in Endothelial Function
We evaluated whether baseline measurements of hyperemic velocity, serum inflammatory markers, and RA disease activity correlated with baseline FMD and change in FMD over 12 weeks (Table 6). We also determined whether the change in any of these measurements from baseline to week 12 correlated with change in FMD over the same time period (Table 6). At baseline, hyperemic velocity and clinical assessments of RA disease severity including patient global assessment and Clinical Disease Activity Index were significantly associated with more impaired FMD (r=−0.37, P=0.004). The Simplified Disease Activity Index was also associated with lower FMD, although the association did not reach statistical significance (r=−0.25, P=0.055). We found negative correlations of changes in inflammation with changes in FMD for hsCRP, serum amyloid A, and fibrinogen in the expected directions, but while the effects sizes were substantial, the associations did not reach statistical significance. Changes in levels of hyperemic velocity and clinical assessments of disease activity were not significantly associated with changes in FMD over 12 weeks (Table 6). Baseline measures showed little correlation with changes from baseline to week 12 FMD.
Table 6.
Correlation of Hyperemic Velocity, Inflammatory Markers, and Clinical Variables With FMD
| Variable | Correlation of Baseline Measures With Baseline FMD | Correlation of Change in Measures From Baseline to Week 12 With Change From Baseline to Week 12 FMD | Correlation of Baseline Measures With Change From Baseline to Week 12 FMD |
|---|---|---|---|
| Corr (95% CI) | Corr (95% CI) | Corr (95% CI) | |
| Hyperemic velocity | 0.26 (0.01, 0.49), P=0.041 | −0.07 (−0.49, 0.39), P=0.78 | 0.17 (−0.29, 0.57), P=0.46 |
| Inflammatory markers | |||
| CRP | 0.18 (−0.08, 0.42), P=0.16 | −0.28 (−0.65, 0.20), P=0.25 | 0.38 (−0.09, 0.71), P=0.11 |
| IL‐6 | 0.24 (−0.01, 0.47), P=0.062 | −0.03 (−0.46, 0.42), P=0.91 | 0.30 (−0.16, 0.66), P=0.20 |
| SAA | 0.13 (−0.13, 0.37), P=0.34 | −0.35 (−0.68, 0.11), P=0.13 | 0.29 (−0.17, 0.65), P=0.21 |
| sPLA2 | 0.08 (−0.18, 0.33), P=0.53 | −0.17 (−0.58, 0.31), P=0.48 | 0.35 (−0.12, 0.70), P=0.14 |
| Fibrinogen | −0.08 (−0.33, 0.18), P=0.53 | −0.41 (−0.73, 0.06), P=0.085 | 0.14 (−0.34, 0.56), P=0.57 |
| Clinical variables | |||
| DAS28‐ESR | −0.25 (−0.48, 0.01), P=0.057 | −0.08 (−0.51, 0.39), P=0.75 | −0.08 (−0.51, 0.37), P=0.73 |
| DAS28‐CRP | −0.20 (−0.44, 0.05), P=0.12 | −0.28 (−0.65, 0.20), P=0.25 | −0.03 (−0.46, 0.42), P=0.91 |
| Physician global | −0.20 (−0.43, 0.06), P=0.13 | −0.12 (−0.55, 0.35), P=0.62 | 0.01 (−0.43, 0.45), P=0.96 |
| Patient global | −0.37 (−0.57, −0.12), P=0.0044 | −0.08 (−0.52, 0.39), P=0.74 | −0.21 (−0.59, 0.26), P=0.38 |
| Tender joint count | −0.23 (−0.46, 0.03), P=0.084 | −0.18 (−0.59, 0.29), P=0.45 | −0.12 (−0.53, 0.34), P=0.61 |
| Swollen joint count | −0.19 (−0.43, 0.07), P=0.15 | 0.07 (−0.40, 0.50), P=0.79 | 0.08 (−0.37, 0.51), P=0.73 |
| ESR | 0.09 (−0.16, 0.34), P=0.47 | −0.35 (−0.68, 0.11), P=0.14 | 0.21 (−0.26, 0.59), P=0.38 |
| CDAI | −0.26 (−0.49, −0.01), P=0.044 | −0.05 (−0.50, 0.41), P=0.82 | −0.09 (−0.51, 0.37), P=0.71 |
| SDAI | −0.25 (−0.48, 0.01), P=0.055 | −0.08 (−0.51, 0.39), P=0.76 | −0.09 (−0.51, 0.37), P=0.72 |
This table reports Spearman correlation coefficients for baseline measures with baseline FMD and changes from baseline to week 12 in each measure with the change from baseline to week 12 in FMD. CDAI indicates clinical disease activity index; CRP, C‐reactive protein; DAS28‐CRP, disease activity score 28‐joints based on C‐reactive protein; DAS28‐ESR, disease activity score 28‐joints based on erythrocyte sedimentation rate; FMD, flow‐mediated dilation; IL, interleukin; SAA, serum amyloid A; SDAI, simplified disease activity index; sPLA2, secretory phospholipase A2.
Discussion
In this study, we demonstrate that among individuals with active RA, a single course of B‐cell depletion treatment with rituximab had a significant but temporally differential impact on endothelial function compared to markers of inflammation and RA disease activity over the course of 24 weeks. We also demonstrate that higher levels of clinical disease activity correlate with more impaired endothelial function prior to rituximab therapy in this particularly severe population of RA patients. However, while FMD improved on rituximab therapy at week 12, this improvement did not correlate with changes in disease activity, and a negative correlation was found with inflammatory markers that did not quite reach statistical significance. While treatment with rituximab improved both FMD and hyperemic velocity at 12 weeks, these findings were not sustained at 24 weeks even though CD19+ B‐cells remained depleted. While the improvement in several inflammatory markers was sustained, they were not normalized, as is common in RA therapy. These results suggest that both subjective clinical assessments of RA disease activity and objective measurements of inflammatory biomarkers may not fully reflect the degree of impaired endothelial function and CV risk in these rituximab‐treated RA patients. While rituximab therapy effectively suppresses RA disease activity and markers of inflammation over a 24‐week time period, our results suggest that CV risk may not be similarly reduced during that entire time period, and that other biomarkers are needed to better assess CV risk in order to guide therapy in this population of RA patients.
CV disease is the main cause of increased mortality among individuals with RA,1,30–32 resulting in diminished lifespan despite improvements in longevity in the general population. Prior studies have demonstrated that RA is associated with increased subclinical vascular disease as assessed by carotid IMT33–34 as well as endothelial dysfunction using flow‐mediated vasodilation of the brachial artery.13,34–35 The European League Against Rheumatism has published guidelines on CV risk management in patients with RA that include the recommendation to control RA disease activity for the purpose of lowering CV risk,30 with the best evidence supporting the use of methotrexate and anti‐TNF therapy. Our findings also suggest a possible role for rituximab in reducing RA disease activity and CV risk, but with several caveats. First, a single course of rituximab improves endothelial function in most patients at least up to 12 weeks but appears to lose most of its apparent benefit on vascular function by 6 months, the time at which current guidelines suggest retreating RA patients with additional courses of rituximab therapy. Second, RA disease activity scores and inflammatory markers, which are used to assess the severity of RA, were unreliable predictors of CV risk in this patient population, suggesting the need for improved biomarkers that better correlate with endothelial function and ultimately, CV risk, regardless of form of RA therapy. Third, rituximab treatment was associated with a modest increase in triglycerides and a transient increase in total cholesterol and calculated LDL cholesterol, which may increase CV risk.
Rituximab is a monoclonal antibody that depletes peripheral CD20+ B‐cells and is administered as a single course of 2 infusions of 1000 mg each.18 Retreatment is suggested at 6‐month intervals or when symptoms recur. Two prior studies have evaluated the role of rituximab and FMD. A small study of 6 RA patients with active disease refractory to TNF‐α blockade demonstrated that treatment with rituximab was associated with improved FMD assessed at week 2 and at 6 months of continued therapy.36 The improvement in FMD was associated with a decrease in CRP and DAS‐28 score.36 This same group evaluated 7 patients using anti‐TNFα therapy and demonstrated a transient improvement in FMD 2 days following infliximab infusion that returned to baseline at 4 weeks.37 Another even smaller study of 5 RA patients without known CV disease, diabetes mellitus, hypertension, cigarette smoking, or renal failure treated with rituximab demonstrated improved FMD and decreased carotid IMT at weeks 2, 6, and 16.38 In that study, increases in total cholesterol and elevations in HDL cholesterol were noted, although absolute values were not presented. We did not demonstrate any significant change in IMT in our study over 24 weeks, and a longer follow‐up period of at least 1 year would be needed to determine the potential impact of rituximab on carotid IMT. Our study was larger (n=20) than the other 2 studies combined and included patients who were older and had a longer disease duration of RA (53 years, RA disease duration of 11 years) compared to the study by Kerekes et al (n=5, age of 41.6 years, duration of RA of 5.8 years, respectively).38 In contrast, our patients were younger and had shorter disease duration than those studied by Gonzalez‐Juanatey (n=6, median age 65 years, duration of RA 16 years).36 We included individuals with stable, low doses of prednisone in our study, while none of the patients in the study by Kerekes et al were on corticosteroids.38 In addition, the time points at which endothelial function was performed in our study differed slightly from the other studies, as we performed evaluations at baseline, week 12, and week 24.36,38 Impaired endothelial function was evident at baseline with similar median FMD across all 3 studies.
The mechanism by which rituximab improves RA disease activity and reduces CV risk as evidenced by improvements in endothelial function is not fully known. A single course of rituximab resulted in complete and sustained peripheral B‐cell depletion in our study population through at least week 24. The mechanism(s) responsible for this improvement in RA is unknown but may be multifactorial. Depletion of B‐cells may reduce the production of B‐cell‐dependent cytokines that drive RA disease activity, inflammation, and endothelial dysfunction. Because B‐cells also express major histocompatibility complex class II molecules and serve as effective antigen‐presenting cells, their depletion may downregulate autoantigen presentation that perpetuates aberrant immune responses. Finally, short‐lived plasma cells may serve as a source of pathogenic immune complexes that induce joint inflammation in RA, and rituximab may eliminate a population of B‐cells that would otherwise mature to replace those senescent plasma cells.
Rituximab‐mediated peripheral B‐cell depletion was sustained through week 24, and markers of inflammation including ESR, hsCRP, interleukin‐6, serum amyloid A, and RA disease activity assessed by DAS28 were significantly improved through week 24 as well. Rituximab‐treated individuals developed modest increases in lipids, including triglycerides at weeks 12 and 24, LDL cholesterol, paraoxonase arylesterase activity, and lecithin‐cholesterol acyltransferase at week 12 and a trend toward increased HDL at weeks 12 and 24. As LDL, paraoxonase arylesterase activity, and HDL are negative acute‐phase reactants, increases in these lipids following rituximab treatment are at least partly consistent with recovery of lipid levels from an artificially depressed state related to baseline systemic inflammation. In contrast, the increase in triglycerides and PAH are the opposite of what might be expected.
However, despite the improvements in DAS28 scores and inflammatory markers, the improvement in FMD seen at week 12 was no longer present at week 24. Although we confirmed continued peripheral B‐cell depletion at week 24, we did not study the degree to which B‐cells were depleted from synovial tissue or other possible sanctuary sites. These sanctuaries of B‐cells may not be represented by clinical assessment of RA disease activity and thus may contribute to ongoing endothelial dysfunction and CV risk among individuals with RA.
The association between markers of inflammation and FMD in the literature is largely mixed,39 with some larger studies demonstrating an inverse correlation between hsCRP, interleukin‐6, intercellular adhesion molecule‐1, and FMD, which weakened after adjustment for traditional risk factors,40 while others showed no correlation.41 Our finding of failure to sustain improvements in FMD, despite reduction of inflammation as evidenced by sustained decreases in several, but not all, inflammatory biomarkers in rituximab‐treated individuals, raises questions about our current understanding of inflammatory pathways, systemic biomarkers used to assess inflammation, and FMD.
The T‐cell component of the immune system has largely been implicated in the development and progression of atherosclerosis.42–44 In contrast, the role of B‐cells and atherosclerosis remains controversial. B2 cells, which make up the majority of circulating B‐cells, produce proinflammatory cytokines,45–46 including TNF‐α and interferon‐γ, which can accelerate atherosclerosis. Among individuals with chronic inflammation such as RA patients, B‐cells may play a unique role in RA‐associated atherosclerosis. Postmortem studies of individuals with RA demonstrate a predominance of B‐lymphocytes within atherosclerotic plaque as compared to individuals without RA who have T‐cell infiltration.47 Animal studies have shown that anti‐CD20 treatment is associated with reductions in atherosclerosis,48 which may be due to changes in immune responses of T‐cells decreasing interferon‐γ levels and increasing interleukin‐17.49 Certain B‐cell populations can promote the expansion of dendritic cells and shift the immunologic response to a TH1, resulting in atherosclerosis.50
In summary, we demonstrate that B‐cell depletion following a single course of rituximab improved endothelial function for at least 12 weeks in RA patients with active and difficult‐to‐control disease. While improvements in both clinical disease activity and most inflammatory markers were sustained at 24 weeks following a single course of rituximab, the observed improvement in endothelial function was transient, and changes in endothelial function were not reliably reflected in either clinical assessment scores or conventional markers of inflammation. Both FMD and hyperemic velocity may be more sensitive indices for disease recurrence in sanctuary sites and may imply that more frequent treatment with rituximab (as opposed to the dosing regimen of 6 months) may be needed to reduce CV risk, a hypothesis that will require larger studies with clinical end points to definitively establish. Our study also demonstrates that RA disease activity and inflammatory markers are not strongly correlated with FMD in patients who have received rituximab therapy, suggesting that different markers may be needed to ascertain CV risk in the setting of RA.
Strengths and Limitations
The size of this study was modest, yet it is the largest study to focus on the vascular effects of rituximab therapy to date. As all individuals enrolled in the study met criteria for rituximab therapy and had active RA, it was not ethical to administer placebo in lieu of treatment. In the absence of placebo, we performed repeat baseline studies of FMD 2 weeks apart prior to rituximab administration in a subset of patients, which demonstrated that FMD remained stable and was highly reproducible. A limitation of this study is that nearly all participants were female; therefore, we were unable to determine whether there were gender differences in the effect of rituximab on endothelial function and inflammation.
Sources of Funding
This research was supported by an investigator‐initiated award from Genentech (Hsue), an American College of Rheumatology Within our Reach Grant for Rheumatoid Arthritis (Grunfeld), the Rosalind Russell–Ephraim P. Engleman Medical Research Center (Graf), and the Albert L. and Janet A. Schultz Supporting Foundation; and with resources and the use of facilities of the Veterans Affairs Medical Centers of San Francisco.
Disclosures
P.Y.H. has received honorarium from Gilead and Amgen.
References
- 1.Gabriel SE. Cardiovascular morbidity and mortality in rheumatoid arthritis. Am J Med. 2008; 121:S9-S14. [DOI] [PMC free article] [PubMed] [Google Scholar]
- 2.Solomon DH, Goodson NJ, Katz JN, Weinblatt ME, Avorn J, Setoguchi S, Canning C, Schneeweiss S. Patterns of cardiovascular risk in rheumatoid arthritis. Ann Rheum Dis. 2006; 65:1608-1612. [DOI] [PMC free article] [PubMed] [Google Scholar]
- 3.Gonzalez‐Gay MA, Gonzalez‐Juanatey C, Miranda‐Filloy JA, Garcia‐Porrua C, Llorca J, Martin J. Cardiovascular disease in rheumatoid arthritis. Biomed Pharmacother. 2006; 60:673-677. [DOI] [PubMed] [Google Scholar]
- 4.del Rincon ID, Williams K, Stern MP, Freeman GL, Escalante A. High incidence of cardiovascular events in a rheumatoid arthritis cohort not explained by traditional cardiac risk factors. Arthritis Rheum. 2001; 44:2737-2745. [DOI] [PubMed] [Google Scholar]
- 5.Sattar N, McCarey DW, Capell H, McInnes IB. Explaining how “high‐grade” systemic inflammation accelerates vascular risk in rheumatoid arthritis. Circulation. 2003; 108:2957-2963. [DOI] [PubMed] [Google Scholar]
- 6.Rodriguez‐Rodriguez L, Gonzalez‐Juanatey C, Palomino‐Morales R, Vazquez‐Rodriguez TR, Miranda‐Filloy JA, Fernandez‐Gutierrez B, Llorca J, Martin J, Gonzalez‐Gay MA. TNFA ‐308 (rs1800629) polymorphism is associated with a higher risk of cardiovascular disease in patients with rheumatoid arthritis. Atherosclerosis. 2011; 216:125-130. [DOI] [PubMed] [Google Scholar]
- 7.Libby P. Role of inflammation in atherosclerosis associated with rheumatoid arthritis. Am J Med. 2008; 12110 suppl 1:S21-S31. [DOI] [PubMed] [Google Scholar]
- 8.Choi HK, Hernan MA, Seeger JD, Robins JM, Wolfe F. Methotrexate and mortality in patients with rheumatoid arthritis: a prospective study. Lancet. 2002; 359:1173-1177. [DOI] [PubMed] [Google Scholar]
- 9.Barnabe C, Martin BJ, Ghali WA. Systematic review and meta‐analysis: anti‐tumor necrosis factor alpha therapy and cardiovascular events in rheumatoid arthritis. Arthritis Care Res (Hoboken). 2011; 63:522-529. [DOI] [PubMed] [Google Scholar]
- 10.Celermajer DS, Sorensen KE, Gooch VM, Spiegelhalter DJ, Miller OI, Sullivan ID, Lloyd JK, Deanfield JE. Non‐invasive detection of endothelial dysfunction in children and adults at risk of atherosclerosis. Lancet. 1992; 340:1111-1115. [DOI] [PubMed] [Google Scholar]
- 11.Corretti MC, Anderson TJ, Benjamin EJ, Celermajer D, Charbonneau F, Creager MA, Deanfield J, Drexler H, Gerhard‐Herman M, Herrington D, Vallance P, Vita J, Vogel R. Guidelines for the ultrasound assessment of endothelial‐dependent flow‐mediated vasodilation of the brachial artery: a report of the international brachial artery reactivity task force. J Am Coll Cardiol. 2002; 39:257-265. [DOI] [PubMed] [Google Scholar]
- 12.Anderson TJ, Charbonneau F, Title LM, Buithieu J, Rose MS, Conradson H, Hildebrand K, Fung M, Verma S, Lonn EM. Microvascular function predicts cardiovascular events in primary prevention: long‐term results from the firefighters and their endothelium (FATE) study. Circulation. 2011; 123:163-169. [DOI] [PubMed] [Google Scholar]
- 13.Vaudo G, Marchesi S, Gerli R, Allegrucci R, Giordano A, Siepi D, Pirro M, Shoenfeld Y, Schillaci G, Mannarino E. Endothelial dysfunction in young patients with rheumatoid arthritis and low disease activity. Ann Rheum Dis. 2004; 63:31-35. [DOI] [PMC free article] [PubMed] [Google Scholar]
- 14.Hurlimann D, Forster A, Noll G, Enseleit F, Chenevard R, Distler O, Bechir M, Spieker LE, Neidhart M, Michel BA, Gay RE, Luscher TF, Gay S, Ruschitzka F. Anti‐tumor necrosis factor‐alpha treatment improves endothelial function in patients with rheumatoid arthritis. Circulation. 2002; 106:2184-2187. [DOI] [PubMed] [Google Scholar]
- 15.Edwards JC, Cambridge G. Sustained improvement in rheumatoid arthritis following a protocol designed to deplete B lymphocytes. Rheumatology (Oxford). 2001; 40:205-211. [DOI] [PubMed] [Google Scholar]
- 16.Saag KG, Teng GG, Patkar NM, Anuntiyo J, Finney C, Curtis JR, Paulus HE, Mudano A, Pisu M, Elkins‐Melton M, Outman R, Allison JJ, Suarez Almazor M, Bridges SL, Jr, Chatham WW, Hochberg M, MacLean C, Mikuls T, Moreland LW, O'Dell J, Turkiewicz AM, Furst DE. American College of Rheumatology 2008 recommendations for the use of nonbiologic and biologic disease‐modifying antirheumatic drugs in rheumatoid arthritis. Arthritis Rheum. 2008; 59:762-784. [DOI] [PubMed] [Google Scholar]
- 17.Edwards JC, Szczepanski L, Szechinski J, Filipowicz‐Sosnowska A, Emery P, Close DR, Stevens RM, Shaw T. Efficacy of B‐cell‐targeted therapy with rituximab in patients with rheumatoid arthritis. N Engl J Med. 2004; 350:2572-2581. [DOI] [PubMed] [Google Scholar]
- 18.Cohen SB, Emery P, Greenwald MW, Dougados M, Furie RA, Genovese MC, Keystone EC, Loveless JE, Burmester GR, Cravets MW, Hessey EW, Shaw T, Totoritis MC. Rituximab for rheumatoid arthritis refractory to anti‐tumor necrosis factor therapy: results of a multicenter, randomized, double‐blind, placebo‐controlled, phase III trial evaluating primary efficacy and safety at twenty‐four weeks. Arthritis Rheum. 2006; 54:2793-2806. [DOI] [PubMed] [Google Scholar]
- 19.Arnett FC, Edworthy SM, Bloch DA, McShane DJ, Fries JF, Cooper NS, Healey LA, Kaplan SR, Liang MH, Luthra HS, Medsger TA, Jr, Mitchell DM, Neustadt DH, Pinals RS, Schaller JG, Sharp JT, Wilder RL, Hunder GG. The American Rheumatism Association 1987 revised criteria for the classification of rheumatoid arthritis. Arthritis Rheum. 1988; 31:315-324. [DOI] [PubMed] [Google Scholar]
- 20.Furlong CE, Richter RJ, Seidel SL, Motulsky AG. Role of genetic polymorphism of human plasma paraoxonase/arylesterase in hydrolysis of the insecticide metabolites chlorpyrifos oxon and paraoxon. Am J Hum Genet. 1988; 43:230-238. [PMC free article] [PubMed] [Google Scholar]
- 21.Prevoo ML, van ‘t Hof MA, Kuper HH, van Leeuwen MA, van de Putte LB, van Riel PL. Modified disease activity scores that include twenty‐eight‐joint counts. Development and validation in a prospective longitudinal study of patients with rheumatoid arthritis. Arthritis Rheum. 1995; 38:44-48. [DOI] [PubMed] [Google Scholar]
- 22.Aletaha D, Nell VP, Stamm T, Uffmann M, Pflugbeil S, Machold K, Smolen JS. Acute phase reactants add little to composite disease activity indices for rheumatoid arthritis: validation of a clinical activity score. Arthritis Res Ther. 2005; 7:R796-R806. [DOI] [PMC free article] [PubMed] [Google Scholar]
- 23.Smolen JS, Breedveld FC, Schiff MH, Kalden JR, Emery P, Eberl G, van Riel PL, Tugwell P. A simplified disease activity index for rheumatoid arthritis for use in clinical practice. Rheumatology (Oxford). 2003; 42:244-257. [DOI] [PubMed] [Google Scholar]
- 24.Inoue E, Yamanaka H, Hara M, Tomatsu T, Kamatani N. Comparison of disease activity score (DAS)28‐ erythrocyte sedimentation rate and DAS28‐ C‐reactive protein threshold values. Ann Rheum Dis. 2007; 66:407-409. [DOI] [PMC free article] [PubMed] [Google Scholar]
- 25.Huang AL, Silver AE, Shvenke E, Schopfer DW, Jahangir E, Titas MA, Shpilman A, Menzoian JO, Watkins MT, Raffetto JD, Gibbons G, Woodson J, Shaw PM, Dhadly M, Eberhardt RT, Keaney JF, Jr, Gokce N, Vita JA. Predictive value of reactive hyperemia for cardiovascular events in patients with peripheral arterial disease undergoing vascular surgery. Arterioscler Thromb Vasc Biol. 2007; 27:2113-2119. [DOI] [PMC free article] [PubMed] [Google Scholar]
- 26.Chambless LE, Heiss G, Folsom AR, Rosamond W, Szklo M, Sharrett AR, Clegg LX. Association of coronary heart disease incidence with carotid arterial wall thickness and major risk factors: the atherosclerosis risk in communities (ARIC) study, 1987–1993. Am J Epidemiol. 1997; 146:483-494. [DOI] [PubMed] [Google Scholar]
- 27.Heiss G, Sharrett AR, Barnes R, Chambless LE, Szklo M, Alzola C. Carotid atherosclerosis measured by B‐mode ultrasound in populations: associations with cardiovascular risk factors in the ARIC study. Am J Epidemiol. 1991; 134:250-256. [DOI] [PubMed] [Google Scholar]
- 28.Wu KK, Folsom AR, Heiss G, Davis CE, Conlan MG, Barnes R. Association of coagulation factors and inhibitors with carotid artery atherosclerosis. Early results of the atherosclerosis risk in communities (ARIC) study. Ann Epidemiol. 1992; 2:471-480. [DOI] [PubMed] [Google Scholar]
- 29.Hsue PY, Scherzer R, Hunt PW, Schnell A, Bolger AF, Kalapus SC, Maka K, Martin JN, Ganz P, Deeks SG. Carotid intima‐media thickness progression in HIV‐infected adults occurs preferentially at the carotid bifurcation and is predicted by inflammation. J Am Heart Assoc. 2012; 1‐ [DOI] [PMC free article] [PubMed] [Google Scholar]
- 30.Peters MJ, Symmons DP, McCarey D, Dijkmans BA, Nicola P, Kvien TK, McInnes IB, Haentzschel H, Gonzalez‐Gay MA, Provan S, Semb A, Sidiropoulos P, Kitas G, Smulders YM, Soubrier M, Szekanecz Z, Sattar N, Nurmohamed MT. EULAR evidence‐based recommendations for cardiovascular risk management in patients with rheumatoid arthritis and other forms of inflammatory arthritis. Ann Rheum Dis. 2010; 69:325-331. [DOI] [PubMed] [Google Scholar]
- 31.Friedewald VE, Ganz P, Kremer JM, Mease PJ, O'Dell JR, Pearson TA, Ram CV, Ridker PM, Salmon JE, Roberts WC. AJC editor's consensus: rheumatoid arthritis and atherosclerotic cardiovascular disease. Am J Cardiol. 2010; 106:442-447. [DOI] [PubMed] [Google Scholar]
- 32.Turesson C, Jarenros A, Jacobsson L. Increased incidence of cardiovascular disease in patients with rheumatoid arthritis: results from a community based study. Ann Rheum Dis. 2004; 63:952-955. [DOI] [PMC free article] [PubMed] [Google Scholar]
- 33.Szekanecz Z, Kerekes G, Der H, Sandor Z, Szabo Z, Vegvari A, Simkovics E, Soos L, Szentpetery A, Besenyei T, Szucs G, Szanto S, Tamasi L, Szegedi G, Shoenfeld Y, Soltesz P. Accelerated atherosclerosis in rheumatoid arthritis. Ann N Y Acad Sci. 2007; 1108:349-358. [DOI] [PubMed] [Google Scholar]
- 34.Kerekes G, Szekanecz Z, Der H, Sandor Z, Lakos G, Muszbek L, Csipo I, Sipka S, Seres I, Paragh G, Kappelmayer J, Szomjak E, Veres K, Szegedi G, Shoenfeld Y, Soltesz P. Endothelial dysfunction and atherosclerosis in rheumatoid arthritis: a multiparametric analysis using imaging techniques and laboratory markers of inflammation and autoimmunity. J Rheumatol. 2008; 35:398-406. [PubMed] [Google Scholar]
- 35.Gonzalez‐Gay MA, Gonzalez‐Juanatey C, Ollier WE. Endothelial dysfunction in rheumatoid arthritis: influence of HLA‐DRB1 alleles. Autoimmun Rev. 2004; 3:301-304. [DOI] [PubMed] [Google Scholar]
- 36.Gonzalez‐Juanatey C, Llorca J, Vazquez‐Rodriguez TR, Diaz‐Varela N, Garcia‐Quiroga H, Gonzalez‐Gay MA. Short‐term improvement of endothelial function in rituximab‐treated rheumatoid arthritis patients refractory to tumor necrosis factor alpha blocker therapy. Arthritis Rheum. 2008; 59:1821-1824. [DOI] [PubMed] [Google Scholar]
- 37.Gonzalez‐Juanatey C, Testa A, Garcia‐Castelo A, Garcia‐Porrua C, Llorca J, Gonzalez‐Gay MA. Active but transient improvement of endothelial function in rheumatoid arthritis patients undergoing long‐term treatment with anti‐tumor necrosis factor alpha antibody. Arthritis Rheum. 2004; 51:447-450. [DOI] [PubMed] [Google Scholar]
- 38.Kerekes G, Soltesz P, Der H, Veres K, Szabo Z, Vegvari A, Szegedi G, Shoenfeld Y, Szekanecz Z. Effects of rituximab treatment on endothelial dysfunction, carotid atherosclerosis, and lipid profile in rheumatoid arthritis. Clin Rheumatol. 2009; 28:705-710. [DOI] [PubMed] [Google Scholar]
- 39.Huang AL, Vita JA. Effects of systemic inflammation on endothelium‐dependent vasodilation. Trends Cardiovasc Med. 2006; 16:15-20. [DOI] [PMC free article] [PubMed] [Google Scholar]
- 40.Vita JA, Keaney JF, Jr, Larson MG, Keyes MJ, Massaro JM, Lipinska I, Lehman BT, Fan S, Osypiuk E, Wilson PW, Vasan RS, Mitchell GF, Benjamin EJ. Brachial artery vasodilator function and systemic inflammation in the Framingham Offspring Study. Circulation. 2004; 110:3604-3609. [DOI] [PubMed] [Google Scholar]
- 41.Verma S, Wang CH, Lonn E, Charbonneau F, Buithieu J, Title LM, Fung M, Edworthy S, Robertson AC, Anderson TJ. Cross‐sectional evaluation of brachial artery flow‐mediated vasodilation and C‐reactive protein in healthy individuals. Eur Heart J. 2004; 25:1754-1760. [DOI] [PubMed] [Google Scholar]
- 42.Hansson GK, Libby P, Schonbeck U, Yan ZQ. Innate and adaptive immunity in the pathogenesis of atherosclerosis. Circ Res. 2002; 91:281-291. [DOI] [PubMed] [Google Scholar]
- 43.Zhou X, Nicoletti A, Elhage R, Hansson GK. Transfer of CD4(+) T cells aggravates atherosclerosis in immunodeficient apolipoprotein E knockout mice. Circulation. 2000; 102:2919-2922. [DOI] [PubMed] [Google Scholar]
- 44.Hansson GK, Hermansson A. The immune system in atherosclerosis. Nat Immunol. 2011; 12:204-212. [DOI] [PubMed] [Google Scholar]
- 45.Lund FE. Cytokine‐producing B lymphocytes‐key regulators of immunity. Curr Opin Immunol. 2008; 20:332-338. [DOI] [PMC free article] [PubMed] [Google Scholar]
- 46.Harris DP, Haynes L, Sayles PC, Duso DK, Eaton SM, Lepak NM, Johnson LL, Swain SL, Lund FE. Reciprocal regulation of polarized cytokine production by effector B and T cells. Nat Immunol. 2000; 1:475-482. [DOI] [PubMed] [Google Scholar]
- 47.Aubry MC, Riehle DL, Edwards WD, Maradit‐Kremers H, Roger VL, Sebo TJ, Gabriel SE. B‐lymphocytes in plaque and adventitia of coronary arteries in two patients with rheumatoid arthritis and coronary atherosclerosis: preliminary observations. Cardiovasc Pathol. 2004; 13:233-236. [DOI] [PubMed] [Google Scholar]
- 48.Ait‐Oufella H, Herbin O, Bouaziz JD, Binder CJ, Uyttenhove C, Laurans L, Taleb S, Van Vre E, Esposito B, Vilar J, Sirvent J, Van Snick J, Tedgui A, Tedder TF, Mallat Z. B cell depletion reduces the development of atherosclerosis in mice. J Exp Med. 2010; 207:1579-1587. [DOI] [PMC free article] [PubMed] [Google Scholar]
- 49.Uchida HA, Kristo F, Rateri DL, Lu H, Charnigo R, Cassis LA, Daugherty A. Total lymphocyte deficiency attenuates AngII‐induced atherosclerosis in males but not abdominal aortic aneurysms in apoE deficient mice. Atherosclerosis. 2010; 211:399-403. [DOI] [PMC free article] [PubMed] [Google Scholar]
- 50.Hilgendorf I, Theurl I, Gerhardt LM, Robbins CS, Weber GF, Gonen A, Iwamoto Y, Degousee N, Holderried TA, Winter C, Zirlik A, Lin HY, Sukhova GK, Butany J, Rubin BB, Witztum JL, Libby P, Nahrendorf M, Weissleder R, Swirski FK. Innate response activator B cells aggravate atherosclerosis by stimulating T helper‐1 adaptive immunity. Circulation. 2014; 129:1677-1687. [DOI] [PMC free article] [PubMed] [Google Scholar]