

Abstract
Laminin of different cellular sources has distinct functions. In addition to vascular smooth muscle cells (SMCs), aorta also contains a small population of nestin+ cells, whose function remains unknown. This study investigates the role of SMC- and nestin+ cell-derived laminin in blood pressure (BP) regulation and SMC contractibility. Using mice with laminin deficiency in SMCs (SKO) or nestin+ cells (NKO), we examined laminin-dependent changes in BP. Contractile protein expression was reduced in SKO but not NKO mice, consistent with their, respectively, low and normal baseline BP measurements. At the ultrastructural level, SKO SMCs maintained the contractile phenotype with reduced elasticity, whereas NKO SMCs switched to the synthetic phenotype and showed degeneration. Additionally, angiotensin II (Ang II) significantly increased BP in SKO but not NKO mice. It also enhanced contractile proteins to the same levels and induced SMC degeneration in both knockout mice. These data suggest that SMC laminin regulates BP via modulating contractile protein expression, whereas nestin+ cell-derived laminin contributes to SMC phenotypic switch.
Electronic supplementary material
The online version of this article (doi:10.1007/s00018-014-1732-y) contains supplementary material, which is available to authorized users.
Keywords: Laminin, Nestin, Smooth muscle cells, Aorta
Introduction
Hypertension, a severe public health problem, affects 67,000,000 adults and kills nearly 350,000 Americans annually [1]. These numbers are expected to elevate as the average life span increases. Thus, finding effective therapeutics is urgent. Smooth muscle cells (SMCs), unlike other muscle lineages, are not terminally differentiated cells [2]. They contribute to blood pressure (BP) regulation through phenotypic switch between the contractile phenotype and synthetic phenotype [3–5]. The contractile phenotype is found in adult blood vessels, where SMCs take an elongated morphology and circumferential orientation around the vessels, express high levels of contractile proteins [6, 7], including smooth muscle actin (SMA) and transgelin (SM22α), proliferate at extremely low rate, and exhibit low synthetic activity [3, 5, 8]. The synthetic phenotype is usually found during development or in injured vessels, where SMCs have a round hypertrophic morphology, lose the circumferential orientation, and synthesize various extracellular matrix (ECM) proteins and other molecules at a high rate [3, 5, 9]. Previous work from our lab and others shows that laminin regulates contractile protein expression in SMCs [10–14]. A direct link between laminin and BP regulation, however, remains unclear. In addition to SMCs, aorta also contains a small population of cells marked by nestin [15]. Although laminin enhances the migration, proliferation, and differentiation of nestin+ neural stem/progenitor cells [16], its role in aortic nestin+ cells and aorta function is elusive. Here, we investigate the role of SMC- and nestin+ cell-derived laminin in contractile protein expression and BP regulation using two conditional laminin knockout mouse lines.
Materials and methods
Animals
Homozygous floxed laminin γ1 (F/F) mice were generated in our lab and backcrossed to C57BL/6 J for more than 10 generations. SM22α-cre (The Jackson Laboratory, Stock Number 006878) and nestin-cre (The Jackson Laboratory, Stock Number 003771) mice were backcrossed to C57BL/6 J for more than 12 generations. F/F mice were crossed with SM22α-cre and nestin-cre transgenic mouse lines to generate F/F:SM22α-Cre+ (SKO) and F/F:nestin-Cre+ (NKO) mice, respectively. These mice were maintained in the Comparative Biosciences Center at The Rockefeller University with free access to water and food. Two to four-month-old knockout and Ctr mice of both genders were used for experiments. Experimental procedures were in accordance with the NIH guide for care and use of animals and the Institutional Animal Care and Use Committee.
Induction of hypertension
Angiotensin II (Ang II) was used to induce hypertension as described previously with minor modifications [17]. Briefly, Ctr, SKO, and NKO mice were anesthetized with tribromoethanol (0.02 ml/g of body weight). Saline or Ang II (1 μg/kg/min, Sigma) was infused with osmotic pumps (Alzet) over 13 days. One week after pump implantation, Ang II (0.5 μg/g) was injected subcutaneously twice a day for 6 days.
Blood pressure (BP) measurement
Mouse BP was measured using the non-invasive tail-cuff BP system (Kent Scientific Corporation). Briefly, mice were conditioned to the BP monitoring procedure for five consecutive days before experiments. At day 0, the baseline BP was measured before saline or Ang II pumps were implanted. At days 4, 8, and 13, blood pressure was measured again. At each time point, at least 20 reads were obtained and averaged as the BP at that time point. The accuracy of this system in BP measurement has been validated [18].
Immunohistochemistry
Aortic sections were immunostained with anti-laminin γ1 (Abcam), anti-nestin (Sigma), anti-SMA (Sigma), anti-SM22α (GeneTex), anti-fibronectin (Millipore), anti-collagen I (Sigma), anti-collagen IV (Millipore), anti-CD90 (Abcam), anti-CD105 (Biolegend), anti-PDGFRα (eBiosciences), anti-c-Kit (R&D), and anti-Ki67 (Millipore) antibodies overnight at 4 °C. For fluorescent staining, sections were incubated with appropriate fluorescent secondary antibodies (Invitrogen) for 1 h at room temperature. Due to strong autofluorescence in the green channel of aortic tissue, Alexa-647 (artificially colored in green) rather than Alexa-488 was used. For DAB staining, sections were incubated with biotinylated secondary antibodies for 1 h at room temperature, followed by ABC kit (Vector) and DAB Kit (Vector), according to the manufacturer’s instructions. After mounting, the sections were examined and photographed with Zeiss Axiovert 200 or Leica confocal microscope.
Elastin staining
Elastin staining was performed using the ACCUSTAIN Elastic Stain Kit (Sigma), according to the manufacturer’s instructions. Briefly, frozen slides were equilibrated in PBS for 5 min, followed by fixation in 4 % paraformaldehyde for 30 min at room temperature. After extensive washing, the slides were incubated in working elastic stain solution for 10 min and differentiated in working ferric chloride solution. Next, the slides were rinsed in 95 % ethanol and deionized water and incubated in Van Gieson solution for 2 min at room temperature. The slides were then rinsed in 95 % ethanol, followed by dehydration in 100 % ethanol and xylene. After mounting, the sections were examined and photographed with Zeiss Axiovert 200 microscope. For quantification, 16 random images from at least four animals at 400× magnification were taken, and the mean thickness was analyzed and converted to μm based on the scale bar.
Western blot
Descending thoracic aorta was dissected out from saline-perfused mice. After removing surrounding connective tissue, descending thoracic aorta was homogenized in tissue lysis buffer (100 mM Tris, pH 8, 1 % SDS, 200 mM NaCl, 5 mM EDTA, 1X protease inhibitor cocktail, 1X phosphatase inhibitor cocktail). Total protein concentration from the lysates was determined using the Bio-Rad protein assay kit. Equal amounts of proteins were loaded and separated on 10 or 12 % SDS-PAGE, and then transferred to PVDF membrane (Millipore). The membranes were then incubated with anti-laminin γ1 (Neo Markers), anti-ATR1 (Abcam), anti-ATR2 (Abcam), anti-SM calponin (Millipore), anti-SMA (Sigma), anti-SM22α (GeneTex), anti-nestin (Santa Cruz), or anti-actin (Sigma) antibodies at 4 °C overnight, followed by incubation with HRP-conjugated secondary antibodies (Jackson ImmunoResearch Lab). The proteins were visualized by SuperSignal West Pico Chemiluminescent Substrate (Pierce). Band density was normalized to actin and quantified using NIH Image J.
Electron microscopy analysis
Electron microscopy was performed as described previously [19]. Briefly, mice were anesthetized with tribromoethanol (0.02 ml/g of body weight) and then perfused sequentially with PBS and fixative buffer (0.1 M sodium cacodylate buffer supplemented with 2 % paraformaldehyde and 2 % glutaraldehyde). Thoracic aorta was dissected out and fixed overnight. Next, the tissue was post-fixed in 1 % osmium tetroxide and 1 % K-ferrocyanide, en bloc stained with 2 % uranyl acetate, and embedded in resin. Ultra-thin sections were cut on a Reichert-Jung Ultracut E microtome. After post-staining with 2 % uranyl acetate and 1 % lead citrate, sections were examined and photographed using JEOL100CXII at 80 kV.
Stereological analysis
100-point sampling grid was used to quantify the percentage volume of collagen, fibronectin, and SMCs in the aorta as described previously with minor modifications [20–22]. Briefly, the sum of points from each component was divided by the total points occupied by aortic tissue. The ratio (in percentage) was considered as the volume percentage. Twenty images from 4 animals were used for quantification. The examination was performed at 400X for fibronectin and collagen, and 1,300X (EM images) for SMCs.
Statistics
Results are shown as mean ± SD. Student’s t test, performed by SPSS Statistics, was used to analyze differences between two groups.
Results
Generation of conditional laminin knockout mice
Since global laminin γ1 knockout mice are embryonic lethal, we used conditional laminin knockout mice for this study. F/F mice were crossed with SM22α-cre and nestin-cre transgenic mouse lines to generate F/F:SM22α-Cre+ (SKO) and F/F:nestin-Cre+ (NKO) mice, respectively. These knockout mice were born in the expected Mendelian ratios (data not shown), although NKO mice were smaller than their wild-type littermates [10]. The F/F and F/+ (heterozygous floxed laminin γ1) littermates were used as controls (Ctr). Laminin expression was observed in the adventitia and media of the Ctr aorta (Fig. 1a and Supplemental Fig. 1). The SKO mice showed loss of laminin γ1 expression primarily in SMA+ (Fig. 1a) and SM22α+ (blue arrows in Supplemental Fig. 1) SMCs. Semi-quantitative western blots revealed a significant decrease of laminin in SKO aorta (Fig. 1b), suggesting that laminin expression is indeed abrogated in SMCs in SKO mice. Lack of laminin γ1 expression in nestin+ cells has been validated before [10, 19]. Here we showed that nestin+ cells in NKO aorta were negative for laminin γ1 (white arrowheads, Supplemental Fig. 1), suggesting that laminin expression is abrogated in NKO aorta. It should be noted, however, that Ctr and NKO aortas showed comparable levels of laminin γ1 (Fig. 1), suggesting that the number of nestin+ cells in adult aorta is negligible.
Fig. 1.

Laminin γ1 is reduced in aortic SMCs in SKO, but not NKO mice. a Laminin γ1 (red) and SMA (green) expression in Ctr and knockout aortas. b Western blots and semi-quantitative data of laminin γ1 (Ln-γ1) expression in the aortas. All bands were normalized to actin. Data are shown as mean ± SD, n = 4. ***p < 0.001 versus Ctr. Scale bar represents 100 μm
We further quantified the number of nestin+ cells in aorta and found region-specific expression of nestin. In aortic arch, nestin+ cells accounted for 15, 14, and 24 % in Ctr, SKO, and NKO mice, respectively (Fig. 2a). In thoracic aorta, the percentage dropped to, respectively, 6.8, 7, and 15 % in Ctr, SKO, and NKO mice (Fig. 2a). In abdominal aorta, however, only 3 % of the cells were nestin+ in these mice (Fig. 2a). These data are consistent with a previous study reporting that the concentration of nestin+ cells follows this order: aortic arch >thoracic aorta >abdominal aorta [15]. Due to this region-specific effect, thoracic aorta was used in the following studies. Representative images of nestin expression in the thoracic aortas of Ctr, SKO, and NKO mice are shown in Fig. 2b. Consistent with the immunohistochemical study, quantitative western blot demonstrated a significant increase of nestin expression in NKO, but not SKO aorta (Fig. 2c). To determine if the increased nestin+ cells in NKO aorta is due to proliferation, we further examined Ki67 expression in SMCs and nestin+ cells. Very few Ki67+ cells, which were negative for SMA or nestin, were observed in Ctr aorta (blue arrows, Supplemental Fig. 2). In SKO aorta, a few Ki67+SMA+ cells were observed (blue arrowheads, supplemental Fig. 2), indicating proliferation of SMCs. In NKO aorta, however, both Ki67+SMA+ (white arrowheads) and Ki67+nestin+ (white arrows) cells were found (Supplemental Fig. 2), suggesting that loss of laminin in nestin+ cells leads to the proliferation of both nestin+ and SMA+ cells. We also examined the expression/distribution of nestin+ cells in resistance arteries. Extremely low, if any, levels of nestin expression were observed in resistance arteries independent of genotypes (data not shown), suggesting that aorta but not resistance arteries contains nestin+ cells. To investigate if these nestin+ cells are mesenchymal stem cells, we performed immunohistochemical analysis and found that nestin+ cells were also positive for four mesenchymal stem cell markers: CD90, CD105, PDGFRα, and c-Kit (white arrows, Supplemental Fig. 3). These data suggest that the nestin+ cells in aorta are mesenchymal stem cells.
Fig. 2.

Nestin expression in aortas. a Percentage of nestin+ cells in different aortic regions (aortic arch, thoracic aorta, and abdominal aorta) in Ctr, SKO, and NKO mice. b DAB staining of nestin (brown) in thoracic aortas of these mice. c Western blots and semi-quantitative data of nestin expression in aortas. All bands were normalized to actin. Data are shown as mean ± SD, n = 4–5. ***p < 0.001 versus Ctr. Scale bar represents 100 μm
Laminin regulates BP
To examine the role of laminin in BP regulation, we measured baseline BP and angiotensin II (Ang II)-induced hypertension in these mice. Consistent with previous reports [11, 23], the baseline mean and systolic BP were approximately 100 and 120 mmHg in Ctr mice (Fig. 3), respectively. Ang II infusion through osmotic pumps significantly increased both mean and systolic BP in Ctr mice starting at day 4 (D4, Fig. 3). Compared to the Ctr, SKO mice have a significantly lower baseline BP (red, Fig. 3). Although Ang II enhanced BP in SKO mice, it was significantly lower than that in Ctr mice at each time point examined (Fig. 3), suggesting that SMC laminin contributes to BP maintenance in both normotensive and hypertensive conditions. NKO mice, on the other hand, had normal baseline BP, but failed to increase their BP after Ang II treatment (green, Fig. 3). In these experiments, Ctr, SKO, and NKO mice implanted with saline-loaded micro-pumps were used as controls. Saline infusion did not affect BP in these mice (data not shown), indicating that the observed BP changes were due to the effect of Ang II. Next, we further examined the expression of Ang II receptors. Immunostaining showed comparable levels of Ang II receptor type-I (ATR1), the major receptor responsible for Ang II-induced cardiovascular changes [24], in Ctr, SKO, and NKO aortas (Fig. 4a). Semi-quantitative western blot revealed similar result (Fig. 4b). Similarly, no difference in Ang II receptor type-II (ATR2) expression was observed in these mice (data not shown). These data suggest that Ang II-induced BP changes in these mice were not due to differential expression of its receptors.
Fig. 3.

Laminin regulates BP. Mean (a) and systolic (b) BP of Ctr, SKO, and NKO mice before and after Ang II infusion. Data are shown as mean ± SD, n = 6–9. *p < 0.05, **p < 0.01, ***p < 0.001 Ctr versus SKO at each time point. # p < 0.05, ## p < 0.01, ### p < 0.001 Ctr versus NKO at each time point
Fig. 4.

ATR1 expression in aortas. a ATR1 (brown) expression in Ctr, SKO, and NKO aortas. b Western blots and semi-quantitative data of ATR1 expression in the aortas. All bands were normalized to actin. Data are shown as mean ± SD, n = 4. Scale bar represents 100 μm
Laminin has different functions
Since SMA and SM22α contribute to the contractile property of SMCs [11, 25, 26], we examined their expression levels in our laminin-deficient mice. Both SMA and SM22α were expressed in Ctr aorta (Fig. 5). These contractile proteins, however, were significantly reduced in SKO aorta, although not affected in NKO aorta (Fig. 5). Similar changes were observed for smooth muscle calponin, another contractile protein (Supplemental Fig. 5). Additionally, we also examined the expression of these contractile proteins in resistance arteries. SMA and SM22α expression was decreased in SKO, but not NKO mice (Supplemental Fig. 6). The same alteration was found for calponin (data not shown), again suggesting that SMC laminin regulates contractile protein expression. At the ultrastructural level (see Supplemental Fig. 4 for low magnification images), wavily aligned, elongated SMCs were present along the circumferential axis of Ctr aorta (Fig. 6a), representing the contractile phenotype. Although elongated morphology and circumferential orientation were present, SKO SMCs lost their wavy pattern (Fig. 6b), suggesting decreased contractility/elasticity. Together with the decreased BP observed in SKO mice, these data strongly suggest that SMC laminin maintains BP via promoting contractile protein expression. NKO SMCs, on the other hand, lost the elongated morphology and were rounded (Fig. 6c), characteristics of the synthetic phenotype, suggesting compromise of the contractile machinery. SMC degeneration and rupture were also observed in NKO aorta (Fig. 6c). Additionally, NKO but not Ctr or SKO mice showed extremely thickened aortic wall (Fig. 6d, e). Stereological analysis of wall thickness using EM images demonstrated the same result (data not shown). To investigate what causes the thickened aortic wall, we first examined the deposition of ECM proteins in the aorta. Fibronectin and collagen I (Col I) were predominantly deposited in the adventitia in Ctr and SKO aortas (Fig. 7a). In NKO aorta, however, fibronectin and Col I were dramatically up-regulated in the media and down-regulated in the adventitia (Fig. 7a). Unlike fibronectin and Col I, collagen IV (Col IV) was expressed at low levels in both media and adventitia in the Ctr and SKO aortas (Fig. 7a). In NKO aorta, however, increased deposition of Col IV was observed in both media and adventitia (Fig. 7a). Stereological analyses revealed that the volume percentage of fibronectin and collagen was 6.3 and 13.5 % in Ctr aorta, 6.3 and 14.1 % in SKO aorta, and 16.7 and 34.4 % in NKO aorta, respectively (Fig. 7b). Next, we further examined the volume percentage of SMCs in aorta. Although the volume of SMCs was similar in Ctr and SKO aortas, it was significantly elevated in NKO aorta (Fig. 7c), indicating a synthetic phenotype of NKO SMCs [27, 28]. Altogether, these data suggest that nestin+ cell-derived laminin regulates SMC phenotypic switch and proliferation, rather than contractile protein expression.
Fig. 5.
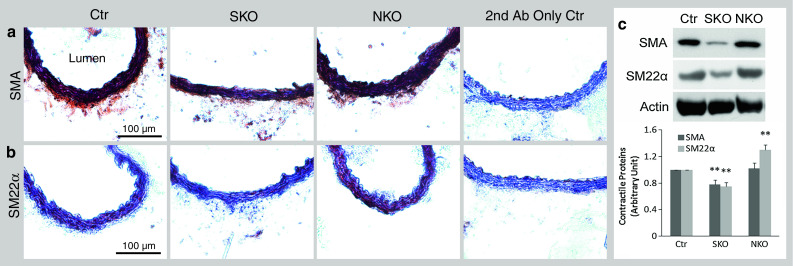
Contractile protein expression in aorta. SMA (a) and SM22α (b) expression (brown) in Ctr, SKO, and NKO mice. c Semi-quantification of contractile protein expression in aorta by Western blots. All bands were normalized to actin. Data are shown as mean ± SD, n = 4. **p < 0.01 versus Ctr. Scale bars represent 100 μm
Fig. 6.
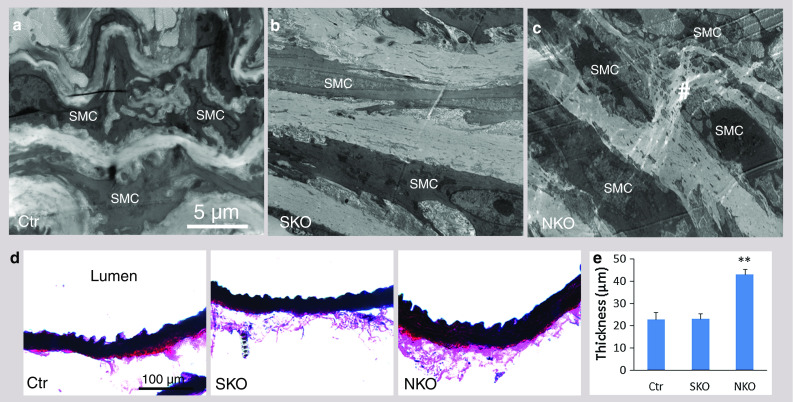
Ultrastructural alteration and aortic thickness. Ultrastructural changes in Ctr (a), SKO (b), and NKO (c) aortas. Hash labels rupture/degeneration of SMCs. d Elastin staining of aorta. e Quantification of aortic thickness. Data are shown as mean ± SD, n = 4. **p < 0.01 versus Ctr. Scale bars represent 5 μm in a–c and 100 μm in d
Fig. 7.
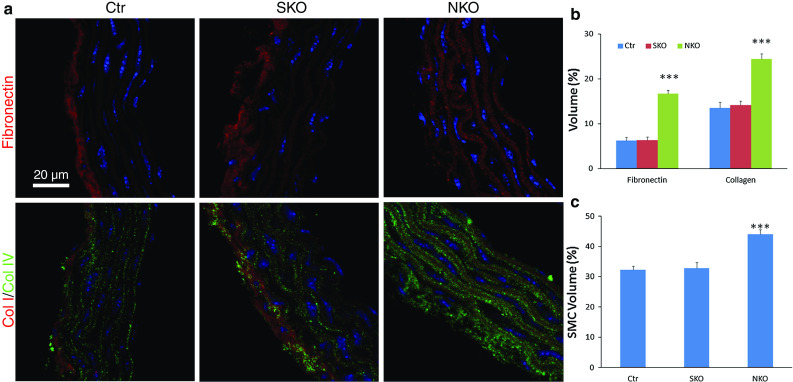
Stereological analyses of ECM proteins and SMC volume in aorta. a Representative images of fibronectin, collagen I (Col I), and collagen IV (Col IV) in thoracic aortas of Ctr, SKO, and NKO mice. b Quantification of volume percentage of fibronectin and collagen in Ctr, SKO, and NKO aortas. c Quantification of SMC volume percentage in Ctr, SKO, and NKO aortas. Data are shown as mean ± SD, n = 4–5. ***p < 0.001 versus Ctr. Scale bar represents 20 μm
Ang II induces SMC degeneration in the knockout mice
Ang II was administered using osmotic pumps for 13 days. No toxic effects were observed as revealed by the total body weight of these mice (Supplemental Fig. 7). Aortic contractile protein expression was elevated to the same levels by Ang II treatment (Fig. 8a), suggesting that contractile proteins are not responsible for the difference in BP among these mice. Ultrastructurally (see Supplemental Fig. 4 for low magnification images), Ctr SMCs maintained elongated morphology and were firmly attached to the elastin laminae (EL) (Fig. 8b). SKO SMCs, however, were detached from the EL and lost cellular integrity (Fig. 8c), suggesting degeneration. Like SKO SMCs, NKO SMCs failed to attach to the EL and showed severe degeneration (Fig. 8d), resulting in discontinuity of the smooth muscle layer and inability to constrict, which may explain why NKO mice failed to respond to Ang II. Additionally, although slightly but significantly increased in Ctr mice after Ang II treatment (Fig. 8f), aorta thickness was markedly increased in SKO mice to a level equivalent to that in NKO mice (Fig. 8e, f). In NKO mice, however, Ang II-induced aorta thickening was not as dramatic due to their high baseline thickness (Fig. 8f). Similar result was obtained when using EM images for stereological analysis of aortic wall thickness (data not shown). Furthermore, fibronectin was dramatically up-regulated in Ctr and SKO but not NKO aortas after Ang II infusion, although no significant difference was found among different genotypes (Fig. 8g). Like fibronectin, Ang II increased collagen deposition in Ctr and SKO, but not NKO aortas (Fig. 8h). Consistent with the wall thickness, significantly more collagen was found in SKO and NKO aortas compared to the Ctr after Ang II infusion (Fig. 8h). Additionally, SMC volume in aorta was dramatically reduced to the same level in all three genotypes after Ang II treatment (Fig. 8i), indicating a contractile phenotype of SMCs.
Fig. 8.
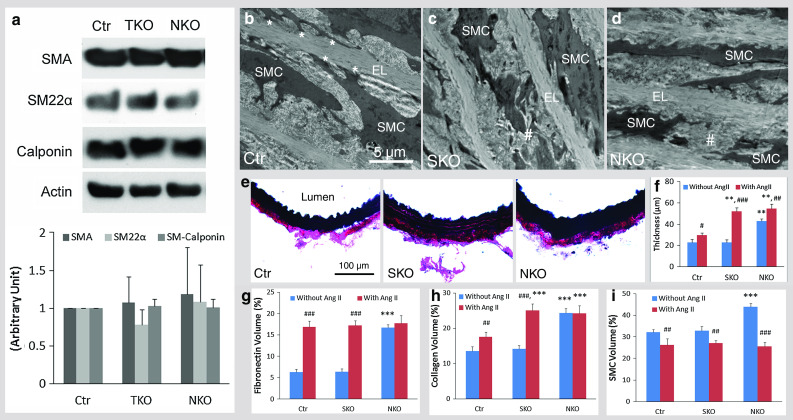
Ang II-induced changes in Ctr, SKO, and NKO mice. a Aortic contractile protein (SMA, SM22α, and Calponin) expression after Ang II infusion. Ang II-induced ultrastructural changes in Ctr (b), SKO (c), and NKO (d) aortas. Asterisk labels the attachment of SMCs to the elastin laminae (EL). Hash labels rupture/degeneration of SMCs. e Elastin staining of aorta 13 days after Ang II treatment. f Quantification of aortic thickness. Stereological analyses of volume percentage of fibronectin (g), collagen (h), and SMCs (i) in Ctr, SKO, and NKO aortas after Ang II infusion. Data are shown as mean ± SD, n = 4. **p < 0.01, ***p < 0.001 versus Ctr. # p < 0.05, ## p < 0.01, ### p < 0.001 comparison within genotypes. Scale bars represent 5 μm in b–d and 100 μm in e
Discussion
The novel findings of this work are (1) mice lacking laminin in SMCs (SKO) or nestin+ cells (NKO) have lower and normal baseline BP, respectively, compared to controls; (2) contractile protein expression correlates with baseline BP in these mice; (3) Ang II increases contractile protein expression in both knockout mice, but only enhances BP in SKO mice; (4) SMC degeneration is observed in NKO mice and is induced by Ang II in SKO mice. This is, to our knowledge, the first study that investigates the differential role of laminin from different cell types in BP regulation and contractile protein expression.
We showed reduced laminin expression in SKO aorta. This is consistent with previous studies that SM22α is expressed in aorta [29–31]. In contrast to a previous report that nestin-cre mediated recombination did not occur in heart and aorta [23, 32], we demonstrated region-specific expression of nestin in aorta and loss of laminin in nestin+ cells in NKO mice. These results are in accordance with previous reports showing that nestin is expressed in mouse aorta during development and at some specific regions in adults [15, 33], and that SMCs from different aortic areas (ascending, thoracic, dorsal) have distinct embryonic origins, gene expression profiles (including nestin [15]), and functions [15, 33–36]. We also demonstrated that these nestin+ cells co-express a variety of mesenchymal stem cell markers, including CD90, CD105, PDGFRα, and c-Kit, suggesting that nestin+ cells in aorta are mesenchymal stem cells.
Consistent with the low baseline BP and contractile protein levels, SKO SMCs showed the typical contractile phenotype. These data suggest important role of laminin and contractile proteins in BP regulation, which is in accordance with previous observations that SMA-null mice have a significantly lower baseline BP [11] and that laminin induces contractile protein expression in vascular SMCs in vitro and in vivo [10, 12–14]. None of these changes, however, were found in NKO mice, suggesting SMC- rather than nestin+ cell-derived laminin regulates contractile protein expression in SMCs.
Contractile proteins were increased to the same levels in Ctr and knockout aortas after Ang II infusion, excluding their contributions in Ang II-induced BP regulation. The observed changes are more likely due to the degeneration of SMCs, given that SMC rupture reduces vessel resistance and compromises their ability to constrict. Since SMC degeneration and aortic thickening were absent in SKO mice before Ang II infusion, we propose that loss of SMC laminin leads to a mild defect (no structural changes), which is aggravated (structural changes) by Ang II. NKO mice, on the other hand, showed SMC degeneration and extremely thickened aorta before and after Ang II treatment, suggesting that loss of laminin in nestin+ cells leads to SMC degeneration and aortic thickening, resulting in a severe defect in vessel function.
Consistent with the thickened aortic wall, increased levels of ECM proteins and nestin+ cells were observed in NKO mice, suggesting that deposition of ECM proteins and proliferation of nestin+ cells contribute to the thickening of aortic wall. Although observed in NKO aorta, proliferating SMCs (Ki67+SMA+ cells) are less likely to be responsible for the thickening of aorta, since they are also found in SKO aorta.
Altogether, our data suggest that laminin of different cellular sources has distinct functions, which may be due to different laminin isoforms being secreted by these cells. It has been shown that endothelial cell-derived laminin contains α4 and α5 chains [37–41], whereas astrocytes predominantly produce laminin isoforms with α1 and α2 chains [37, 39]. Vascular SMCs have been found to express laminin α2, α4 and α5 chains [40, 42]. Which laminin isoforms are expressed by nestin+ cells in aorta, however, remains unclear. Understanding the distribution of laminin isoforms in different cell types may help explain the distinct functions of laminin in BP regulation.
Electronic supplementary material
Below is the link to the electronic supplementary material.
Supplementary material 1 Laminin γ1 expression in SMCs and nestin+ cells in Ctr, SKO, and NKO aortas. Laminin γ1 (Ln-γ1, red) is absent in SM22α+ (dark brown-black) SMCs and nestin+ (Alexa-647, artificially labeled in green) cells in SKO and NKO aortas, respectively. Blue arrows indicate SM22α+ SMCs. White arrowheads indicate nestin+ cells. Scale bar represents 45 μm. (TIFF 6330 kb)
Supplementary material 2 Loss of laminin induces proliferation in aorta. Ki67 (dark brown-black) co-localizes with some SMA+ (red) SMCs in SKO aorta, and both SMA+ (red) and nestin+ (Alexa-647, artificially labeled in green) cells in NKO aorta. Blue arrows indicate SMA+ SMCs in Ctr aorta. Blue arrowheads indicate SMA+Ki67+ SMCs in SKO aorta. White arrows and white arrowheads indicate nestin+Ki67+ and SMA+Ki67+ cells in NKO aorta, respectively. Scale bar represents 45 μm. (TIFF 6466 kb)
Supplementary material 3 Nestin+ cells are mesenchymal stem cells. Nestin+ cells (dark brown-black) in aorta express CD90 (red), CD105 (red), PDGFRα (red), and c-Kit (red). Scale bar represents 20 μm. (TIFF 18537 kb)
Supplementary material 4 Electron microscopic images of aorta at low magnification. High resolution electron microscopic images of Ctr, SKO, and NKO aortas before and after Ang II treatment. Scale bar represents 2 μm.(TIFF 34835 kb)
Supplementary material 5 Calponin is down-regulated in SKO aorta. (a) Confocal images of calponin expression in Ctr, SKO, and NKO aortas. (b) Representative western blots and semi-quantification of calponin expression in Ctr, SKO, and NKO aortas. All bands were normalized to actin. Data are shown as mean ± SD, n = 4. *p < 0.05 versus Ctr. Scale bar represents 20 μm.(TIFF 8943 kb)
Supplementary material 6 SMA and SM22α expression is reduced in resistance arteries in SKO mice. (a) SMA (green) and CD31 (red) staining in resistance arteries in Ctr, SKO, and NKO mice. (b) Quantification of SMA and SM22α expression levels. Data are shown as mean ± SD, n = 4-5. **p < 0.01 versus Ctr. Scale bar represents 100 μm. (TIFF 8953 kb)
Supplementary material 7 Body weight changes during Ang II treatment. Body weight of Ctr, SKO, and NKO mice at different time points after Ang II treatment. Data are shown as mean ± SD, n = 4. (TIFF 2261 kb)
Acknowledgments
We thank Dr. Kunihiro Uryu for assistance with electron microscopy and members of the Strickland Laboratory for scientific discussions. This work was supported by NIH grant NS050537 (SS), a Merck Postdoctoral Fellowship (YY), and a BD Stem Cell Grant (YY).
Conflict of interest
None.
Abbreviations
- BP
Blood pressure
- Ctr
Control
- F/F
Laminin γ1flox/flox
- SKO
Laminin γ1flox/flox: SM22α-cre+
- NKO
Laminin γ1flox/flox: nestin-cre+
- SMC
Smooth muscle cells
- SMA
Smooth muscle actin-α
- Ang II
Angiotensin II
- ATR1
Angiotensin II receptor type-I
- ATR2
Angiotensin II receptor type-II
- ECM
Extracellular matrix
- EL
Elastin laminae
References
- 1.Roger VL, Go AS, Lloyd-Jones DM, Benjamin EJ, Berry JD, Borden WB, Bravata DM, Dai S, Ford ES, Fox CS, Fullerton HJ, Gillespie C, Hailpern SM, Heit JA, Howard VJ, Kissela BM, Kittner SJ, Lackland DT, Lichtman JH, Lisabeth LD, Makuc DM, Marcus GM, Marelli A, Matchar DB, Moy CS, Mozaffarian D, Mozaffarian D, Mussolino ME, Nichol G, Paynter NP, Soliman EZ, Sorlie PD, Sotoodehnia N, Turan TN, Virani SS, Wong ND, Woo D. Turner MB Heart disease and stroke statistics–2012 update: a report from the American Heart Association. Circulation. 2012;125(1):e2–e220. doi: 10.1161/CIR.0b013e31823ac046. [DOI] [PMC free article] [PubMed] [Google Scholar]
- 2.Perry RL, Rudnick MA. Molecular mechanisms regulating myogenic determination and differentiation. Front Biosci. 2000;5:D750–D767. doi: 10.2741/Perry. [DOI] [PubMed] [Google Scholar]
- 3.Davis-Dusenbery BN, Wu C, Hata A. Micromanaging vascular smooth muscle cell differentiation and phenotypic modulation. Arterioscler Thromb Vasc Biol. 2011;31(11):2370–2377. doi: 10.1161/ATVBAHA.111.226670. [DOI] [PMC free article] [PubMed] [Google Scholar]
- 4.Gomez D, Owens GK. Smooth muscle cell phenotypic switching in atherosclerosis. Cardiovasc Res. 2012;95(2):156–164. doi: 10.1093/cvr/cvs115. [DOI] [PMC free article] [PubMed] [Google Scholar]
- 5.Alexander MR, Owens GK. Epigenetic control of smooth muscle cell differentiation and phenotypic switching in vascular development and disease. Annu Rev Physiol. 2012;74:13–40. doi: 10.1146/annurev-physiol-012110-142315. [DOI] [PubMed] [Google Scholar]
- 6.Welser JV, Lange N, Singer CA, Elorza M, Scowen P, Keef KD, Gerthoffer WT, Burkin DJ. Loss of the alpha7 integrin promotes extracellular signal-regulated kinase activation and altered vascular remodeling. Circ Res. 2007;101(7):672–681. doi: 10.1161/CIRCRESAHA.107.151415. [DOI] [PubMed] [Google Scholar]
- 7.Qiu H, Zhu Y, Sun Z, Trzeciakowski JP, Gansner M, Depre C, Resuello RR, Natividad FF, Hunter WC, Genin GM, Elson EL, DE Vatner, Meininger GA. Vatner SF Short communication: vascular smooth muscle cell stiffness as a mechanism for increased aortic stiffness with aging. Circ Res. 2010;107(5):615–619. doi: 10.1161/CIRCRESAHA.110.221846. [DOI] [PMC free article] [PubMed] [Google Scholar]
- 8.Lacolley P, Regnault V, Nicoletti A, Li Z, Michel JB. The vascular smooth muscle cell in arterial pathology: a cell that can take on multiple roles. Cardiovasc Res. 2012;95(2):194–204. doi: 10.1093/cvr/cvs135. [DOI] [PubMed] [Google Scholar]
- 9.Jacob MP, Badier-Commander C, Fontaine V, Benazzoug Y, Feldman L, Michel JB. Extracellular matrix remodeling in the vascular wall. Pathol Biol (Paris) 2001;49(4):326–332. doi: 10.1016/S0369-8114(01)00151-1. [DOI] [PubMed] [Google Scholar]
- 10.Chen ZL, Yao Y, Norris EH, Kruyer A, Jno-Charles O, Akhmerov A, Strickland S. Ablation of astrocytic laminin impairs vascular smooth muscle cell function and leads to hemorrhagic stroke. J Cell Biol. 2013;202(2):381–395. doi: 10.1083/jcb.201212032. [DOI] [PMC free article] [PubMed] [Google Scholar]
- 11.Schildmeyer LA, Braun R, Taffet G, Debiasi M, Burns AE, Bradley A, Schwartz RJ. Impaired vascular contractility and blood pressure homeostasis in the smooth muscle alpha-actin null mouse. FASEB J. 2000;14(14):2213–2220. doi: 10.1096/fj.99-0927com. [DOI] [PubMed] [Google Scholar]
- 12.Tran T, Teoh CM, Tam JK, Qiao Y, Chin CY, Chong OK, Stewart AG, Harris T, Wong WS, Guan SP, Leung BP, Gerthoffer WT, Unruh H, Halayko AJ. Laminin drives survival signals to promote a contractile smooth muscle phenotype and airway hyperreactivity. FASEB J. 2013;27(10):3991–4003. doi: 10.1096/fj.12-221341. [DOI] [PMC free article] [PubMed] [Google Scholar]
- 13.Hultgardh-Nilsson A, Durbeej M. Role of the extracellular matrix and its receptors in smooth muscle cell function: implications in vascular development and disease. Curr Opin Lipidol. 2007;18(5):540–545. doi: 10.1097/MOL.0b013e3282ef77e9. [DOI] [PubMed] [Google Scholar]
- 14.Thyberg J, Hultgardh-Nilsson A. Fibronectin and the basement membrane components laminin and collagen type IV influence the phenotypic properties of subcultured rat aortic smooth muscle cells differently. Cell Tissue Res. 1994;276(2):263–271. doi: 10.1007/BF00306112. [DOI] [PubMed] [Google Scholar]
- 15.Oikawa H, Hayashi K, Maesawa C, Masuda T, Sobue K. Expression profiles of nestin in vascular smooth muscle cells in vivo and in vitro. Exp Cell Res. 2010;316(6):940–950. doi: 10.1016/j.yexcr.2009.10.025. [DOI] [PubMed] [Google Scholar]
- 16.Flanagan LA, Rebaza LM, Derzic S, Schwartz PH, Monuki ES. Regulation of human neural precursor cells by laminin and integrins. J Neurosci Res. 2006;83(5):845–856. doi: 10.1002/jnr.20778. [DOI] [PMC free article] [PubMed] [Google Scholar]
- 17.Wakisaka Y, Chu Y, Miller JD, Rosenberg GA, Heistad DD. Spontaneous intracerebral hemorrhage during acute and chronic hypertension in mice. J Cereb Blood Flow Metab. 2010;30(1):56–69. doi: 10.1038/jcbfm.2009.183. [DOI] [PMC free article] [PubMed] [Google Scholar]
- 18.Feng M, Whitesall S, Zhang Y, Beibel M, D’Alecy L, DiPetrillo K. Validation of volume-pressure recording tail-cuff blood pressure measurements. Am J Hypertens. 2008;21(12):1288–1291. doi: 10.1038/ajh.2008.301. [DOI] [PubMed] [Google Scholar]
- 19.Yao Y, Chen ZL, Norris EH, Strickland S. Astrocytic laminin regulates pericyte differentiation and maintains blood brain barrier integrity. Nat Commun. 2014;5:3413. doi: 10.1038/ncomms4413. [DOI] [PMC free article] [PubMed] [Google Scholar]
- 20.Pang SC, Scott TM. Stereological analysis of the tunica media of the aorta and renal artery during the development of hypertension in the spontaneously hypertensive rat. J Anat. 1981;133(Pt 4):513–526. [PMC free article] [PubMed] [Google Scholar]
- 21.Popescu MR, Zugun FE, Cojocaru E, Tocan L, Folescu R, Zamfir CL. Morphometric study of aortic wall parameters evolution in newborn and child. Rom J Morphol Embryol. 2013;54(2):399–404. [PubMed] [Google Scholar]
- 22.Kochova P, Tonar Z, Matejka VM, Sviglerova J, Stengl M, Kuncova J. Morphology and mechanical properties of the subrenal aorta in normotensive and hypertensive rats. Biomed Pap Med Fac Univ Palacky Olomouc Czech Repub. 2008;152(2):239–245. doi: 10.5507/bp.2008.037. [DOI] [PubMed] [Google Scholar]
- 23.Schmidt VJ, Jobs A, von Maltzahn J, Worsdorfer P, Willecke K, de Wit C. Connexin45 is expressed in vascular smooth muscle but its function remains elusive. PLoS One. 2012;7(7):e42287. doi: 10.1371/journal.pone.0042287. [DOI] [PMC free article] [PubMed] [Google Scholar]
- 24.Heeneman S, Sluimer JC, Daemen MJ. Angiotensin-converting enzyme and vascular remodeling. Circ Res. 2007;101(5):441–454. doi: 10.1161/CIRCRESAHA.107.148338. [DOI] [PubMed] [Google Scholar]
- 25.Li J, Jiang J, Yin H, Wang L, Tian R, Li H, Wang Z, Li D, Wang Y, Gui Y, Walsh MP, Zheng XL. Atorvastatin inhibits myocardin expression in vascular smooth muscle cells. Hypertension. 2012;60(1):145–153. doi: 10.1161/HYPERTENSIONAHA.112.195644. [DOI] [PubMed] [Google Scholar]
- 26.Han M, Dong LH, Zheng B, Shi JH, Wen JK, Cheng Y. Smooth muscle 22 alpha maintains the differentiated phenotype of vascular smooth muscle cells by inducing filamentous actin bundling. Life Sci. 2009;84(13–14):394–401. doi: 10.1016/j.lfs.2008.11.017. [DOI] [PubMed] [Google Scholar]
- 27.Rensen SS, Doevendans PA, van Eys GJ. Regulation and characteristics of vascular smooth muscle cell phenotypic diversity. Neth Heart J. 2007;15(3):100–108. doi: 10.1007/BF03085963. [DOI] [PMC free article] [PubMed] [Google Scholar]
- 28.Wanjare M, Kusuma S, Gerecht S. Defining differences among perivascular cells derived from human pluripotent stem cells. Stem Cell Reports. 2014;2(5):561–575. doi: 10.1016/j.stemcr.2014.03.004. [DOI] [PMC free article] [PubMed] [Google Scholar]
- 29.Rindler TN, Dostanic I, Lasko VM, Nieman ML, Neumann JC, Lorenz JN, Lingrel JB. Knockout of the Na, K-ATPase alpha(2)-isoform in the cardiovascular system does not alter basal blood pressure but prevents ACTH-induced hypertension. Am J Physiol Heart Circ Physiol. 2011;301(4):H1396–H1404. doi: 10.1152/ajpheart.00121.2011. [DOI] [PMC free article] [PubMed] [Google Scholar]
- 30.Lepore JJ, Cheng L, Min LuM, Mericko PA, Morrisey EE, Parmacek MS. High-efficiency somatic mutagenesis in smooth muscle cells and cardiac myocytes in SM22alpha-Cre transgenic mice. Genesis. 2005;41(4):179–184. doi: 10.1002/gene.20112. [DOI] [PubMed] [Google Scholar]
- 31.Hassane S, Claij N, Jodar M, Dedman A, Lauritzen I, Duprat F, Koenderman JS, van der Wal A, Breuning MH, de Heer E, Honore E, DeRuiter MC, Peters DJ. Pkd1-inactivation in vascular smooth muscle cells and adaptation to hypertension. Lab Invest. 2011;91(1):24–32. doi: 10.1038/labinvest.2010.159. [DOI] [PubMed] [Google Scholar]
- 32.Dubois NC, Hofmann D, Kaloulis K, Bishop JM, Trumpp A. Nestin-Cre transgenic mouse line Nes-Cre1 mediates highly efficient Cre/loxP mediated recombination in the nervous system, kidney, and somite-derived tissues. Genesis. 2006;44(8):355–360. doi: 10.1002/dvg.20226. [DOI] [PubMed] [Google Scholar]
- 33.Majesky MW. Developmental basis of vascular smooth muscle diversity. Arterioscler Thromb Vasc Biol. 2007;27(6):1248–1258. doi: 10.1161/ATVBAHA.107.141069. [DOI] [PubMed] [Google Scholar]
- 34.Rosenquist TH, Kirby ML, van Mierop LH. Solitary aortic arch artery. A result of surgical ablation of cardiac neural crest and nodose placode in the avian embryo. Circulation. 1989;80(5):1469–1475. doi: 10.1161/01.CIR.80.5.1469. [DOI] [PubMed] [Google Scholar]
- 35.Topouzis S, Majesky MW. Smooth muscle lineage diversity in the chick embryo. Two types of aortic smooth muscle cell differ in growth and receptor-mediated transcriptional responses to transforming growth factor-beta. Dev Biol. 1996;178(2):430–445. doi: 10.1006/dbio.1996.0229. [DOI] [PubMed] [Google Scholar]
- 36.Madura JA, 2nd, Kaufman BR, Margolin DA, Spencer DM, Fox PL, Graham LM. Regional differences in platelet-derived growth factor production by the canine aorta. J Vasc Res. 1996;33(1):53–61. doi: 10.1159/000159132. [DOI] [PubMed] [Google Scholar]
- 37.Sixt M, Engelhardt B, Pausch F, Hallmann R, Wendler O, Sorokin LM. Endothelial cell laminin isoforms, laminins 8 and 10, play decisive roles in T cell recruitment across the blood-brain barrier in experimental autoimmune encephalomyelitis. J Cell Biol. 2001;153(5):933–946. doi: 10.1083/jcb.153.5.933. [DOI] [PMC free article] [PubMed] [Google Scholar]
- 38.Yousif LF, Di Russo J, Sorokin L. Laminin isoforms in endothelial and perivascular basement membranes. Cell Adh Migr. 2013;7(1):101–110. doi: 10.4161/cam.22680. [DOI] [PMC free article] [PubMed] [Google Scholar]
- 39.Jucker M, Tian M, Norton DD, Sherman C, Kusiak JW. Laminin alpha 2 is a component of brain capillary basement membrane: reduced expression in dystrophic dy mice. Neuroscience. 1996;71(4):1153–1161. doi: 10.1016/0306-4522(95)00496-3. [DOI] [PubMed] [Google Scholar]
- 40.Sorokin LM, Pausch F, Frieser M, Kroger S, Ohage E, Deutzmann R. Developmental regulation of the laminin alpha5 chain suggests a role in epithelial and endothelial cell maturation. Dev Biol. 1997;189(2):285–300. doi: 10.1006/dbio.1997.8668. [DOI] [PubMed] [Google Scholar]
- 41.Hallmann R, Horn N, Selg M, Wendler O, Pausch F, Sorokin LM. Expression and function of laminins in the embryonic and mature vasculature. Physiol Rev. 2005;85(3):979–1000. doi: 10.1152/physrev.00014.2004. [DOI] [PubMed] [Google Scholar]
- 42.Rauch U, Saxena A, Lorkowski S, Rauterberg J, Bjorkbacka H, Durbeej M, Hultgardh-Nilsson A. Laminin isoforms in atherosclerotic arteries from mice and man. Histol Histopathol. 2011;26(6):711–724. doi: 10.14670/HH-26.711. [DOI] [PubMed] [Google Scholar]
Associated Data
This section collects any data citations, data availability statements, or supplementary materials included in this article.
Supplementary Materials
Supplementary material 1 Laminin γ1 expression in SMCs and nestin+ cells in Ctr, SKO, and NKO aortas. Laminin γ1 (Ln-γ1, red) is absent in SM22α+ (dark brown-black) SMCs and nestin+ (Alexa-647, artificially labeled in green) cells in SKO and NKO aortas, respectively. Blue arrows indicate SM22α+ SMCs. White arrowheads indicate nestin+ cells. Scale bar represents 45 μm. (TIFF 6330 kb)
Supplementary material 2 Loss of laminin induces proliferation in aorta. Ki67 (dark brown-black) co-localizes with some SMA+ (red) SMCs in SKO aorta, and both SMA+ (red) and nestin+ (Alexa-647, artificially labeled in green) cells in NKO aorta. Blue arrows indicate SMA+ SMCs in Ctr aorta. Blue arrowheads indicate SMA+Ki67+ SMCs in SKO aorta. White arrows and white arrowheads indicate nestin+Ki67+ and SMA+Ki67+ cells in NKO aorta, respectively. Scale bar represents 45 μm. (TIFF 6466 kb)
Supplementary material 3 Nestin+ cells are mesenchymal stem cells. Nestin+ cells (dark brown-black) in aorta express CD90 (red), CD105 (red), PDGFRα (red), and c-Kit (red). Scale bar represents 20 μm. (TIFF 18537 kb)
Supplementary material 4 Electron microscopic images of aorta at low magnification. High resolution electron microscopic images of Ctr, SKO, and NKO aortas before and after Ang II treatment. Scale bar represents 2 μm.(TIFF 34835 kb)
Supplementary material 5 Calponin is down-regulated in SKO aorta. (a) Confocal images of calponin expression in Ctr, SKO, and NKO aortas. (b) Representative western blots and semi-quantification of calponin expression in Ctr, SKO, and NKO aortas. All bands were normalized to actin. Data are shown as mean ± SD, n = 4. *p < 0.05 versus Ctr. Scale bar represents 20 μm.(TIFF 8943 kb)
Supplementary material 6 SMA and SM22α expression is reduced in resistance arteries in SKO mice. (a) SMA (green) and CD31 (red) staining in resistance arteries in Ctr, SKO, and NKO mice. (b) Quantification of SMA and SM22α expression levels. Data are shown as mean ± SD, n = 4-5. **p < 0.01 versus Ctr. Scale bar represents 100 μm. (TIFF 8953 kb)
Supplementary material 7 Body weight changes during Ang II treatment. Body weight of Ctr, SKO, and NKO mice at different time points after Ang II treatment. Data are shown as mean ± SD, n = 4. (TIFF 2261 kb)