

Abstract
Background.
The effects of antiretrovirals on cystatin C-based renal function estimates are unknown.
Methods.
We analyzed changes in renal function using creatinine and cystatin C-based estimating equations in 269 patients in A5224s, a substudy of study A5202, in which treatment-naive patients were randomized to abacavir/lamivudine or tenofovir/emtricitabine with open-label atazanavir/ritonavir or efavirenz.
Results.
Changes in renal function significantly improved (or declined less) with abacavir/lamivudine treatment compared with tenofovir/emtricitabine using the Cockcroft-Gault formula (P = .016) and 2009 Chronic Kidney Disease Epidemiology Collaboration (CKD-EPI; P = .030) and 2012 CKD-EPI cystatin C-creatinine (P = .025). Renal function changes significantly improved (or declined less) with efavirenz compared with atazanavir/ritonavir (P < .001 for all equations). Mean (95% confidence interval) renal function changes specifically for tenofovir/emtricitabine combined with atazanavir/ritonavir were −8.3 (−14.0, −2.6) mL/min with Cockcroft-Gault; −14.9 (−19.7, −10.1) mL/min per 1.732 with Modification of Diet in Renal Disease; −12.8 (−16.5, −9.0) mL/min per 1.732 with 2009 CKD-EPI; +8.9 (4.2, 13.7) mL/min per 1.732 with 2012 CKD-EPI cystatin C; and −1.2 (−5.1, 2.6) mL/min per 1.732 with 2012 CKD-EPI cystatin C-creatinine. Renal function changes for the other treatment arms were more favorable but similarly varied by estimating equation.
Conclusions.
Antiretroviral-associated changes in renal function vary in magnitude and direction based on the estimating equation used.
Keywords: atazanavir, creatinine, cystatin C, HIV-1, nephropathy, tenofovir
Antiretroviral therapy (ART) may negatively affect renal function through drug toxicity mechanisms [1] or improve renal function by ameliorating the detrimental effects of untreated human immunodeficiency virus (HIV) on the kidney [2, 3]. Several studies have suggested that use of tenofovir disoproxil fumarate is associated with worse changes in estimated glomerular filtration rate (eGFR) compared with other nucleoside reverse-transcriptase inhibitors (NRTIs), and that this effect is magnified with concomitant use of protease inhibitors (PIs) [4–8]. However, not all studies have confirmed this relationship [9–11]. In the AIDS Clinical Trials Group (ACTG) 5202 trial, worse changes in eGFR (estimated as creatinine clearance using the Cockcroft-Gault equation [12]) were found with the use of tenofovir/emtricitabine compared with abacavir/lamivudine, especially when tenofovir/emtricitabine was used in combination with atazanavir/ritonavir [13]. Other observational studies have suggested that the antiretroviral PI combination atazanavir/ritonavir also negatively affects renal function [14, 15].
There is growing interest in the use of serum cystatin C as a new marker of renal function. Compared with serum creatinine, cystatin C is not affected by muscle mass and is completely eliminated by the kidney through glomerular filtration. Perhaps because of this improved ability to measure glomerular filtration, cystatin C seems to have greater utility over creatinine in predicting adverse outcomes in both the general population [16–18] and in the HIV-infected population [19, 20]. As such, newer GFR-estimating equations have been developed using cystatin C, including the 2012 Chronic Kidney Disease Epidemiology Collaboration (CKD-EPI) cystatin C equation, which uses cystatin C only without creatinine, and the 2012 CKD-EPI cystatin C-creatinine equation, which incorporates both markers [21]. In the general US population [18], identifying renal dysfunction with the 2012 CKD-EPI cystatin C-creatinine combined equation appears to be more predictive of cardiovascular disease, end stage renal disease, and overall mortality compared with the 2012 CKD-EPI cystatin C equation and the older 2009 CKD-EPI equation [22], the latter of which includes only serum creatinine. A recent study in women infected with HIV suggested that both of the newer 2012 cystatin C-based equations were more accurate than the 2009 CKD-EPI equation in identifying those patients with renal dysfunction with greater risk of mortality [20].
A recent American study using iohexol clearance as the reference measurement of GFR assessed the accuracy of these newer cystatin C-based equations in patients infected with HIV, most of whom were receiving antiretroviral medications, and found that that the 2012 CKD-EPI cystatin C-creatinine combined equation most accurately estimated GFR compared with the 2012 CKD-EPI cystatin C equation and the original 2009 CKD-EPI equation [23]. Another American study corroborated these findings by again finding that the 2012 CKD-EPI cystatin C-creatinine combined equation was more accurate than the other 2 CKD-EPI equations when compared with direct GFR measurement using iohexol clearance [24]. However, in a similar study conducted in Europe, no appreciable differences were found between the combined 2012 CKD-EPI equation and the 2009 CKD-EPI equation [25]. Of note, both of these HIV studies suggest that all 3 CKD-EPI equations were significantly more accurate than the Modification of Diet in Renal Disease (MDRD) equation [22], which is important given that much of our understanding of the effects of antiretrovirals on renal function from observational cohort studies used this latter equation [7, 26].
Therefore, we assessed changes in renal function using 5 different estimating equations in ACTG 5224s, a substudy of ACTG 5202, in which cystatin C was systematically measured, and assessed the nephrotoxicity profiles with commonly used once-daily regimens.
METHODS
Study Design and Procedures
The ACTG A5224s was a metabolic substudy of A5202 (ClinicalTrials.gov NCT00118898) in which ART-naive study participants from ACTG sites in the United States and Puerto Rico aged ≥16 years and with an HIV-1 RNA level >1000 copies/mL were randomized to a blinded NRTI component, abacavir/lamivudine or tenofovir/emtricitabine, with either the open-label PI atazanavir/ritonavir or the non-NRTI (NNRTI) efavirenz. A secondary objective of A5224s was to compare the effects of initiating abacavir/lamivudine with those of tenofovir/emtricitabine on renal function after 96 weeks. A secondary renal objective was to compare the effects of atazanavir/ritonavir with efavirenz on these endpoints after 96 weeks. As previously described [27], the NRTI assignment was prematurely unblinded for patients with A5202 screening HIV-1 RNA at least 100 000 copies/mL because of higher rates of virologic failure with abacavir/lamivudine regimens.
Renal function was assessed using the following 5 estimating equations: Cockcroft-Gault, 4-variable MDRD, 2009 CKD-EPI, 2012 CKD-EPI cystatin C, and 2012 CKD-EPI cystatin C-creatinine. Serum creatinine measurements and urine analyses for dipstick protein were performed locally at the laboratory of the participating ACTG site. Serum cystatin C (Siemens N Latex kit, lower limit of detection 0.05 mg/L, run on the Siemens Nephelometer II) was measured centrally at Quest Diagnostics. Neither the serum creatinine nor the serum cystatin C levels were calibrated against an international standard. These renal parameters were measured under fasting conditions for at least 8 hours at study entry (baseline), at week 24, at week 48, and every 48 weeks afterwards through 96 weeks past the last A5202 participant enrollment.
Abbott Pharmaceuticals, Bristol-Myers Squibb, Gilead Sciences, and GlaxoSmithKline provided the study medications. The decision to publish the manuscript was solely that of the academic authors. All the authors participated in the trial design, data analysis, and preparation of the manuscript, and all the authors vouch for the completeness and accuracy of the reported data.
Study Participants
To be included in the parent A5202 trial [27], participants were required to have a screening creatinine clearance by Cockcroft-Gault >60 mL/min. The protocol initially did not exclude participants with active hepatitis B but was later amended to exclude participants with a positive hepatitis B surface antigen result within 6 months of study entry. To be included in A5224s, participants also could not have uncontrolled thyroid disease or American Diabetes Association-defined diabetes mellitus. The human subjects' ethics committee at each participating center approved the study protocol, and written informed consent was obtained from all participants in compliance with the human experimentation guidelines of the US Department of Health and Human Services and the Declaration of Helsinki.
Statistical Analysis
The prespecified secondary study objectives of A5224s were to compare renal function changes from baseline to week 96 between pooled and randomized NRTI components (abacavir/lamivudine vs tenofovir/emtricitabine with third drug combined) and between NNRTI and PI components (atazanavir/ritonavir vs efavirenz with NRTI combined). All analyses were performed using intent-to-treat principles based on randomized treatment assignment. All available data and modifications to randomized treatment were included in these analyses. For all comparisons, a factorial analysis approach was used, and, after assessing for treatment effect modification by the other component, the NRTI effect was assessed by combining efavirenz and atazanavir/ritonavir arms and vice versa. The P values below .05 (<.10 for assessing treatment effect modification) were considered statistically significant, and nominal values are reported without adjustment for multiple comparisons. Analyses were performed using SAS, version 9.2 (SAS Institute Inc., Cary, NC).
Comparisons of mean changes between regimen components used 2-sample t tests in the absence of regimen interactions and adjusted linear regression if interactions existed. Linear regression, adjusted for NRTI and NNRTI/PI components, was also used to assess the association of both baseline renal function stratum (<90 vs ≥90 mL/min for estimated creatinine clearance or <90 vs ≥90 mL/min per 1.732 for each of the 4 eGFR measures) and screening HIV-1 RNA level stratum (<100 000 vs ≥100 000 copies/mL) with change in renal function at week 96. To assess baseline factors independently associated with renal function change, multivariable linear regression models were constructed initially consisting of factors with univariate P values <.20 and then, using backwards selection, retained factors with a P value <.05. The prespecified baseline factors were age, sex, race/ethnicity, HIV-1 RNA, CD4 cell count, urine dipstick protein (negative vs nonnegative), systolic blood pressure, diastolic blood pressure, viral hepatitis B or C coinfection, homeostasis model assessment-insulin resistance (using fasting insulin and glucose measures) [28], weight, body mass index, and total body lean mass from dual-energy x-ray absorptiometry measurements.
The sample size estimate was based on the primary A5224s objective of changes in fat distribution [29]. Complete details of the randomization procedures are described elsewhere [13].
RESULTS
Participant Characteristics
A total of 271 participants from 37 ACTG sites enrolled in A5224s. Two participants were subsequently found to be ineligible; thus, 269 were included in the analysis population. Enrollment spanned from October 5, 2005 to November 7, 2007. The disposition of these participants during the trial has been described previously. The baseline characteristics of the randomized participants are summarized in Table 1. The baseline levels of renal function using all 5 estimating equations were well balanced by randomization amongst the 4 arms. However, the 5 renal estimating equations varied for baseline levels of renal function, with MDRD and 2012 CKD-EPI cystatin C equations resulting in the lowest renal function estimates and with Cockcroft-Gault resulting in the highest.
Table 1.
Baseline Characteristics of the 269 A5224s Study Participantsa,b
| Efavirenz |
Atazanavir/Ritonavir |
Total (n = 269) | |||
|---|---|---|---|---|---|
| Baseline Characteristic | Tenofovir/ emtricitabine (n = 69) | Abacavir/ lamivudine (n = 70) | Tenofovir/ emtricitabine (n = 65) | Abacavir/ lamivudine (n = 65) | |
| Age, y | 39 (10) | 39 (10) | 38 (10) | 37 (10) | 38 (10) |
| Men, n (%) | 58 (84) | 56 (80) | 56 (86) | 59 (91) | 229 (85) |
| Race or ethnicity, n (%) | |||||
| Black, non-Hispanic | 22 (32) | 20 (29) | 21 (32) | 27 (42) | 90 (33) |
| White, non-Hispanic | 37 (54) | 34 (49) | 26 (40) | 29 (45) | 126 (47) |
| Hispanic | 8 (12) | 14 (20) | 14 (22) | 8 (12) | 44 (16) |
| Other | 2 (2) | 2 (2) | 4 (6) | 1 (1) | 9 (4) |
| Body mass index, kg/m2 | 24.7 (4.0) | 25.5 (4.6) | 26.2 (5.4) | 25.7 (4.5) | 25.5 (4.7) |
| CD4 cell count/µL | 248 (160) | 231 (167) | 226 (142) | 238 (189) | 236 (165) |
| HIV-1 RNA level,b log10 copies/mL | 4.6 (0.7) | 4.6 (0.6) | 4.6 (0.7) | 4.7 (0.7) | 4.6 (0.7) |
| <100 000 copies/mL, n (%) | 56 (81) | 59 (84) | 52 (80) | 48 (74) | 215 (80) |
| ≥100 000 copies/mL, n (%) | 13 (19) | 11 (16) | 13 (20) | 17 (26) | 54 (20) |
| Hepatitis B surface antigen positive, n (%) | 5 (7) | 3 (4) | 0 (0) | 1 (2) | 9 (3) |
| Hepatitis C antibody positive, n (%) | 5 (7) | 8 (11) | 3 (5) | 7 (11) | 23 (9) |
| Systolic blood pressure, mm Hg | 119 (15) | 122 (14) | 121 (10) | 120 (13) | 121 (13) |
| Diastolic blood pressure, mm Hg | 75 (9) | 77 (10) | 75 (7) | 75 (11) | 76 (9) |
| HOMA-IR | 1.2 (1.7) | 1.6 (1.5) | 1.5 (2.1) | 1.4 (1.4) | 1.4 (1.7) |
| Creatinine clearance using Cockcroft-Gault, mL/min | 118.3(24.5) | 122.2 (35.3) | 124.0 (35.4) | 124.0 (33.0) | 122.1 (32.2) |
| <90 mL/min, n (%) | 8 (12) | 15 (22) | 12 (19) | 8 (13) | 43 (16) |
| eGFR using MDRD, mL/min per 1.732 | 100.6 (18.4) | 100.0 (23.6) | 100.0 (25.8) | 103.0 (20.3) | 100.9 (22.0) |
| <90 mL/min per 1.732, n (%) | 21 (31) | 25 (37) | 24 (39) | 16 (25) | 86 (33) |
| eGFR using 2009 CKD-EPI, mL/min per 1.732 | 107.1 (15.1) | 105.7 (19.4) | 106.3 (20.5) | 109.3 (16.6) | 107.1 (17.9) |
| <90 mL/min per 1.732, n (%) | 10 (15) | 17 (25) | 16 (26) | 9 (14) | 53 (20) |
| eGFR using 2012 CKD-EPI CysC, mL/min per 1.732 | 101.8 (19.2) | 95.0 (19.7) | 99.5 (21.1) | 101.4 (20.6) | 99.4 (20.2) |
| <90 mL/min per 1.732, n (%) | 18 (26) | 27 (40) | 20 (32) | 17 (27) | 82 (31) |
| eGFR using 2012 CKD-EPI CysC-Cr, mL/min per 1.732 | 104.8 (15.6) | 99.7 (17.0) | 102.9 (19.2) | 105.3 (17.0) | 103.2 (17.2) |
| <90 mL/min per 1.732, n (%) | 11 (16) | 17 (25) | 15 (24) | 13 (20) | 56 (21) |
| Urine dipstick proteinuria,c n (%) | 16 (24) | 22 (31) | 20 (33) | 17 (27) | 75 (29) |
Abbreviations: CKD-EPI, Chronic Kidney Diseases Epidemiology Collaboration; Cr, creatinine; CysC, cystatin C; eGFR, estimated glomerular filtration rate; HIV, human immunodeficiency virus; HOMA-IR, homeostasis model assessment-insulin resistance; MDRD, Modification of Diet in Renal Diseases.
a All data presented as mean (standard deviation) or as number (percent). Numbers of missing data for the renal function estimates and for urine dipstick proteinuria were <10 each for the entire study population.
b HIV-1 RNA strata defined as either <100 000 vs ≥ 100 000 copies/mL at screening.
c Urine dipstick proteinuria defined as any result that was nonnegative.
Changes in Renal Function Over Time
The mean (95% confidence interval [CI]) renal function estimates over time using the 5 different estimating equations are shown in Figure 1. The magnitudes and directions of the change in eGFR depended on the estimating equation used. For example, with the MDRD and the 2009 CKD-EPI equations, renal function either did not appreciably change or declined with all treatments. On the other hand, both 2012 cystatin C-based equations resulted in changes in eGFR that increased or did not appreciably change with treatment. In general, tenofovir/emtricitabine with atazanavir/ritonavir resulted in the worst (least positive or most negative) changes in eGFR of the 4 treatment arms at 96 weeks with all 5 equations.
Figure 1.
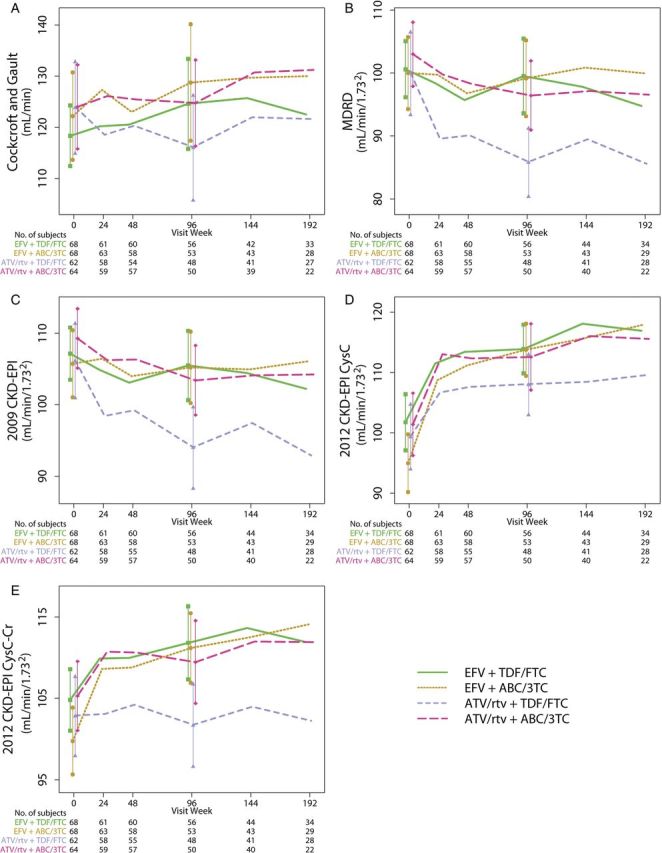
Renal function estimates (mean [95% confidence interval]) by treatment assignment over time using each of the 5 estimating formula. A, Estimated creatinine clearance using the Cockcroft-Gault equation. B, Estimated glomerular filtration rate (eGFR) using the Modification of Diet in Renal Disease (MDRD) equation. C, eGFR using the 2009 Chronic Kidney Disease Epidemiology Collaboration (CKD-EPI) equation. D, eGFR using the 2012 CKD-EPI cystatin C (CysC) equation. E, eGFR using the 2012 CKD-EPI cystatin C-creatinine (CysC-Cr) equation. Abbeviations: ABC/3TC, abacavir/lamivudine; ATV/rtv, atazanavir/ritonavir; EFV, efavirenz; TDF/FTC, tenofovir/emtricitabine.
The changes in eGFR using all 5 equations were greater (or less negative) with abacavir/lamivudine compared with tenofovir/emtricitabine and were also greater (or less negative) with efavirenz than with atazanavir/ritonavir (see Supplementary Table 1). Of note, 2 participants developed a creatinine clearance <60 mL/min using Cockcroft-Gault, and 3, 2, 1, and 0 participants, respectively, developed eGFR <60 mL/min per 1.732 at week 96 with MDRD, 2009 CKD-EPI, 2012 CKD-EPI cystatin C, and 2012 CKD-EPI cystatin C-creatinine.
Effects of Interactions Between Treatment Components, Initial HIV-1 RNA, and Initial Renal Function
Significant interactions were found for change in eGFR from baseline to week 96 between NRTI treatment groups and the NNRTI/PI treatment groups with Cockcroft-Gault, MDRD, and the 2009 CKD-EPI equations, but not with the two 2012 CKD-EPI equations (see Supplementary Table 1 and Figures 2 and 3). In particular, tenofovir/emtricitabine with atazanavir/ritonavir had significantly worse eGFR changes compared with tenofovir/emtricitabine with efavirenz. Significant treatment interactions between treatment group and initial HIV-1 RNA strata were only found for efavirenz vs atazanavir/ritonavir using 2009 CKD-EPI and 2012 CKD-EPI cystatin C-creatinine; in particular, atazanavir/ritonavir was associated with worse changes in eGFR compared with efavirenz within the <100 000 copies/mL stratum but not the ≥100 000 copies/mL stratum. There were no significant 3-way interactions between the NRTI treatment components, the NNRTI/PI component, and initial HIV-1 RNA strata (data not shown).
Figure 2.
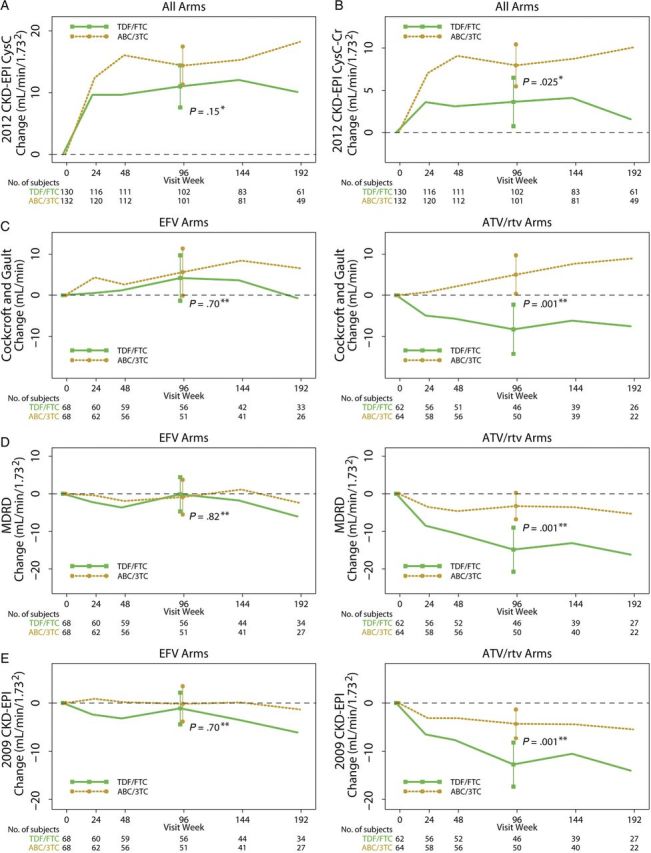
Changes in renal function estimates (mean [95% confidence interval]) by nucleoside reverse-transcriptase treatment component. No significant interactions were noted between nucleoside reverse-transcriptase inhibitor (NRTI) and non-NRTI (NNRTI)/protease inhibitor (PI) treatment components using the 2012 Chronic Kidney Disease Epidemiology Collaboration (CKD-EPI) cystatin C equation (A) or the 2012 CKD-EPI cystatin C-creatinine equation (B). Thus, we pooled the NRTI groups in the figure panels for these 2 equations. However, because treatment interactions were noted using the Cockcroft-Gault equation (C), Modification of Diet in Renal Disease (MDRD) equation (D), and the 2009 CKD-EPI equation (E), the changes in renal function when the NRTI components are combined with either an NNRTI or PI are shown separately to highlight these differences. *P value for 2-sample t test; **P value for linear regression model adjusting for the other treatment component and the component interaction. Abbreviations: ABC/3TC, abacavir/lamivudine; ATV/rtv, atazanavir/ritonavir; Cr, creatinine; CysC, cystatin C; EFV, efavirenz; TDF/FTC, tenofovir/emtricitabine.
Figure 3.
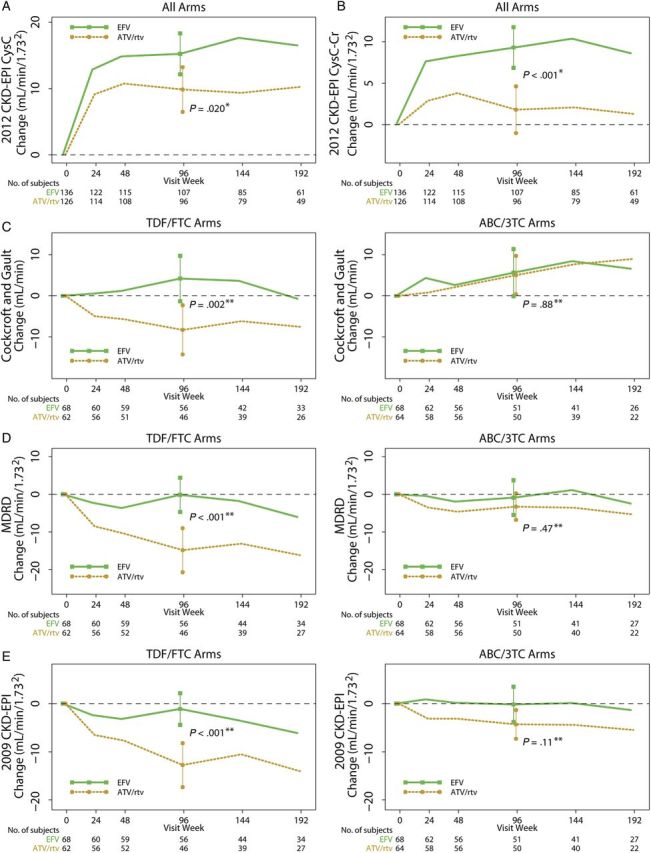
Changes in renal function estimates [mean (95% confidence interval)] by nonnucleoside reverse-transcriptase inhibitor (NNRTI) vs protease inhibitor (PI) component. No significant interactions were noted between NRTI and NNRTI/PI treatment components using the 2012 Chronic Kidney Disease Epidemiology Collaboration (CKD-EPI) cystatin C equation (A) or the 2012 CKD-EPI cystatin C-creatinine equation (B). Thus, we pooled the NNRTI/PI groups in the figure panels for these 2 equations. However, because treatment interactions were noted using the Cockcroft-Gault equation (C), Modification of Diet in Renal Disease (MDRD) equation (D), and the 2009 CKD-EPI equation (E), the changes in renal function when the NNRTI/PI components are combined with each of the 2 NRTI components are shown separately to highlight these differences. *P value for 2-sample t test; **P value for linear regression model adjusting for the other treatment component and the component interaction. ABC/3TC, abacavir/lamivudine; ATV/rtv, atazanavir/ritonavir; Cr, creatinine; CysC, cystatin C; EFV, efavirenz; TDF/FTC, tenofovir/emtricitabine.
There were no significant interactions between either the NRTI components or the NNRTI/PI components and initial renal function strata using any of the 5 renal function equations. In general, combined across arms, those within the lower initial renal function stratum of <90 mL/min (for creatinine clearance) or <90 mL/min per 1.732 (for eGFR) had significantly greater improvements (or less declines) in renal function (mean [95% CI]) compared with those in the higher initial renal function stratum using MDRD (3.0 [−0.7, 6.8] vs −8.4 [−11.0, −5.7]), 2009 CKD-EPI (2.3 [−1.4, 6.0] vs −6.3 [−8.2, −4.3]), 2012 CKD-EPI cystatin C (26.1 [22.7, 29.5] vs 6.5 [4.2, 8.8]), and 2012 CKD-EPI cystatin C-creatinine (14.1 [10.5, 17.7] vs 3.3 [1.3, 5.2]) (all P < .001); the improvements in the lower renal function stratum were nonsignificantly greater than those in the higher stratum using Cockcroft-Gault (6.3 [−0.5, 13.0] vs 1.0 [−1.9, 3.9]; P = .16).
Associations Between Baseline Factors and Changes in Renal Function At Week 96
We performed multivariable regression models adjusted for treatment components to evaluate the associations of baseline factors with renal function change at week 96 using the 3 CKD-EPI equations (Table 2). Assignment to abacavir/lamivudine vs tenofovir/emtricitabine was variably associated with 96-week changes in renal function, whereas assignment to atazanavir/ritonavir remained independently associated with worse renal function change compared with efavirenz in these multivariable models. However, other baseline factors (including race/ethnicity, initial HIV-1 RNA level, initial presence of urine dipstick proteinuria, and initial systolic blood pressure) were variably associated with week 96 renal function change depending on which CKD-EPI renal function estimating equation was used.
Table 2.
Multivariable Models of the Effects of Baseline Factors on Change in Renal Function at 96 Weeks With the 3 CKD-EPI Estimating Equationsa
| 2009 CKD-EPI |
2012 CKD-EPI CysC |
2012 CKD-EPI CysC-Cr |
||||
|---|---|---|---|---|---|---|
| Baseline Factor | Estimated mean change (95% CI) | P value | Estimated mean change (95% CI) | P value | Estimated mean change (95% CI) | P value |
| ATV/rtv (vs EFV) | −11.7 (−16.7, −6.6) | <.001 | −6.3 (−10.7, −1.8) | .006 | −8.0 (−11.6, −4.4) | <.001 |
| ABC/3TC (vs TDF/FTC) | 0.9 (−4.0, 5.8) | .70 | 4.3 (−0.1, 8.7) | .058 | 4.9 (1.3, 8.5) | .008 |
| ABC/3TC*ATV/rtv interaction (vs not ABC/3TC and ATV/rtv) | 7.5 (0.4, 14.6) | .039 | ||||
| Race/ethnicity | ||||||
| Non-Hispanic Black vs non-Hispanic White | −3.4 (−8.5, 1.6) | .047 | ||||
| Hispanic (any race) vs non-Hispanic White | −7.8 (−14.2, −1.4) | |||||
| HIV-1 RNA (per 1 log10 copies/mL higher) | 5.8 (2.5, 9.2) | .001 | 3.3 (0.6, 6.0) | .017 | ||
| Negative urine dipstick protein (vs nonnegative urine dipstick protein) | −6.9 (−12.0, −1.8) | .008 | ||||
| Systolic blood pressure (per 10 mmHg higher) | −2.0 (−3.7, −0.3) | .025 | ||||
Abbreviations: ABC, abacavir; ATV/rtv, atazanavir/ritonavir; CKD-EPI, Chronic Kidney Disease Epidemiology Collaboration; Cr, creatinine; CysC, cystatin C; EFV, efavirenz; HIV, human immunodeficiency virus; HOMA-IR, homeostasis model assessment-insulin resistance; 3TC, lamivudine; TDF, tenofovir.
a Results are presented after adjustment for treatment components, and only variables with significant associations using at least 1 CKD estimating equation are shown in the table. Other variables assessed in the models but not found to be statistically significantly associated with week 96 renal function change with any CKD estimating equation include the following: age, male vs female, body mass index, HIV-1 RNA stratum (<100 000 vs ≥100 000 copies/mL), CD4 cell count, diastolic blood pressure, hepatitis B or C coinfections, HOMA-IR, and weight.
b All renal function data in units of mL/min per 1.732.
DISCUSSION
Because currently recommended antiretroviral regimens for initial treatment have become similarly and consistently efficacious in controlling viral replication, treatment-associated complications, including nephrotoxicities, have become increasingly important in choosing therapy. To our knowledge, this is the first study utilizing the 2012 cystatin C-based GFR estimating formulae in determining the changes in renal function with initiation of ART in patients infected with HIV. As such, we have shown that the changes in eGFR associated with initiation of these regimens, and, in turn, the interpretations of their nephrotoxicity profiles depend greatly on which renal function estimating equation is used.
Our results confirm those from other studies that have found worse changes in eGFR with the initiation of tenofovir compared with other NRTIs, especially in those receiving concomitant PIs [4, 6–8], although not all studies have found poorer renal function changes with tenofovir compared with abacavir in randomized trials [9, 11, 30]. The parent trial of this renal substudy, ACTG 5202, found a significant relative decline in estimated creatinine clearance as estimated by Cockcroft-Gault with tenofovir/emtricitabine in combination with atazanavir/ritonavir compared with its combination with efavirenz [13]. We found similar differences in the A5224s substudy when using the 2009 CKD-EPI and 2012 CKD-EPI cystatin C-creatinine equations, although we did not find significant differences when using the 2012 CKD-EPI cystatin C equation. We also noted significant interactions between the nucleoside components and the third treatment component (efavirenz vs atazanavir/ritonavir) with Cockcroft-Gault, MDRD, and 2009 CKD-EPI, but not with either of the two 2012 equations incorporating cystatin C. In particular, the 96-week mean (95% CI) renal function changes for tenofovir/emtricitabine combined with atazanavir/ritonavir widely ranged from −14.9 (−19.7, −10.1) mL/min per 1.732 with MDRD to +8.9 (+4.2, +13.7) mL/min per 1.732 with 2012 CKD-EPI cystatin C. The ranges of renal function changes within the other treatment arms were similarly varied. Thus, the choice of renal function equation may indeed influence our understanding of the relative renal safety profiles of these antiretroviral regimens.
The mechanism by which tenofovir with PIs may lead to renal toxicity has been presumed to be due to accumulation of tenofovir in renal proximal tubule cells secondary to inhibition of efflux transporters by PIs, especially in genetically predisposed individuals [31, 32], although this has not been confirmed in all studies [33].
Atazanavir/ritonavir has also been recently linked with chronic kidney disease [14, 15], which has been speculated to be due to intrarenal crystallization of atazanavir with associated interstitial nephritis [34, 35]. The current study does indeed suggest that use of atazanavir/ritonavir is associated with worse renal function changes compared with efavirenz using any of the 5 estimating equations. As demonstrated in vitro, ritonavir may potentially increase serum creatinine concentrations via inhibition of creatinine efflux through the multidrug and toxin extrusion 1 (MATE1) transporter in the proximal tubule cell [36]. However, our data do not appear to be solely due to any potentially isolated effect of MATE1 inhibition by ritonavir. Using the 2012 CKD-EPI cystatin C equation (which does not include creatinine), eGFR increased in all groups, but there were still lower improvements in those assigned to abacavir/lamivudine with atazanavir/ritonavir compared with those assigned to abacavir/lamivudine with efavirenz (10.7 vs 18.0 mL/min per 1.732) and in those assigned to tenofovir/emtricitabine with atazanavir/ritonavir compared with those assigned to tenofovir/emtricitabine with efavirenz (8.9 vs 12.7 mL/min per 1.732) (see Supplementary Table 1). As shown in Figure 3A, we see that there remains a significant difference between eGFR changes using the 2012 CKD-EPI cystatin C equation when pooling the NRTI components. The differences in eGFR between atazanavir/ritonavir and efavirenz using an equation not incorporating serum creatinine are of similar magnitude to those when using creatinine-based equations. As such, atazanavir/ritonavir likely has an effect on eGFR independent of any possible serum creatinine increase due simply to MATE1 inhibition.
Interactions between the atazanavir/ritonavir or efavirenz components with the nucleoside treatment component were found, however, with the 3 equations incorporating only creatinine and not with those including cystatin C. In addition, significantly less beneficial changes in eGFR with atazanavir/ritonavir were found in those whose screening HIV-1 RNA levels were <100 000 copies/mL. It is possible that the potential adverse renal toxicity of atazanavir/ritonavir is unmasked in the lower viral load stratum because this group is less likely to benefit from improvements in renal function due to reduction in initial viremia, as might be expected in the higher stratum [37].
The key new finding in this study is that the apparent differences in renal function within treatment groups are highly dependent on the eGFR estimating equation used. No previous studies have used cystatin C-based estimating equations to assess the effects of antiretroviral initiation on renal function. A recent evaluation by Inker et al [23] in HIV-infected patients receiving virologically suppressive antiretroviral treatment suggested that the 2012 CKD-EPI equation incorporating both cystatin C and creatinine was marginally more accurate for estimating GFR than the 2012 CKD-EPI equation using only cystatin C and the 2009 CKD-EPI equation using only creatinine compared with iohexol clearance as the reference standard. Inker et al [21] has previously suggested that the greater accuracy of the 2012 CKD-EPI cystatin C-creatinine equation may be due to reduced variances of postulated non-GFR determinants of these 2 renal markers, such as inflammation, when used together as opposed to using each alone. Gagneux-Brunon et al [25] performed a similar study in an HIV-infected European cohort, which had appreciably different demographic characteristics than the one studied by Inker et al [21], and did not find significant differences amongst the 3 CKD-EPI equations. However, both studies demonstrated that the MDRD equation was significantly less accurate than any of the CKD-EPI equations. It should be noted that these newer equations have not been validated against direct GFR measurement methods in HIV-infected, treatment-naive patients. As such, the improvements in renal function, especially those found in the first 24 weeks (as shown in Figures 2 and 3), with the cystatin C-based equations may not only reflect true improvements in GFR but might also be influenced by reductions in inflammation and viremia or by improvements in CD4 cell counts, all of which have been variably associated with cystatin C levels [38]. In fact, the recent study by Bhasin et al [24] suggests that the 2012 CKD-EPI cystatin C equation, but not the other 2 CKD-EPI equations, was biased against true GFR measurement by greater T cell activation, higher HIV-1 RNA levels, and use of ART.
Using the 2012 CKD-EPI cystatin C-creatinine equation, we consider that treatment with tenofovir/emtricitabine with atazanavir/ritonavir has no noticeable effect on renal function at 96 weeks (mean change −1.2 [95% CI, −5.1, 2.6] mL/min per 1.732) and that treatment with the other once-daily regimens in this study would lead to improved renal function. On the other hand, using either the MDRD equation or the 2009 CKD-EPI equation, we conclude that there are significant declines from baseline in eGFR with tenofovir/emtricitabine combined with atazanavir/ritonavir with essentially neutral effects with the other 3 treatment arms. It is plausible to find that renal function generally improves with any ART given the known detrimental effects of untreated HIV on renal function, even in those without classic risk factors for HIV-associated nephropathy such as patients of black race [37]. Indeed, we found that the improvements in renal function were better in those with initial eGFR lower than 90 mL/min per 1.732, which supports the concept that untreated HIV does indeed have negative effects on renal function. Thus, the neutral changes found with tenofovir/emtricitabine using the 2012 CKD-EPI cystatin C-creatinine equation may be due to opposing effects of toxicity from this particular regimen and the benefits of virologic suppression.
Recent evidence suggests that the 2012 CKD-EPI cystatin C-creatinine equation is the most accurately available method to identify patients, including those with HIV infection, with reduced renal function who have the highest risk of long-term adverse outcomes [18, 20]. Since our data suggest that eGFR using the 2012 CKD-EPI combined equation improves at 96 weeks with use of tenofovir/emtricitabine with efavirenz, abacavir/lamivudine with efavirenz, or abacavir/lamivudine with atazanavir/ritonavir, then long-term outcomes may improve in those receiving any of these three regimens. However, eGFR using the 2012 CKD-EPI combined equation did not change at 96 weeks with use of tenofovir/emtricitabine with atazanavir/ritonavir; this may suggest that the contribution of renal function to long-term outcomes may not be impacted (either positively or negatively) with the use of this particular regimen. However, additional research is needed to determine whether using the 2012 CKD-EPI cystatin C-creatinine equation for routine clinical monitoring of renal function in those receiving ART actually leads to changes in management that would prevent future complications in those with reduced renal function. It should be noted that, regardless of the estimating equation used, the development of eGFR <60 mL/min per 1.732 at 96 weeks was infrequent in this trial.
We also developed 3 different multivariable models to identify baseline factors associated with 96-week renal function changes using the 3 CKD-EPI equations. We found that the baseline factors assessed were variably associated with changes in eGFR depending on the equation used. These results again suggest that the choice of eGFR estimating equation directly impacts our understanding of which factors are responsible for changes in renal function in HIV-infected patients initiating treatment.
The limitations of this study should be acknowledged. We did not directly measure renal function to validate and identify the most accurate estimating equation for these patients initiating antiretrovirals. Although our study is one of the longest to assess changes in renal function with initiation of ART, we cannot make any conclusions regarding differences between regimens beyond 96 weeks. Our results may not be generalizable to patients with pretreatment creatinine clearance <60 mL/min or to those with diabetes, groups that were excluded from this substudy. Although we measured cystatin C centrally, we did not do so for creatinine. We also acknowledge that neither creatinine nor cystatin C were calibrated against international standards, which may lead to analytical drift of the measurements [39]. However, because we assessed changes in renal function, the potential variability of these results due to the lack of either centralized or standardized measurement is somewhat minimized. Another limitation was the lack of blinding for the efavirenz and atazanavir/ritonavir treatment components, although the nucleoside treatment components were blinded. Finally, these analyses were performed without adjustment for multiple comparisons, thereby increasing the possibility of type I errors for falsely detecting differences.
In summary, we found that initiation of ART with tenofovir/emtricitabine and atazanavir/ritonavir led to less beneficial changes in eGFR at 96 weeks compared with abacavir/lamivudine and efavirenz, respectively. However, the magnitudes, directions, and statistical significances of these changes in renal function varied with the estimating equation used. If the newer cystatin C-based equations are indeed confirmed to be more clinically useful, then the renal profiles of antiretroviral regimens should be reinterpreted and, as such, would have important implications for HIV clinical care.
Supplementary Data
Supplementary materials are available at The Journal of Infectious Diseases online (http://ofid.oxfordjournals.org/). Supplementary materials consist of data provided by the author that are published to benefit the reader. The posted materials are not copyedited. The contents of all supplementary data are the sole responsibility of the authors. Questions or messages regarding errors should be addressed to the author.
Notes
Acknowledgments. We thank the study participants for their generous donation of time and effort in the successful completion of this trial. We also thank Drs Pablo Tebas and Lynda Szczech for their contributions in the design and conduct of ACTG A5224s. We also thank the following participating sites and site investigators: Sadia Shaik, MD and Ruben Lopez, MD were supported by Harbor-UCLA Medical Center (Site 603) CTU Grant no. AI0694241 and UL1-RR033176; Susan L. Koletar, MD and Diane Gochnour, RN were supported by The Ohio State University Medical Center (Site 2301) CTU Grant no. AI069474; Geyoul Kim RN and Mark Rodriguez, RN were supported by Washington University (Site 2101) CTU Grant no. U01AI069495 and GCRC Grant no. UL1 RR024992; Elizabeth Lindsey, RN and Tamara James, BS were supported by Alabama Therapeutics CRS (Site 5801) CTU Grant no. U01 AI069452; Ann C. Collier, MD and Jeffrey Schouten, MD, JD were supported by University of Washington (Site 1401) CTU Grant no. AI069434 and UL1 RR025014; Jorge L. Santana Bagur, MD and Santiago Marrero, MD were supported by Puerto Rico-AIDS Clinical Trials Unit (Site 5401) CTU Grant no. 5 U0I AI069415-03; Jenifer Baer, RN, BSN and Carl Fichtenbaum, MD were supported by University of Cincinnati (Site 2401) CTU Grant no. AI069513; Patricia Walton, BSN, RN and Barbara Philpotts, BSN, RN were supported by Case Western Reserve (Site 2501) CTU Grant no. AI69501; Princy Kumar, MD and Joseph Timpone, MD were supported by Georgetown University (Site 1008) CTU ACTG Grant no. 5U01AI069494; Donna Pittard, RN, BSN and David Currin, RN were supported by University of North Carolina (Site 3201) CTU Grant no. 5-U01 AI069423-03, UNC CFAR no. P30 AI050410 (-11), and UNC CTRC no. UL 1RR 025747; Julie Hoffman, RN and Edward Seefried, RN were supported by San Diego Medical Center UC (Site 701) CTU Grant no. AI69432; Susan Swindells, MBBS and Frances Van Meter, APRN were supported by University of Nebraska (Site 1505) CTU Grant no. AI 27661; Deborah McMahon, MD and Barbara Rutecki, MSN, MPH, CRNP were supported by University of Pittsburgh (Site 1001) CTU Grant no. 1 U01 AI069494-01; Michael P. Dube, MD and Martha Greenwald, RN, MSN were supported by Indiana University (Site 2601) CTU Grant no. 5U01AI025859 and GCRC no. M01 RR00750; Ilene Wiggins, RN, and Eric Zimmerman, RN were supported by Johns Hopkins University (Site 201) CTU Grant no. AI27668 and CTSA Grant no. UL1 RR025005; Judith Aberg, MD and Margarita Vasquez, RN were supported by New York University/NYCHHC at Bellevue Hospital Center (Site 401) CTU Grant no. AI27665 and New Grant no. AI069532; Martin McCarter and M. Graham Ray, RN, MSN were supported by Colorado AIDS Clinical Trials Unit (Site 6101) CTU Grant no. AI69450 and RR025780; Mamta Jain, MD, Principle Investigator and Tianna Petersen, MS were supported by University of Texas Southwestern Medical Center (Site 3751) CTU Grant no. 3U01AI046376-05S4; Emily Stumm, BS and Pablo Tebas, MD were supported by University of Pennsylvania, Philadelphia (Site 6201) CTU Grant no. P30-AI0450008-11 and CFAR Grant no. UO1-AI069467-04; Mary Albrecht, MD and Neah Kim, NP were supported by Beth Israel Deaconess (Partners/Harvard) CRS (Site 103) CTU Grant no. U01 AI069472-04; Paul Edward Sax, MD and Joanne Delaney, RN were supported by Brigham and Women's Hospital (Site 107) CTU Grant no. UOI AI 069472; Christine Hurley, RN and Roberto Corales, DO were supported by AIDS Care (Site 1108) CTU Grant no. U01AI069511-02 (as of 2/12/08) and GCRC Grant no. UL1 RR 024160; Keith Henry, MD and Bette Bordenave, RN were supported by Hennepin County Medical Center (Site 1502) CTU Grant no. N01 AI72626; Wendy Armstrong, MD and Ericka R. Patrick, RN, MSN, CCRC were supported by Emory University HIV/AIDS Clinical Trails Unit (Site 5802) CTU Grant no. UO1Al69418-01 and CFAR Grant no. P30Al050409; Jane Reid, RNC, MS and Mary Adams, RN, MPh were supported by University of Rochester (Site 1101) CTU Grant no. U01AI069511-02 (as of 2/12/08) and GCRC Grant no. UL1 RR 024160; Gene D. Morse, PharmD, FCCP, BCPS was supported by SUNY at Buffalo, Erie County Medical Center (Site 1102) CTU Grant no. AI27658; Michael P. Dube, MD and Martha Greenwald, RN, MSN were supported by Wishard Memorial Hospital Indiana University (Site 2603) CTU Grant no. 5U01AI025859 and GCRC no. M01 RR00750; Kimberly Y. Smith, MD, MPH and Joan A. Swiatek, APN were supported by Rush University Medical Center (Site 2702) CTU Grant no. U01 AI069471; Nancy Hanks, RN and Debra Ogata-Arakaki, RN were supported by University of Hawaii at Manoa, Leahi Hospital (Site 5201) CTU Grant no. AI34853; Ardis Moe, MD and Maria Palmer, PA-C were supported by UCLA Medical Center (Site 601) CTU Grant no. U01AI069424-01; Jeffery Meier, MD and Jack T. Stapleton, MD were supported by University of Iowa Hospitals and Clinics (Site 1504) CTU Grant no. UL1RR024979; Gary Matthew Cox, MD and Martha Silberman, RN were supported by Duke University Medical Center Adult CRS (Site 1601) CTU Grant no. 5U01 AI069 484-02; Gerianne Casey, RN and William O'Brien MD were supported by University of Texas, Galveston (Site 6301) CTU Grant no. AI32782; Valery Hughes, FNP and Todd Stroberg, RN were supported by Cornell CRS (Sites 7803 and 7804) CTU Grant no. U01 AI069419 and CTSC Grant no. UL1 RR024996; Nyef El-Daher, MD was supported by McCree McCuller Wellness Center at the Connection (Site 1107) CTU Grant no. U01AI069511-02 (as of 2/12/08) and GCRC Grant no. UL1 RR 024160; Rebecca J. Basham, BS and Husamettin Erdem, MD were supported by Vanderbilt Therapeutics CRS (Site 3652) CTU Grant no. AI46339-01 and MO1 RR 00095.
Author contributions. S. K. G., G. A. M., and D. K. had access to all the data in the study and take responsibility for the integrity of the data and the accuracy of the data analysis. D. K., C. T., E. S. D., P. E. S., K. M., B. H., and G. A. M. were responsible for study conception and design. S. K. G., D. K., C. T., E. S. D., and G. A. M. were responsible for data analysis and interpretation. E. S. D., P. E. S., and G. A. M. were responsible for acquisition of data. S. K. G. and D. K. were responsible for drafting of the article. C. T., E. S. D., P. E. S., K. M., B. H., and G. A. M. were responsible for critical revision of the manuscript. S. K. G., D. K., C. T., E. S. D., P. E. S., K. M., B. H., and G. A. M. were responsible for final approval of the submission of the manuscript.
Disclaimer. The content is solely the responsibility of the authors and does not necessarily represent the official views of the National Institute of Allergy and Infectious Diseases or the National Institutes of Health. Study medications were provided by Abbott Pharmaceuticals, Bristol-Myers Squibb, Gilead Sciences, and GlaxoSmithKline. Abbott Pharmaceuticals, Bristol-Myers Squibb, Gilead Sciences, and GlaxoSmithKline did not participate in the design and conduct of the study or the collection, management, analysis, interpretation of the data, or the preparation, review, or approval of the article.
Financial support. This work was supported by Award Numbers U01AI068636, AI068634, AI38855 from the National Institute of Allergy and Infectious Diseases; UL1 RR 025005 from the National Center for Research Resources and the National Center for Advancing Translational Sciences; the National Institutes of Health supported by National Institute of Mental Health; and the National Institute of Dental and Craniofacial Research.
Potential conflicts of interest. S. K. G. has received research grants from Merck & Co., Inc., Janssen Pharmaceutics, Inc., and Gilead Sciences, Inc.; travel support from Gilead Sciences, Inc.; and advisory/consultancy/lecture fees from Bristol-Myers Squibb and Merck & Co., Inc. C. T. has received payment for participation on a data monitoring committee for Janssen Therapeutics. E. S. D. has received research grants from Bristol-Myers Squibb, Gilead Sciences, Inc., Merck & Co., Inc., and ViiV Healthcare and has received consultancy/advisory fees from Bristol-Myers Squibb, Gilead Sciences, Inc., Janssen Pharmaceuticals., Inc., Merck & Co., Inc., Abbvie, Inc., Teva, and ViiV Healthcare. P. E. S. has received research grants from Bristol-Myers Squibb, Gilead Sciences, Inc., and GlaxoSmithKline, and is a consultant or scientific advisory board member for Bristol-Myers Squibb, Gilead Sciences, Inc., Merck & Co., Inc., GlaxoSmithKline, and Janssen Pharmaceuticals, Inc. K. M. is an employee and stockholder in Gilead Sciences, Inc. B. H. is an employee and stockholder of ViiV Healthcare. G. A. M. has served as a scientific advisor for Bristol-Myers Squibb, GlaxoSmithKline, Abbott, and Gilead Sciences, Inc.; has received payment for lectures from Bristol-Myers Squibb, GlaxoSmithKline, and Tibotec Therapeutics; has received research grants from Bristol-Myers Squibb, GlaxoSmithKline, Abbott, Merck & Co., Inc., and Gilead Sciences; and has served as the Data Safety Monitoring Board (DSMB) Chair for a Pfizer-sponsored study.
All authors have submitted the ICMJE Form for Disclosure of Potential Conflicts of Interest. Conflicts that the editors consider relevant to the content of the manuscript have been disclosed.
References
- 1.Gupta SK. Tenofovir-associated Fanconi syndrome: review of the FDA adverse event reporting system. AIDS Patient Care STDS. 2008;22:99–103. doi: 10.1089/apc.2007.0052. [DOI] [PubMed] [Google Scholar]
- 2.Winston JA, Bruggeman LA, Ross MD, et al. Nephropathy and establishment of a renal reservoir of HIV type 1 during primary infection. N Engl J Med. 2001;344:1979–84. doi: 10.1056/NEJM200106283442604. [DOI] [PubMed] [Google Scholar]
- 3.Reid A, Stohr W, Walker AS, et al. Severe renal dysfunction and risk factors associated with renal impairment in HIV-infected adults in Africa initiating antiretroviral therapy. Clin Infect Dis. 2008;46:1271–81. doi: 10.1086/533468. [DOI] [PubMed] [Google Scholar]
- 4.Young J, Schafer J, Fux CA, et al. Renal function in patients with HIV starting therapy with tenofovir and either efavirenz, lopinavir or atazanavir. AIDS. 2012;26:567–75. doi: 10.1097/QAD.0b013e32834f337c. [DOI] [PubMed] [Google Scholar]
- 5.Nishijima T, Gatanaga H, Komatsu H, et al. Renal function declines more in tenofovir- than abacavir-based antiretroviral therapy in low-body weight treatment-naive patients with HIV infection. PLoS One. 2012;7 doi: 10.1371/journal.pone.0029977. e29977. [DOI] [PMC free article] [PubMed] [Google Scholar]
- 6.Kalayjian RC, Lau B, Mechekano RN, et al. Risk factors for chronic kidney disease in a large cohort of HIV-1 infected individuals initiating antiretroviral therapy in routine care. AIDS. 2012;26:1907–15. doi: 10.1097/QAD.0b013e328357f5ed. [DOI] [PMC free article] [PubMed] [Google Scholar]
- 7.Goicoechea M, Liu S, Best B, et al. Greater tenofovir-associated renal function decline with protease inhibitor-based versus nonnucleoside reverse-transcriptase inhibitor-based therapy. J Infect Dis. 2008;197:102–8. doi: 10.1086/524061. [DOI] [PubMed] [Google Scholar]
- 8.Albini L, Cesana BM, Motta D, et al. A randomized, pilot trial to evaluate glomerular filtration rate by creatinine or cystatin C in naive HIV-infected patients after tenofovir/emtricitabine in combination with atazanavir/ritonavir or efavirenz. J Acquir Immune Defic Syndr. 2012;59:18–30. doi: 10.1097/QAI.0b013e31823a6124. [DOI] [PubMed] [Google Scholar]
- 9.Post FA, Moyle GJ, Stellbrink HJ, et al. Randomized comparison of renal effects, efficacy, and safety with once-daily abacavir/lamivudine versus tenofovir/emtricitabine, administered with efavirenz, in antiretroviral-naive, HIV-1-infected adults: 48-week results from the ASSERT study. J Acquir Immune Defic Syndr. 2010;55:49–57. doi: 10.1097/QAI.0b013e3181dd911e. [DOI] [PubMed] [Google Scholar]
- 10.Cohen CJ, Andrade-Villanueva J, Clotet B, et al. Rilpivirine versus efavirenz with two background nucleoside or nucleotide reverse transcriptase inhibitors in treatment-naive adults infected with HIV-1 (THRIVE): a phase 3, randomised, non-inferiority trial. Lancet. 2011;378:229–37. doi: 10.1016/S0140-6736(11)60983-5. [DOI] [PubMed] [Google Scholar]
- 11.Smith KY, Patel P, Fine D, et al. Randomized, double-blind, placebo-matched, multicenter trial of abacavir/lamivudine or tenofovir/emtricitabine with lopinavir/ritonavir for initial HIV treatment. AIDS. 2009;23:1547–56. doi: 10.1097/QAD.0b013e32832cbcc2. [DOI] [PubMed] [Google Scholar]
- 12.Cockcroft DW, Gault MH. Prediction of creatinine clearance from serum creatinine. Nephron. 1976;16:31–41. doi: 10.1159/000180580. [DOI] [PubMed] [Google Scholar]
- 13.Daar ES, Tierney C, Fischl MA, et al. Atazanavir plus ritonavir or efavirenz as part of a 3-drug regimen for initial treatment of HIV-1. Ann Intern Med. 2011;154:445–56. doi: 10.1059/0003-4819-154-7-201104050-00316. [DOI] [PMC free article] [PubMed] [Google Scholar]
- 14.Mocroft A, Kirk O, Reiss P, et al. Estimated glomerular filtration rate, chronic kidney disease and antiretroviral drug use in HIV-positive patients. AIDS. 2010;24:1667–78. doi: 10.1097/QAD.0b013e328339fe53. [DOI] [PubMed] [Google Scholar]
- 15.Ryom L, Mocroft A, Kirk O, et al. Association between antiretroviral exposure and renal impairment among HIV-positive persons with normal baseline renal function: the D:A:D study. J Infect Dis. 2013;207:1359–69. doi: 10.1093/infdis/jit043. [DOI] [PMC free article] [PubMed] [Google Scholar]
- 16.Shlipak MG, Sarnak MJ, Katz R, et al. Cystatin C and the risk of death and cardiovascular events among elderly persons. N Engl J Med. 2005;352:2049–60. doi: 10.1056/NEJMoa043161. [DOI] [PubMed] [Google Scholar]
- 17.Peralta CA, Katz R, Sarnak MJ, et al. Cystatin C identifies chronic kidney disease patients at higher risk for complications. J Am Soc Nephrol. 2011;22:147–55. doi: 10.1681/ASN.2010050483. [DOI] [PMC free article] [PubMed] [Google Scholar]
- 18.Shlipak MG, Matsushita K, Arnlov J, et al. Cystatin C versus creatinine in determining risk based on kidney function. N Engl J Med. 2013;369:932–43. doi: 10.1056/NEJMoa1214234. [DOI] [PMC free article] [PubMed] [Google Scholar]
- 19.Choi A, Scherzer R, Bacchetti P, et al. Cystatin C, albuminuria, and 5-year all-cause mortality in HIV-infected persons. Am J Kidney Dis. 2010;56:872–82. doi: 10.1053/j.ajkd.2010.05.019. [DOI] [PMC free article] [PubMed] [Google Scholar]
- 20.Driver TH, Scherzer R, Peralta CA, et al. Comparisons of creatinine and cystatin C for detection of kidney disease and prediction of all-cause mortality in HIV-infected women. AIDS. 2013;27:2291–9. doi: 10.1097/QAD.0b013e328362e874. [DOI] [PMC free article] [PubMed] [Google Scholar]
- 21.Inker LA, Schmid CH, Tighiouart H, et al. Estimating glomerular filtration rate from serum creatinine and cystatin C. N Engl J Med. 2012;367:20–9. doi: 10.1056/NEJMoa1114248. [DOI] [PMC free article] [PubMed] [Google Scholar]
- 22.Levey AS, Bosch JP, Lewis JB, et al. A more accurate method to estimate glomerular filtration rate from serum creatinine: a new prediction equation. Modification of Diet in Renal Disease Study Group. Ann Intern Med. 1999;130:461–70. doi: 10.7326/0003-4819-130-6-199903160-00002. [DOI] [PubMed] [Google Scholar]
- 23.Inker LA, Wyatt C, Creamer R, et al. Performance of creatinine and cystatin C GFR estimating equations in an HIV-positive population on antiretrovirals. J Acquir Immune Defic Syndr. 2012;61:302–9. doi: 10.1097/QAI.0b013e31826a6c4f. [DOI] [PMC free article] [PubMed] [Google Scholar]
- 24.Bhasin B, Lau B, Atta MG, et al. HIV viremia and t-cell activation differentially affect the performance of glomerular filtration rate equations based on creatinine and cystatin C. PLoS One. 2013;8 doi: 10.1371/journal.pone.0082028. e82028. [DOI] [PMC free article] [PubMed] [Google Scholar]
- 25.Gagneux-Brunon A, Delanaye P, Maillard N, et al. Performance of creatinine and cystatin C-based glomerular filtration rate estimating equations in a European HIV-positive cohort. AIDS. 2013;27:1573–81. doi: 10.1097/QAD.0b013e32835fac30. [DOI] [PubMed] [Google Scholar]
- 26.Choi AI, Rodriguez RA, Bacchetti P, et al. Low rates of antiretroviral therapy among HIV-infected patients with chronic kidney disease. Clin Infect Dis. 2007;45:1633–9. doi: 10.1086/523729. [DOI] [PubMed] [Google Scholar]
- 27.Sax PE, Tierney C, Collier AC, et al. Abacavir-lamivudine versus tenofovir-emtricitabine for initial HIV-1 therapy. N Engl J Med. 2009;361:2230–40. doi: 10.1056/NEJMoa0906768. [DOI] [PMC free article] [PubMed] [Google Scholar]
- 28.Matthews DR, Hosker JP, Rudenski AS, Naylor BA, Treacher DF, Turner RC. Homeostasis model assessment: insulin resistance and beta-cell function from fasting plasma glucose and insulin concentrations in man. Diabetologia. 1985;28:412–9. doi: 10.1007/BF00280883. [DOI] [PubMed] [Google Scholar]
- 29.McComsey GA, Kitch D, Sax PE, et al. Peripheral and central fat changes in subjects randomized to abacavir-lamivudine or tenofovir-emtricitabine with atazanavir-ritonavir or efavirenz: ACTG Study A5224s. Clin Infect Dis. 2011;53:185–96. doi: 10.1093/cid/cir324. [DOI] [PMC free article] [PubMed] [Google Scholar]
- 30.Rasmussen TA, Jensen D, Tolstrup M, et al. Comparison of bone and renal effects in HIV-infected adults switching to abacavir or tenofovir based therapy in a randomized trial. PLoS ONE. 2012;7 doi: 10.1371/journal.pone.0032445. e32445. [DOI] [PMC free article] [PubMed] [Google Scholar]
- 31.Kiser JJ, Aquilante CL, Anderson PL, King TM, Carten ML, Fletcher CV. Clinical and genetic determinants of intracellular tenofovir diphosphate concentrations in HIV-infected patients. J Acquir Immune Defic Syndr. 2008;47:298–303. doi: 10.1097/qai.0b013e31815e7478. [DOI] [PubMed] [Google Scholar]
- 32.Kiser JJ, Carten ML, Aquilante CL, et al. The effect of lopinavir/ritonavir on the renal clearance of tenofovir in HIV-infected patients. Clin Pharmacol Ther. 2008;83:265–72. doi: 10.1038/sj.clpt.6100269. [DOI] [PubMed] [Google Scholar]
- 33.Ray AS, Cihlar T, Robinson KL, et al. Mechanism of active renal tubular efflux of tenofovir. Antimicrob Agents Chemother. 2006;50:3297–304. doi: 10.1128/AAC.00251-06. [DOI] [PMC free article] [PubMed] [Google Scholar]
- 34.Brewster UC, Perazella MA. Acute interstitial nephritis associated with atazanavir, a new protease inhibitor. Am J Kidney Dis. 2004;44:e81–4 [PubMed] [Google Scholar]
- 35.Schmid S, Opravil M, Moddel M, et al. Acute interstitial nephritis of HIV-positive patients under atazanavir and tenofovir therapy in a retrospective analysis of kidney biopsies. Virchows Arch. 2007;450:665–70. doi: 10.1007/s00428-007-0418-3. [DOI] [PubMed] [Google Scholar]
- 36.Lepist EI, Murray BP, Tong L, Roy A, Bannister R, Ray AS. Interscience Conference on Antimicrobial Agents and Chemotherapy. Chicago, IL: 2011. Effect of cobicistat and ritonavir on proximal renal tubular cell uptake and efflux transporters. [Google Scholar]
- 37.Kalayjian RC, Franceschini N, Gupta SK, et al. Suppression of HIV-1 replication by antiretroviral therapy improves renal function in persons with low CD4 cell counts and chronic kidney disease. AIDS. 2008;22:481–7. doi: 10.1097/QAD.0b013e3282f4706d. [DOI] [PMC free article] [PubMed] [Google Scholar]
- 38.Gagneux-Brunon A, Mariat C, Delanaye P. Cystatin C in HIV-infected patients: promising but not yet ready for prime time. Nephrol Dial Transplant. 2012;27:1305–13. doi: 10.1093/ndt/gfs001. [DOI] [PubMed] [Google Scholar]
- 39.Inker LA, Eckfeldt J, Levey AS, et al. Expressing the CKD-EPI (Chronic Kidney Disease Epidemiology Collaboration) cystatin C equations for estimating GFR with standardized serum cystatin C values. Am J Kidney Dis. 2011;58:682–4. doi: 10.1053/j.ajkd.2011.05.019. [DOI] [PMC free article] [PubMed] [Google Scholar]
Associated Data
This section collects any data citations, data availability statements, or supplementary materials included in this article.