

ABSTRACT
DNA from phylogenetically diverse microbes is routinely recovered from healthy human lungs and used to define the lung microbiome. The proportion of this DNA originating from microbes adapted to the lungs, as opposed to microbes dispersing to the lungs from other body sites and the atmosphere, is not known. We use a neutral model of community ecology to distinguish members of the lung microbiome whose presence is consistent with dispersal from other body sites and those that deviate from the model, suggesting a competitive advantage to these microbes in the lungs. We find that the composition of the healthy lung microbiome is consistent with predictions of the neutral model, reflecting the overriding role of dispersal of microbes from the oral cavity in shaping the microbial community in healthy lungs. In contrast, the microbiome of diseased lungs was readily distinguished as being under active selection. We also assessed the viability of microbes from lung samples by cultivation with a variety of media and incubation conditions. Bacteria recovered by cultivation from healthy lungs represented species that comprised 61% of the 16S rRNA-encoding gene sequences derived from bronchoalveolar lavage samples.
Importance Neutral distribution of microbes is a distinguishing feature of the microbiome in healthy lungs, wherein constant dispersal of bacteria from the oral cavity overrides differential growth of bacteria. No bacterial species consistently deviated from the model predictions in healthy lungs, although representatives of many of the dispersed species were readily cultivated. In contrast, bacterial populations in diseased lungs were identified as being under active selection. Quantification of the relative importance of selection and neutral processes such as dispersal in shaping the healthy lung microbiome is a first step toward understanding its impacts on host health.
Importance
Neutral distribution of microbes is a distinguishing feature of the microbiome in healthy lungs, wherein constant dispersal of bacteria from the oral cavity overrides differential growth of bacteria. No bacterial species consistently deviated from the model predictions in healthy lungs, although representatives of many of the dispersed species were readily cultivated. In contrast, bacterial populations in diseased lungs were identified as being under active selection. Quantification of the relative importance of selection and neutral processes such as dispersal in shaping the healthy lung microbiome is a first step toward understanding its impacts on host health.
INTRODUCTION
The lungs are intimately connected with the microbially rich oral and nasal cavities (Fig. 1A). Movement of microbes between these sites and the lungs occurs regularly via breathing and microaspiration (1). The quantity of microbial DNA recovered from healthy lungs is three orders of magnitude less than that from the oral cavity (2–4), suggesting that the bacterial biomass in healthy lungs is relatively low (3, 5). The continuous transport of microbes, coupled with the low number of microbes observed in healthy lungs, raises a key question: does the microbial DNA recovered from the lungs represent dispersed microbes or organisms adapted for growth in this habitat? In this study, we use the neutral model of community ecology to gauge the relative contributions of dispersal and selection in the lung microbiome.
FIG 1 .

(A) Anatomical connections between the lungs, stomach, and oral and nasal cavities permit movement of microbes between these sites. (B) Implementation of a neutral model for analysis of microbial community structure. The solid black line represents the best-fit neutral model generated using a probability distribution. Dashed lines represent 95% confidence intervals around this best-fit neutral model. Species within the confidence intervals (gray points) are likely present in the lungs because of neutral processes (i.e., dispersal from the source community and ecological drift within the lungs). Species deviating from the neutral model (green and red points) either are candidates for selection in the lungs or differ in their ability to disperse compared to other microbes in the source community.
If selection is responsible for the composition of a microbiome, resources provided by the local environment (the lungs in this study) dictate which species persist and reproduce. Each of the species present would occupy and maintain a niche in the host. The environmental dimensions of each niche are defined first by physicochemical conditions of the local environment (e.g., pH, temperature, and O2 [fundamental niche]) and then by interspecies as well as species-environment interactions (e.g., competition and cooperation [realized niche]) (6). Ecological communities can therefore be considered to comprise multiple species occupying multiple niches. In ecological theory, this is referred to as the “niche-assembly perspective” (7–9).
An alternate viewpoint is the “dispersal-assembly perspective,” which considers ecological communities as dynamic assemblages of species whose “presence, absence, and relative abundance in the local environment are governed by random dispersal, speciation, extinction, and stochastic birth and death events” (10). The neutral biodiversity theory is a formal embodiment of this perspective—with “neutral” referring to the outcome of processes. The central postulate of the neutral biodiversity theory as applied to microbial communities is that all microbes are equally fit competitors for the local environment. In other words, there is an equal opportunity for all microbes to (i) disperse from the surrounding environment, (ii) grow in the local environment, and (iii) be lost or removed from the local environment. The processes of stochastic birth and loss of microbes in the local environment are referred to as “ecological drift.” Therefore, processes with unbiased or neutral outcomes shape the presence and relative abundance of microbes in the local environment.
Processes with both selective and neutral outcomes are typically present and invariably influence the composition of microbial communities in diverse habitats, including marine sediments, freshwater, hot springs, plant and animal hosts, wastewater treatment plants, and bioreactors (11–17). Delineation of the contributions of selection and neutral processes provides a broad insight into mechanisms generating and maintaining community composition. This goal can be accomplished by using a mathematical implementation of the neutral community model to test the central postulate of the neutral biodiversity theory stated above (18–21). Species consistent with the model predictions are likely detected in the local environment due to dispersal from the surrounding environment, ecological drift, or both (21–23). Species deviating from the model are either the strongest candidates undergoing selection (both positive and negative) by the local environment or have different dispersibility relative to other microbes in the surrounding environment.
Accordingly, here we consider several body sites, including the tonsils and throat, that are potential sources for the lung microbiome and use a neutral community model (adapted from Sloan et al. [18]) to ask if neutral processes from these sites are sufficient to explain the observed composition of the lung microbiome. The relative abundance of an operational taxonomic unit (OTU) in the source community is used to calculate the probability of detecting that OTU in the lungs because of dispersal and ecological drift. Very simply, high abundance of a species in the source leads to a high probability of dispersal, and low abundance in the source leads to a low probability of dispersal (Fig. 1B). With this approach, we show that the composition of the healthy lung microbiome is entirely consistent with neutral distribution of microbes from one or more sites in the oral cavity. No species were identified that consistently deviated from model predictions, suggesting that constant microbial dispersal overrides selection in shaping the composition of the healthy lung microbiome. We suggest that lack of selection in a healthy lung is biologically relevant since microbiomes in diseased lungs are associated strongly with increased selection of specific microbes.
RESULTS
Composition of the healthy lung microbiome is consistent with neutral distribution of microbes from the oral cavity.
We determined the identity of microbes in bronchoalveolar lavage (BAL) specimens from 62 healthy volunteers (24) through molecular surveys of 16S rRNA-encoding genes. While traditional nonparametric analyses suggest that there is little difference between the lung and oral wash communities (Bray-Curtis analysis of similarity [ANOSIM]; R = 0.11, p = 0.02), they do not address the question “Can we distinguish between species that are detected in the lungs because of neutral processes and those that are adapted for growth in the lungs?” To answer this question, we applied the neutral model of community ecology to the lung microbiome. The neutral model assumes that the composition of communities can be explained by dispersal of species from the surroundings and ecological drift within that community (19, 22). We considered different body sites as potential sources for the lung microbiome. Each body site was considered separately as a potential source community. First, with a goodness-of-fit test (R2), we determined how well the neutral model explained the overall composition of the lung microbiome with each of these source body sites. An R2 value closer to 1 implies that the composition of the lung microbiome is consistent with neutral processes of dispersal and ecological drift. Since the neutral model employs a nonlinear mathematical function, in cases when it does not adequately describe the community composition, R2 can be ≤0 (25). For the same reason, the value of R2 cannot be interpreted as the percentage of variance in the observed detection frequencies explained by the neutral model. Next, OTUs from the lungs were identified that were consistent with predictions of the neutral model based upon their abundance in the source body site. These OTUs are termed “neutrally distributed” (i.e., consistent with dispersal and ecological drift). Finally, OTUs that deviate from the model predictions are identified as the strongest candidates undergoing selection in the lungs.
The neutral model can be applied only to OTUs that are shared between a source body site and the lungs. A majority (99.3%) of sequences recovered from all lung samples fall into OTUs that are shared with other body sites. The remaining 0.7% of sequences unique to the lung are detected sporadically (i.e., in less than 15% of the samples and at very low relative abundance in each sample). Since the lungs are a dynamic environment in constant interaction with other body sites, we think it likely that sequences unique to the lung are a result of sampling stochasticity rather than constituting a core healthy lung microbiome.
The composition of the healthy lung microbiome fit a neutral model when several sites in the oral cavity were individually considered source communities. The goodness-of-fit (R2) values were 0.86 with oral wash, 0.77 with tonsils, 0.75 with throat, and 0.73 with saliva as source communities (where ≤0 is no fit and 1 is perfect fit) (Fig. 2A). Eighty-five to 95% of the sequences from each of these sites fall within neutrally distributed OTUs in the lungs (Fig. 3A). Dental plaque and gingiva were the only sites in the mouth that fit the neutral model poorly (R2 = −0.06 and 0.18, respectively) (Fig. 2B). This finding is not unexpected because microbes in these sites are predominantly in adherent biofilms (26), thus limiting their dispersal to the lungs. Of particular note is the dental plaque, because 36% of the sequences in plaque fall within OTUs that are underrepresented in the lungs.
FIG 2 .
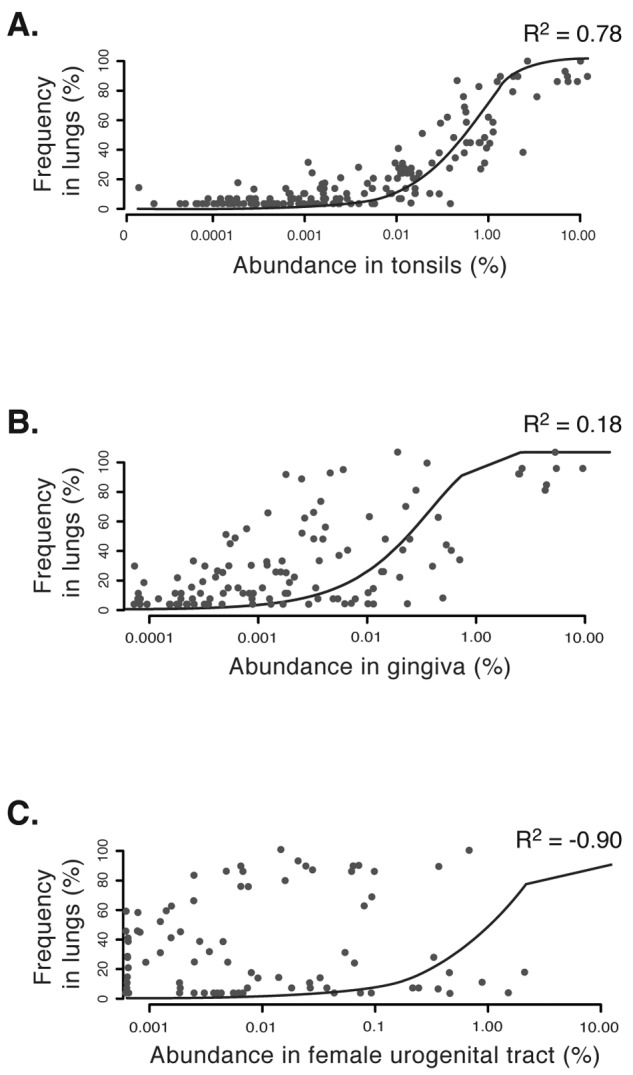
Results of neutral model testing with (A) tonsils, (B) gingiva, and (C) female urogenital tract as potential source communities for microbes in the lungs. The coefficient of determination (R2) is the goodness of fit of the neutral model. It ranges from ≤0 (no fit) to 1 (perfect fit). Note the correspondence between decreasing values of R2 from panels A to C and the proximity of points to the line denoting the best-fitting neutral model.
FIG 3 .

The neutral model applied to each body site as a potential source of microbes for the lung microbiome. Shown are the abundance of neutrally distributed, overrepresented, and underrepresented OTUs in lungs from each body site and the associated goodness of fit of the neutral model (R2).
When the anterior nares was considered a source community, the neutral model failed to describe the composition of the lung microbiome (R2 = −0.32), and most sequences from this site fall within OTUs that are underrepresented in the lungs (Fig. 3A). This result most likely reflects dispersal limitation of bacteria from this habitat. Bacteria from the anterior nares can be trapped in the flowing mucus blanket covering the nasal mucosa deeper in the nose (27) and therefore never reach the lungs. Indeed, 36% of OTUs in the anterior nares are never detected in lung surveys.
Microbes from the oral cavity are swallowed regularly into the upper gastrointestinal (GI) tract (Fig. 1A). Therefore, samples obtained from the upper GI tract should represent microbes that are readily dispersed from the oral cavity. We tested this with the neutral model by considering the oral cavity as a source of microbes for the upper GI tract. Indeed, the model fit was 0.54 and 75% of the sequences from the oral cavity fell within neutrally distributed OTUs in the upper GI tract. Thus, if the oral cavity is a source of microbes for both the lungs and upper GI tract, the upper GI tract should appear as a potential source of microbes for the lungs by the neutral model. Indeed, the neutral model performed modestly well with the upper gastrointestinal tract as a “source” of the lung microbiome (R2 = 0.42). Sixty-nine percent of the sequences from this site fall within neutrally distributed OTUs in the lungs (Fig. 3A). Finally, the neutral model failed when other body sites, such as the skin, colon, and urogenital tract, were considered sources for the lungs (Fig. 2C and 3A). Most sequences from these sites are underrepresented in the lungs (Fig. 3A).
Next, we determined if any OTUs consistently deviated from predictions of the neutral model (i.e., they were always overrepresented in the lungs irrespective of the source) (green symbols in Fig. 1B). These would be the strongest candidates for microbes that are adapted for growth in the lungs. While no OTUs deviated consistently from predictions of the neutral model, some OTUs deviated from the neutral model more often than others and were also present at a relative abundance of >0.5% in the lungs (Fig. 4). Conceptually, we expect that the oral wash and saliva are composed of easily displaceable microbes compared to the buccal mucosa or tonsils and therefore are more representative of microbes reaching the lungs. However, we did not find any OTUs that deviated positively from the neutral model when both the oral wash and saliva were considered source sites (Fig. 4).
FIG 4 .
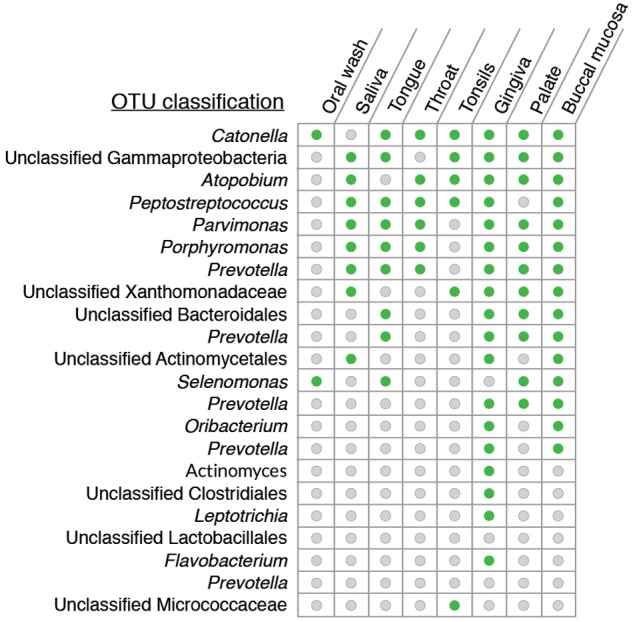
List of OTUs that most commonly deviated from the neutral model and had a relative abundance of >0.5% in the lungs. Green circles indicate the sites from which the OTU appeared as being overrepresented in the lungs, and gray circles are the sites from which the OTU was neutrally distributed.
We also applied the neutral model to microbial communities in diseased lungs. For this, we used upper (source site) and lower (target site) respiratory tract microbial data from previously published studies on cystic fibrosis and idiopathic interstitial pneumonia (28, 29). In both cases, the neutral model failed to describe the composition of the lung microbiome (Table 1).
TABLE 1 .
Results of neutral model applied to lungs of diseased patients
| Patient group (n) | No. of sequences in lung survey | % of lung sequences analyzed | R2 |
|---|---|---|---|
| Cystic fibrosis (9)a | 52,050 (54 OTUs) | 93.4 (29 OTUs) | −0.86 |
| Idiopathic interstitial pneumonia (4)b | 1,590 (95 OTUs) | 89.9 (48 OTUs) | −1.61 |
Source site, patients’ throats.
Source site, patients’ oral washes.
Sixty-one percent of sequences in BAL samples cluster into OTUs with readily culturable members.
Application of the neutral model suggests that the microbial DNA recovered from BAL samples in healthy individuals is largely from microbes dispersing from the oral cavity. The lungs have multiple mechanisms in place to kill bacteria (30). Therefore, it is possible that these dispersed microbes are killed at the same rate as they are introduced into the lungs. This would result in an impression of “neutral distribution,” when in fact the host is strongly selecting against all microbes and killing them. To address this possibility, we assessed the viability of microbes in BAL samples by cultivation with a variety of media (Table 2) and incubation conditions (21% O2, 2% O2, and 0% O2). Phylogenetic identity of the cultivars was assessed by plate wash PCR of the 16S rRNA-encoding gene (31). The resulting sequences were analyzed along with culture-independent 16S rRNA-encoding gene sequence surveys of BAL samples.
TABLE 2 .
Description of media used in this studya
| Medium | Targeted organism(s) |
|---|---|
| Tryptic soy agar | Many heterotrophic bacteria |
| Mannitol salt agar | Staphylococcus sp. |
| CDC kanamycin-vancomycin laked blood agar | Pigmented Prevotella spp., some Porphyromonas spp. |
| Mitis salivarius agar | Streptococcus spp. |
| Chocolate bacitracin agar | Haemophilus spp., Campylobacter spp., and other Gram-negative capnophiles |
| Enterococcosal agar | Enterococcus spp. |
Described in reference 47.
A total of 514 OTUs (defined at 97% sequence similarity) were observed in the culture-independent surveys of BAL samples, and 100 OTUs were identified in culture-dependent surveys. We applied two criteria for comparing culture-independent and culture-dependent surveys. First, we removed global singleton sequences from both the culture-independent and culture-dependent surveys. Next, each OTU from the culture-independent survey was scored as having a “cultured representative” if the same OTU was observed and contained at least 10 sequences in the plate wash PCR samples. Twenty-seven OTUs fulfilled these criteria, and these OTUs included 61% of the sequences from culture-independent surveys. Therefore, viable and readily culturable bacteria represent OTUs that comprise a majority of the sequences identified in lavage samples. Delineating cultivars by the incubation oxygen conditions, 19 of the 27 OTUs were represented by cultivars from oxic or microoxic conditions and the remaining 8 OTUs by cultivars unique to anoxic conditions. The 19 “oxic” and 8 “anoxic” OTUs, respectively, constitute 50% and 11% of the sequences identified in culture-independent surveys. So even after ~2 years of storage at −80°C, cultivars were readily obtained that clustered in OTUs encompassing 61% of the sequences in culture-independent surveys of BAL specimens. Many of the prominent OTUs from surveys are represented by cultivars (Fig. 5), although cultivation did not capture representatives from some OTUs classified as Enterobacteriaceae, Prevotella sp., and Porphyromonas sp.
FIG 5 .
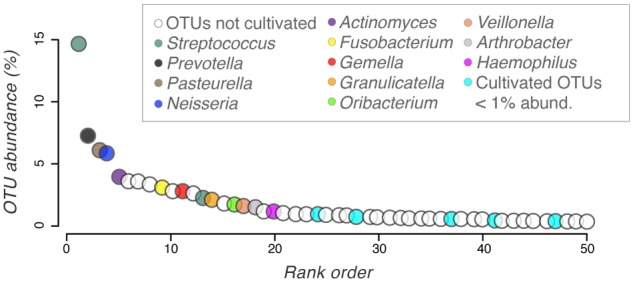
Cultivar taxonomy mapped onto the rank abundance curve of 16S rRNA-encoding gene surveys of BAL samples. Colored OTUs represent those scored as having a “cultured representative.” Open circles represent OTUs that were not cultivated (a list of uncultivated OTUs is provided in Table S1 in the supplemental material).
DISCUSSION
Given the sparsity of microbes in healthy lungs, the composition of the lung microbiome is susceptible to being shaped by dispersal of microbes from the oral and nasal cavities. We sought to determine the relative importance of neutral versus selective processes in shaping the healthy lung microbiome by using a neutral model of community ecology. The model was used as a null hypothesis (i) to determine if dispersal from other body sites, such as tonsils and throat, and ecological drift within the lungs are sufficient to explain the observed composition of the lung microbiome and (ii) to identify bacterial species that deviated from the model expectations. The composition of the healthy lung microbiome was consistent with neutral model predictions when several sites in the oral cavity were considered source communities. No bacterial species in the lungs were identified that consistently deviated from the model expectations. The neutral model explicitly incorporates ecological drift in addition to dispersal as a neutral process. However, because of the recurrent microbial flux between the lungs and oral cavity, we think that in this habitat, dispersal is the more relevant neutral process. Consequently, we interpret our results as indicating that even if there is selective growth in the lungs, its impact on community structure is overridden by the magnitude and frequency with which microbes are dispersed from the oral cavity. While application of the neutral model to individual volunteers for which temporal samples of the upper and lower respiratory tract were collected would be a more direct assessment of the role of dispersal versus selection, it is difficult to justify such an intensive sampling regimen.
It is tempting to suggest that departure from a neutral distribution toward increased selection in the lungs is associated with diseased states. We tested this prediction by applying our implementation of the neutral model to diseased lungs using previously published data (28, 29). The neutral model failed to describe the observed lung microbial community composition, indicating active selection in these lungs (Table 1). We speculate that the extent of departure from neutrality will correlate with disease severity: i.e., a neutral distribution would prevail over selection in initial stages and vice versa as disease progresses. Consequently, we propose that maintaining a neutral distribution of microbes in lungs may be critical for host health. To accomplish this, further research needs to be focused on understanding the dynamics of this neutral distribution (e.g., the kinetics of entry of microbes into the lungs).
An alternate interpretation of our findings with the neutral model applied to healthy lungs is that the environmental conditions in the oral cavity and lower respiratory tract are similar enough that species identified as “neutrally distributed” in the lungs might experience the same levels of selection in both body sites. The lower respiratory tract is indeed more similar to the oral cavity than most other body sites, but it is distinct in several parameters known to influence microbial growth, including oxygen tension, pH, blood perfusion, temperature, epithelial cell structure, composition of inflammatory cells, and mucus layer thickness (32–35). Furthermore, the distal surface of the lungs is bathed in surfactants, which are selectively bacteriostatic (36). Therefore, we do not expect that the species from the oral cavity identified as being neutrally distributed in the lungs result from similar selective regimens in these two habitats.
Studies of the lung microbiome typically require invasive sampling by introducing a bronchoscope into the lungs through the upper respiratory tract. During this procedure, the bronchoscope comes into contact with the microbiome of the mouth and upper respiratory tract, and there may be aspiration of upper respiratory secretions and consequently carryover of microbes into the lungs. This potential problem has been examined in several commentaries on the healthy lung microbiome (37, 38). Charlson et al. (39) used a novel two-scope method to control for this procedural contamination and demonstrated that, even after accounting for this scope-mediated carryover, there was amplifiable microbial DNA in the lung. In an independent study, Dickson et al. (40) reported that the collection of microbes in brochoalveolar lavage (BAL) specimens was not influenced by the route of bronchoscope insertion (i.e., either through the mouth or nose), even though these two sites harbor very distinct microbial communities. This finding indicates that the BAL fluid microbiota is not exclusively a result of carryover of microbes during passage of the bronchoscope. Additionally, it provides validation that this collection of microbes represents the lower airway microbiome. In this study, we accounted for equipment- and reagent-derived contamination and refer to the resulting collection of 16S rRNA-encoding gene sequences from BAL fluid surveys as the healthy lung microbiome.
After using the neutral model to suggest that dispersal overrides selection in influencing the composition of the healthy lung microbiome, we assessed the viability of these dispersed microbes using standard cultivation techniques from BAL samples. We found that viable and readily culturable bacteria grouped into OTUs that contained 61% of the sequences identified in lavage samples. Our estimate of the viable population could be conservative because of (i) the limited number of culture conditions used, (ii) loss of viability during storage, and (iii) the fact that microbes can exist in a viable but nonculturable state and still play important roles in vivo (e.g., Pneumocystis jirovecii in lungs) (41, 42). While the potential impact of the lung microbiome on the host is yet to be delineated, we show that a large proportion of the microbial DNA derived from BAL samples can originate from viable microbes.
Conclusions.
This study addresses two key issues regarding the healthy lung microbiome. First, we addressed the relative contribution of neutral and selective processes in shaping the lung microbiome. Using the neutral model, our data suggest that dispersal of microbes from the oral cavity is the primary driver of the composition of the healthy lung microbiome. No species were identified that consistently deviated from the neutral model predictions, suggesting that constant dispersal overrides selection in this habitat. Second, we determined the viability of bacteria in BAL samples using standard cultivation techniques. Viable and readily culturable bacteria represent OTUs that make up 61% of the sequences recovered from lavage samples. Finally, our implementation of the neutral model provides a general basis to discern the relative importance of dispersal and selection in diverse microbiomes, especially those where there is potential for continuous dispersal of microbes from the surrounding environment.
MATERIALS AND METHODS
To characterize the lung microbiome, we used previously generated molecular surveys of the 16S rRNA-encoding gene sequences (v3-5 hypervariable region) from bronchoalveolar lavages (BAL) performed on 62 healthy subjects (24). We also used 16S sequences generated from oral wash samples from the same subjects (24). In order to apply the neutral model to other body sites, such as tonsils and tongue, as sources for the lung microbiome, we used sequences from phase I of the Human Microbiome Project (43, 44). This included several sites in the oral cavity, anterior nares, skin, gastroinstestinal (GI) tract, and the female urogenital tract from approximately 242 individuals. These sequences had already been “denoised” as described by Ding and Schloss (44). Metadata associated with these sequences were obtained from dbGAP (accession no. phs000228.v3.p1).
Collection of samples from the upper GI tract.
Since the oral cavity is connected to both the lungs and the upper GI tract, microbes from the oral cavity can move to both these sites (Fig. 1A). Therefore, we investigated if there was any relationship between the upper GI tract and the lung microbiomes. Upper GI tract samples were collected from the same volunteers at University of Michigan whose lungs were sampled by Morris et al. (24). The GI tract samples were obtained concomitantly with BAL fluid specimens from these subjects. Studies and consent procedures were performed in accordance with the Declaration of Helsinki at the VA Ann Arbor Healthcare System and were approved by its Institutional Review Boards (FWA 00000348). All subjects understood the purpose of the study and gave written consent before any research procedures. All subjects underwent a complete history and physical examination by a pulmonologist, complete pulmonary function testing (including spirometry, plethysmographic lung volumes, and diffusing capacity), posterior, anterior, and lateral chest radiographs, prospective collection of medication history, and complete blood count with differential, coagulation studies, and a chemistry panel.
Sample collection was performed under moderate conscious sedation (intravenous diphenhydramine, midazolam, and fentanyl) by a single bronchoscopist. Subjects received topical anesthesia (4% lidocaine by nebulizer and atomizer spray to the posterior oropharynx and then 4% lidocaine in four 1-ml aliquots instilled directly onto the vocal cords). Subglottic lidocaine and suctioning were minimized to avoid contamination of samples. The patient’s head was flexed, and an 18G gastric tube as introduced via the mouth, observed to pass posterior to the larynx into the esophagus, and advanced to 35 cm from the mouth. Correct placement of the gastric tube was confirmed by auscultation of air introduced using a Toomey syringe. Fifty milliliters of normal saline was instilled and immediately withdrawn using manual suction. The gastric return was collected in sterile specimen cups, which were placed on ice until transported from the bronchoscopy suite to the laboratory, where they were immediately processed.
DNA extraction from upper GI tract samples.
Samples were transferred to the laboratory on ice, and 1 ml was transferred to a dry bead tube (Mo Bio Ultra clean fecal DNA Isolation kit; catalog no. 12811-100-DBT). The tubes were then centrifuged for 2 min at ~16,000 × g, and the supernatant fraction was removed. This process was repeated until 10 ml of gastric contents had been transferred to the dry bead tube. Samples were then stored at −80°C until DNA isolation. Seven hundred-fifty microliters of PowerSoil DNA kit bead solution (Mo Bio catalog no. 12855-50-BS) and 60 µl of PowerSoil DNA kit solution C1 were added to each dry bead tube (containing pellet from 10 ml of gastric contents). Samples were bead beaten for 2 min on the “homogenize” setting of a Mini-BeadBeater-8 (BioSpec Products) and centrifuged for 30 s at 10,000 × g. We then continued with the PowerSoil DNA isolation kit protocol (Mo Bio catalog no. 12888) starting with step 7 (transfer of supernatant to a clean 2-ml collection tube), or samples were transferred into a 1-ml collection plate to continue with the PowerSoil-htp 96-well soil DNA isolation kit protocol (Mo Bio catalog no. 12955) starting with step 10 (addition of 250 µl solution C2 to each well) on an epMotion 5075 (Eppendorf) or Biomek FXP (Beckman Coulter). Libraries of 16S rRNA gene amplicons (v3-5 hypervariable region) were constructed based on the HMP Consortium protocol (http://www.hmpdacc.org/doc/16S_Sequencing_SOP_4.2.2.pdf) with the modifications described below. Each 20-µl PCR mixture contained 2-µl Accuprime PCR buffer II (Life Technologies), 0.15-µl Accuprime high-fidelity Taq DNA polymerase (Life Technologies), 0.2 µM primer A (CCATCTCATCCCTGCGTGTCTCCGACTCAGXXXXXCCGTCAATTCMTTTRAGT), 0.2 µM primer B (CCTATCCCCTGTGTGCCTTGGCAGTCTCAGCCTACGGGAGGCAGCAG), and 1 µl DNA. The boldface portions of primer A and primer B are 926R and 357F, respectively. The region of primer A represented by XXXXX is the 5- to 10-nucleotide bar code sequence. The remainders of primer A and primer B are the A adapter sequence and the B adapter sequence, respectively, required for emulsion-based clonal amplification PCR (emPCR) and 454 sequencing. PCR started with 2 min at 95°C followed by 20 cycles of touchdown PCR with 20 s at 95°C and 30 s at the annealing temperature, which was 60°C in the first cycle and dropped 0.5°C with each cycle, with 5 min at 72°C and then 20 cycles of standard PCR with 20 s at 95°C, 30 s at 50°C, and 5 min at 72°C. PCR products were purified with AMPure XP (Agencourt) according to the manufacturer’s instructions, except 0.6× the amplicon volume (10.8 µl) of beads was used rather than 1.2× in order to remove more of the small products. The purified PCR products were quantified with a Quant-iT PicoGreen double-stranded DNA (dsDNA) kit (Invitrogen) according to the manufacturer’s instructions and combined into a pool with equal amounts of each amplicon. To accommodate all of the samples, three pools were made. Each pool was then purified with AMPure XP (Agencourt) according to the manufacturer’s instructions, except the volume of beads was 0.6× the pool volume. The pools were quantified with a Library Quantification kit for Roche 454 GS Titanium (KAPA). Large-volume Lib-L emPCRs (Roche 454) were performed, and 454 sequencing was done using the GS FLX Titanium platform (Roche) according to the manufacturer’s instructions.
Sequence curation.
All sequences were curated using mothur v1.31.2 (45). The low biomass associated with lung samples raised the possibility of reagent-derived and equipment-derived DNA contamination of samples. Three kinds of controls were collected and sequenced to address these possibilities: (i) sterile saline in a sample collection cup obtained at the time of specimen collection, (ii) sterile saline washed through the bronchoscope just prior to bronchoscopy as a control for DNA in the scope, and (iii) DNA from the reagents used for extraction (24). The neutral model was used to identify sequences that were likely present in the lung samples due to contamination from these controls (see “Neutral model analyses” below). These putative contaminant sequences were removed from 16S libraries derived from lung samples. The resulting data set was subsampled to 500 sequences per sample and clustered into OTUs at 97% sequence similarity. At this subsampling depth, the Good’s coverage for all samples was greater than 95%, suggesting that the subsample size was reasonable.
Neutral model analyses.
To determine the relative importance of neutral processes (i.e., dispersal and ecological drift) and selection in the healthy lung microbiome, we implemented our version of the neutral model, using custom scripts in the R language. Several body sites, such as the mouth and tonsils, were considered sources for the lung microbiome. The mathematical premise of our neutral model is as follows:
Simplistically, high abundance in the source site would result in a greater probability of detection in the lungs because of continued dispersal and the converse with low abundance. In this implementation of the neutral model, the source community was created by pooling surveys of the same body site from multiple individuals (e.g., the throat microbial community from multiple individuals). The relative abundance of a given OTU in the source community was calculated as no. of sequences with OTU in source community/total no. of sequences in source community. Similarly, the empirically observed frequency of detection for each OTU in the lungs was calculated as no. of individuals in whose lungs OTU was detected/total no. of individuals whose lungs were surveyed.
Next, for each OTU shared between the lung and the source community, a beta probability distribution was used to calculate the expected frequency of detection in the lungs if it was present via dispersal and ecological drift (18). Briefly, the lower limit of this probability density function is the relative abundance of the least abundant OTU in the source community, while the upper limit is 1. The shape parameters for the probability distribution were determined by an overall fitting parameter (Ntm) and the relative abundance of the OTU in the source community. The fitting parameter reflects the dispersal of microbes from the source community to the lungs. The value of this parameter was optimized using a least-squares approach such that the sum of squares of residuals is minimized:
Finally, the variability around this expected detection frequency was calculated using 95% binomial proportion confidence intervals (Wilson method [46]) with the HMisc package in R. Calculating this for all OTUs yields the best-fit neutral model curve and the 95% confidence intervals shown in Fig. 1B. The goodness of fit of this curve was assessed using the coefficient of determination (R2). OTUs that fall within the confidence intervals imposed around the best-fit neutral model curve are consistent with random dispersal and ecological drift—i.e., neutrally distributed (gray points in Fig. 1B). OTUs that fall above the upper bound of the confidence interval are disproportionately overrepresented in the lungs compared to those predicted by their abundance in the source (green points in Fig. 1B). These OTUs are the strongest candidates for either having a competitive advantage in the lungs or increased dispersal ability relative to other microbes from the source site. Similarly, OTUs falling below the lower bound of the confidence interval are disproportionately underrepresented in the lungs compared to those predicted by their abundance in the source. This suggests either a disadvantage to these OTUs in the lungs or a dispersal limitation from the source site (red points in Fig. 1B). Finally, the cumulative relative abundances of these three categories of OTUs were used as a metric to evaluate the contributions of random dispersal and ecological drift (Σ abundance of gray OTUs in source community) and selection (Σ abundance of green and red OTUs in source community) from that source community in shaping the composition of the lung microbiome.
In order to identify putative contaminant sequences in lung samples from equipment and from reagent-derived DNA, the neutral model was applied using the sequences recovered from the three types of controls pooled to create the source community. This analysis was performed prior to clustering the sequences into OTUs at 97% similarity. Sequences falling within the confidence intervals of the model (neutrally distributed from controls [gray points in Fig. 1B]) and outside the lower bounds of the confidence intervals (enriched in controls [red points in Fig. 1B]) were considered to be contaminating sequences and were removed from analysis of all BAL samples. Only sequences falling outside the upper bounds of the confidence interval with the controls as the source (selected for in BAL samples [green points in Fig. 1B]) and unique to BAL specimens (not detected in controls) were retained for downstream analyses.
Cultivation of microbes from BAL fluid.
To assess whether the DNA recovered from lavage fluid samples originated from viable microbes, we cultivated microbes from these BAL samples. Three-milliliter aliquots of BAL fluid, stored frozen at −80°C with 5% dimethyl sulfoxide as a cryoprotectant, were used as inocula for cultivation. The samples were thawed at 4°C, vortexed for 30 s, and then centrifuged at 7,068 × g for 10 min. The supernatant fraction was discarded, and the cell pellet was resuspended in 240 µl Hanks’ balanced salt solution (Gibco Life Technologies), followed by plating of 10 µl directly on six different media: tryptic soy agar, mannitol salt agar, CDC kanamycin-vancomycin laked blood agar, mitis salivarius agar, chocolate bacitracin agar, and enterococcosal agar (BD Difco). These media were chosen based upon the taxonomic classification of 16S sequences recovered directly from BAL samples. Since the lungs are heterogeneous with respect to oxygen concentration, plates were incubated at 37°C for 7 days in oxic (5% CO2, 21% O2, balance N2), hypoxic (5% CO2, 2% O2, balance N2), or anoxic (5% CO2, 5% H2, balance N2) atmospheres. BAL samples from 38 individuals were used for cultivation. So that the identity of cultivars could be compared with the culture-independent surveys from BAL samples, we performed plate wash PCR (31). After 7 days of incubation, the surface of plates was flooded with 1 to 2 ml of sterile tryptic soy broth (TSB), and a sterile spreader was used to suspend as much colony material as possible. DNA was extracted from 500 µl of this solution using the Mo Bio PowerSoil DNA extraction kit. Amplification of the v3-5 region of the 16S rRNA-encoding gene was accomplished using the Broad HMP protocol (http://hmpdacc.org/doc/16S_Sequencing_SOP_4.2.2.pdf). The PCR products were sequenced on the Roche 454 GS Junior titanium platform according to the manufacturer’s instructions.
Nucleotide sequence accession number.
The 16S rRNA-encoding gene sequences from the upper GI tract samples have been deposited in GenBank (BioProject ID no. PRJNA263948).
SUPPLEMENTAL MATERIAL
Taxonomic characterization of all uncultivated OTUs.
ACKNOWLEDGMENTS
A.V. is supported by a T32 HL007749 fellowship (Multidisciplinary Training Program in Lung Disease). This work was supported by National Institutes of Health grants R01 0099549 to T.M.S. and R01 HL114447 to G.B.H. The Lung HIV Microbiome Project (LHMP) consortium, funded by U01 HL098961 (J.M.B., V.B.Y., and J.L.C.) also provided support for this project.
We acknowledge William T. Sloan (University of Glasgow) for making their version of the neutral model available and valuable discussions regarding its adaptation for our purposes. We also thank Annette Marie Ostling (University of Michigan, Ann Arbor) for thoughtful inputs regarding the neutral biodiversity theory and neutral model. We acknowledge Brendan Bohannan and Adam Burns (University of Oregon) for providing valuable feedback on the manuscript and proposing the goodness-of-fit measure. Pradeep Singh (University of Washington) provided sequences from cystic fibrosis patients and useful discussions regarding the interpretations of our results. Markus Hilty (Insitute of Infectious Diseases, Bern, Switzerland) provided sequences from patients with idiopathic interstitial pneumonia. Finally, we thank Michael Cox (National Heart and Lung Institute, London, United Kingdom) for comments on the manuscript.
Footnotes
Citation Venkataraman A, Bassis CM, Beck JM, Young VB, Curtis JL, Huffnagle GB, Schmidt TM. 2015. Application of a neutral community model to assess structuring of the human lung microbiome. mBio 6(1):e02284-14. doi:10.1128/mBio.02284-14.
REFERENCES
- 1.Huang YJ, Charlson ES, Collman RG, Colombini-Hatch S, Martinez FD, Senior RM. 2013. The role of the lung microbiome in health and disease. A National Heart, Lung, and Blood Institute workshop report. Am J Respir Crit Care Med 187:1382–1387. doi: 10.1164/rccm.201303-0488WS. [DOI] [PMC free article] [PubMed] [Google Scholar]
- 2.Charlson ES, Bittinger K, Haas AR, Fitzgerald AS, Frank I, Yadav A, Bushman FD, Collman RG. 2011. Topographical continuity of bacterial populations in the healthy human respiratory tract. Am J Respir Crit Care Med 184:957–963. doi: 10.1164/rccm.201104-0655OC. [DOI] [PMC free article] [PubMed] [Google Scholar]
- 3.Segal LN, Alekseyenko AV, Clemente JC, Kulkarni R, Wu B, Gao Z, Chen H, Berger KI, Goldring RM, Rom WN, Blaser MJ, Weiden MD. 2013. Enrichment of lung microbiome with supraglottic taxa is associated with increased pulmonary inflammation. Microbiome 1:2049–2619. doi: 10.1186/2049-2618-1-19. [DOI] [PMC free article] [PubMed] [Google Scholar]
- 4.Charlson ES, Diamond JM, Bittinger K, Fitzgerald AS, Yadav A, Haas AR, Bushman FD, Collman RG. 2012. Lung-enriched organisms and aberrant bacterial and fungal respiratory microbiota after lung transplant. Am J Respir Crit Care Med 186:536–545. doi: 10.1164/rccm.201204-0693OC. [DOI] [PMC free article] [PubMed] [Google Scholar]
- 5.Sze MA, Dimitriu PA, Hayashi S, Elliott WM, McDonough JE, Gosselink JV, Cooper J, Sin DD, Mohn WW, Hogg JC. 2012. The lung tissue microbiome in chronic obstructive pulmonary disease. Am J Respir Crit Care Med 185:1073–1080. doi: 10.1164/rccm.201111-2075OC. [DOI] [PMC free article] [PubMed] [Google Scholar]
- 6.Jonathan M, Chase MAL. 2003. Ecological niches: linking classical and contemporary approaches. University of Chicago Press, Chicago, IL. [Google Scholar]
- 7.Hutchinson GE. 1957. Concluding remarks. Cold Spring Harb Symp Quant Biol 22:415–427. doi: 10.1101/SQB.1957.022.01.039. [DOI] [Google Scholar]
- 8.Wennekes PL, Rosindell J, Etienne RS. 2012. The neutral-niche debate: a philosophical perspective. Acta Biotheor 60:257–271. doi: 10.1007/s10441-012-9144-6. [DOI] [PMC free article] [PubMed] [Google Scholar]
- 9.Hutchinson GE. 1959. Homage to Santa Rosalia or why are there so many kind of animals. Am Nat 93:145–159. doi: 10.1086/282070. [DOI] [Google Scholar]
- 10.Hubbell SP. 2001. The unified neutral theory of biodiversity and biogeography, p 29 Princeton University Press, Princeton, NJ. [Google Scholar]
- 11.Hamdan LJ, Coffin RB, Sikaroodi M, Greinert J, Treude T, Gillevet PM. 2013. Ocean currents shape the microbiome of Arctic marine sediments. ISME J 7:685–696. doi: 10.1038/ismej.2012.143. [DOI] [PMC free article] [PubMed] [Google Scholar]
- 12.Wilkins D, van Sebille E, Rintoul SR, Lauro FM, Cavicchioli R. 2013. Advection shapes Southern Ocean microbial assemblages independent of distance and environment effects. Nat Commun 4:2457. doi: 10.1038/ncomms3457. [DOI] [PubMed] [Google Scholar]
- 13.Szekely AJ, Berga M, Langenheder S. 2013. Mechanisms determining the fate of dispersed bacterial communities in new environments. ISME J 7:61–71. doi: 10.1038/ismej.2012.80. [DOI] [PMC free article] [PubMed] [Google Scholar]
- 14.Whitaker RJ, Grogan DW, Taylor JW. 2003. Geographic barriers isolate endemic populations of hyperthermophilic archaea. Science 301:976–978. doi: 10.1126/science.1086909. [DOI] [PubMed] [Google Scholar]
- 15.Lankau EW, Hong PY, Mackie RI. 2012. Ecological drift and local exposures drive enteric bacterial community differences within species of Galapagos iguanas. Mol Ecol 21:1779–1788. doi: 10.1111/j.1365-294X.2012.05502.x. [DOI] [PubMed] [Google Scholar]
- 16.Ofiţeru ID, Lunn M, Curtis TP, Wells GF, Criddle CS, Francis CA, Sloan WT. 2010. Combined niche and neutral effects in a microbial wastewater treatment community. Proc Natl Acad Sci U S A 107:15345–15350. doi: 10.1073/pnas.1000604107. [DOI] [PMC free article] [PubMed] [Google Scholar]
- 17.Zhou J, Liu W, Deng Y, Jiang Y-H, Xue K, He Z, Van Nostard J, Wu L, Yang Y, Wang A. 2013. Stochastic assembly leads to alternative communities with distinct functions in a bioreactor microbial community. mBio 4(2):e00584-12. doi: 10.1128/mBio.00584-12. [DOI] [PMC free article] [PubMed] [Google Scholar]
- 18.Sloan WT, Lunn M, Woodcock S, Head IM, Nee S, Curtis TP. 2006. Quantifying the roles of immigration and chance in shaping prokaryote community structure. Environ Microbiol 8:732–740. doi: 10.1111/j.1462-2920.2005.00956.x. [DOI] [PubMed] [Google Scholar]
- 19.Hubbell SP. 2005. Neutral theory in community ecology and the hypothesis of functional equivalence. Funct Ecol 19:166–172. doi: 10.1111/j.0269-8463.2005.00965.x. [DOI] [Google Scholar]
- 20.Leigh EG., Jr. 2007. Neutral theory: a historical perspective. J Evol Biol 20:2075–2091. doi: 10.1111/j.1420-9101.2007.01410.x. [DOI] [PubMed] [Google Scholar]
- 21.Rosindell J, Hubbell SP, He F, Harmon LJ, Etienne RS. 2012. The case for ecological neutral theory. Trends Ecol Evol 27:203–208. doi: 10.1016/j.tree.2012.01.004. [DOI] [PubMed] [Google Scholar]
- 22.Gilbert B, Laurance WF, Leigh EG Jr, Nascimento HE. 2006. Can neutral theory predict the responses of Amazonian tree communities to forest fragmentation? Am Nat 168:304–317. doi: 10.1086/506969. [DOI] [PubMed] [Google Scholar]
- 23.Adler PB, HilleRisLambers J, Levine JM. 2007. A niche for neutrality. Ecol Lett 10:95–104. doi: 10.1111/j.1461-0248.2006.00996.x. [DOI] [PubMed] [Google Scholar]
- 24.Morris A, Beck JM, Schloss PD, Campbell TB, Crothers K, Curtis JL, Flores SC, Fontenot AP, Ghedin E, Huang L, Jablonski K, Kleerup E, Lynch SV, Sodergren E, Twigg H, Young VB, Bassis CM, Venkataraman A, Schmidt TM, Weinstock GM. 2013. Comparison of the respiratory microbiome in healthy nonsmokers and smokers. Am J Respir Crit Care Med 187:1067–1075. doi: 10.1164/rccm.201210-1913OC. [DOI] [PMC free article] [PubMed] [Google Scholar]
- 25.Colin A, Windmeijer FAG. 1997. An R-squared measure of goodness of fit for some common nonlinear regression models. J Econ 77:329–342. doi: 10.1016/S0304-4076(96)01818-0. [DOI] [Google Scholar]
- 26.Valm AM, Mark JL, Rieken CW, Hasegawa Y, Sogin ML, Oldenbourg R, Dewhirst FE, Borisy GG. 2011. Systems-level analysis of microbial community organization through combinatorial labeling and spectral imaging. Proc Natl Acad Sci U S A 108:4152–4157. doi: 10.1073/pnas.1101134108. [DOI] [PMC free article] [PubMed] [Google Scholar]
- 27.Cohen NA. 2006. Sinonasal mucociliary clearance in health and disease. Ann Otol Rhinol Laryngol Suppl 196:20–26. [DOI] [PubMed] [Google Scholar]
- 28.Goddard AF, Staudinger BJ, Dowd SE, Joshi-Datar A, Wolcott RD, Aitken ML, Fligner CL, Singh PK. 2012. Direct sampling of cystic fibrosis lungs indicates that DNA-based analyses of upper-airway specimens can misrepresent lung microbiota. Proc Natl Acad Sci U S A 109:13769–13774. doi: 10.1073/pnas.1107435109. [DOI] [PMC free article] [PubMed] [Google Scholar]
- 29.Garzoni C, Brugger SD, Qi W, Wasmer S, Cusini A, Dumont P, Gorgievski-Hrisoho M, Mühlemann K, von Garnier C, Hilty M. 2013. Microbial communities in the respiratory tract of patients with interstitial lung disease. Thorax 68:1150–1156. doi: 10.1136/thoraxjnl-2012-202917. [DOI] [PMC free article] [PubMed] [Google Scholar]
- 30.Pezzulo AA, Kelly PH, Nassar BS, Rutland CJ, Gansemer ND, Dohrn CL, Costello AJ, Stoltz DA, Zabner J. 2013. Abundant DNase I-sensitive bacterial DNA in healthy porcine lungs and its implications for the lung microbiome. Appl Environ Microbiol 79:5936–5941. doi: 10.1128/AEM.01752-13. [DOI] [PMC free article] [PubMed] [Google Scholar]
- 31.Stevenson BS, Eichorst SA, Wertz JT, Schmidt TM, Breznak JA. 2004. New strategies for cultivation and detection of previously uncultured microbes. Appl Environ Microbiol 70:4748–4755. doi: 10.1128/AEM.70.8.4748-4755.2004. [DOI] [PMC free article] [PubMed] [Google Scholar]
- 32.Ingenito EP, Solway J, McFadden ER Jr, Pichurko B, Bowman HF, Michaels D, Drazen JM. 1987. Indirect assessment of mucosal surface temperatures in the airways: theory and tests. J Appl Physiol 63:2075–2083. [DOI] [PubMed] [Google Scholar]
- 33.West JB. 1968. Regional differences in the lung. Postgrad Med J 44:120–122. doi: 10.1136/pgmj.44.507.120. [DOI] [PMC free article] [PubMed] [Google Scholar]
- 34.Dickson RP, Erb-Downward JR, Huffnagle GB. 2014. Towards an ecology of the lung: new conceptual models of pulmonary microbiology and pneumonia pathogenesis. Lancet Respir Med 2:238–246. doi: 10.1016/S2213-2600(14)70028-1. [DOI] [PMC free article] [PubMed] [Google Scholar]
- 35.Hatch TF. 1961. Distribution and deposition of inhaled particles in respiratory tract. Bacteriol Rev 25:237–240. [DOI] [PMC free article] [PubMed] [Google Scholar]
- 36.Wu H, Kuzmenko A, Wan S, Schaffer L, Weiss A, Fisher JH, Kim KS, McCormack FX. 2003. Surfactant proteins A and D inhibit the growth of Gram-negative bacteria by increasing membrane permeability. J Clin Invest 111:1589–1602. doi: 10.1172/JCI16889. [DOI] [PMC free article] [PubMed] [Google Scholar]
- 37.Segal LN, Blaser MJ. 2014. A brave new world: the lung microbiota in an era of change. Ann Am Thorac Soc 11:S21–S27. doi: 10.1513/AnnalsATS.201306-189MG. [DOI] [PMC free article] [PubMed] [Google Scholar]
- 38.Berger G, Wunderink RG. 2013. Lung microbiota: genuine or artifact? Isr Med Assoc J 15:731–733. [PubMed] [Google Scholar]
- 39.Charlson ES, Bittinger K, Chen J, Diamond JM, Li H, Collman RG, Bushman FD. 2012. Assessing bacterial populations in the lung by replicate analysis of samples from the upper and lower respiratory tracts. PLoS One 7:e42786. doi: 10.1371/journal.pone.0042786. [DOI] [PMC free article] [PubMed] [Google Scholar]
- 40.Dickson RP, Erb-Downward JR, Freeman CM, Walker N, Scales BS, Beck JM, Martinez FJ, Curtis JL, Lama VN, Huffnagle GB. 2014. Changes in the lung microbiome following lung transplantation include the emergence of two distinct Pseudomonas species with distinct clinical associations. PLoS One 9:e97214. doi: 10.1371/journal.pone.0097214. [DOI] [PMC free article] [PubMed] [Google Scholar]
- 41.Huang L, Cattamanchi A, Davis JL, den Boon S, Kovacs J, Meshnick S, Miller RF, Walzer PD, Worodria W, Masur H, International HIV-Associated Opportunistic Pneumonias (IHOP) Study, Lung HIV Study . 2011. HIV-associated Pneumocystis pneumoniae. Proc Am Thorac Soc 8:294–300. doi: 10.1513/pats.201009-062WR. [DOI] [PMC free article] [PubMed] [Google Scholar]
- 42.Oliver JD. 2010. Recent findings on the viable but nonculturable state in pathogenic bacteria. FEMS Microbiol Rev 34:415–425. doi: 10.1111/j.1574-6976.2009.00200.x. [DOI] [PubMed] [Google Scholar]
- 43.Human Microbiome Project Consortium 2012. Structure, function and diversity of the healthy human microbiome. Nature 486:207–214. doi: 10.1038/nature11234. [DOI] [PMC free article] [PubMed] [Google Scholar]
- 44.Ding T, Schloss PD. 2014. Dynamics and associations of microbial community types across the human body. Nature 509:357–360. doi: 10.1038/nature13178. [DOI] [PMC free article] [PubMed] [Google Scholar]
- 45.Schloss PD, Westcott SL, Ryabin T, Hall JR, Hartmann M, Hollister EB, Lesniewski RA, Oakley BB, Parks DH, Robinson CJ, Sahl JW, Stres B, Thallinger GG, Van Horn DJ, Weber CF. 2009. Introducing mothur: open-source, platform-independent, community-supported software for describing and comparing microbial communities. Appl Environ Microbiol 75:7537–7541. doi: 10.1128/AEM.01541-09. [DOI] [PMC free article] [PubMed] [Google Scholar]
- 46.Wilson EB. 1927. Probable inference, the law of succession, and statistical inference. J Am Stat Assoc 22:209–212. doi: 10.1080/01621459.1927.10502953. [DOI] [Google Scholar]
- 47.Jousimies-Somer H, Summanen P, Citron D, Baron E, Wexler H, Finegold S. 2002. Wadsworth-Ktl anaerobic bacteriology manual. Star Publishing Company, Belmont, CA. [Google Scholar]
Associated Data
This section collects any data citations, data availability statements, or supplementary materials included in this article.
Supplementary Materials
Taxonomic characterization of all uncultivated OTUs.