

Abstract
In this retrospective study we tested the hypothesis that the net effect of impaired electrical conduction and therefore increased heat dissipation in multiple sclerosis (MS) results in elevated lateral ventricular (LV) cerebrospinal fluid (CSF) diffusivity as a measure of brain temperature estimated in vivo using diffusion tensor imaging (DTI). We used validated DTI-based segmentation methods to obtain normalized LV-CSF volume and its corresponding CSF diffusivity in 108 MS patients and 103 healthy controls in the age range of 21-63 years. The LV CSF diffusivity was ~2% higher in MS compared to controls that corresponds to a temperature rise of ~1 °C that could not be explained by changes in the CSF viscosity due to altered CSF protein content in MS. The LV diffusivity decreased with age in healthy controls (r=−0.29; p=0.003), but not in MS (r=0.15; p=0.11), possibly related to MS pathology. Age-adjusted LV diffusivity increased with lesion load (r=0.518; p=1x10⁻⁸). Our data suggest that the total brain lesion load is the primary contributor to the increase in LV CSF diffusivity in MS. These findings suggest that LV diffusivity is a potential in vivo biomarker of the mismatch between heat generation and dissipation in MS. We also discuss limitations and possible confounders.
Keywords: multiple sclerosis, temperature, diffusion tensor imaging, lateral ventricles, diffusivity, healthy controls, cerebrospinal fluid, age, CSF, DTI, MS
1. Introduction
Histopathological and neurophysiological studies in multiple sclerosis (MS) indicate that demyelination, axonal degeneration and impaired signal encoding or dysregulated ion channel expression are major hallmarks of central nervous system dysfunction in MS [1, 2]. Demyelination and axonal loss manifest radiologically as lesions and diffuse atrophy [1]. Connectivity required for intra- or interhemispheric communication is impaired as a result of reduced electrical conduction [2], or increased impedance to neuronal signal transmission along central pathways affected in MS [5]. MS brain energy resources are wasted in part due to these inefficient electrical and chemical circuits and combined with reduced perfusion could result in ineffective dissipation of heat compared to healthy brain [2]. While elevated body temperature effects [3] and thermal regulation mechanisms are well-described in MS, little is known about brain temperature in MS [4].
Increase in brain temperature is detrimental to tissue function and repair mechanisms [5]. Specifically, blood-cerebrospinal fluid (CSF)-barrier and blood-brain barrier (BBB) permeability increases with temperature [6]. In addition, acute glial activation and vasogeneic edema have been reported in animal models of brain hyperthermia [6]. Slight brain temperature increase has been reported in stroke [7], Parkinson’s disease [8], Moyamoya [9], head trauma [10], hydrocephalus [11], and more recently in MS using magnetic resonance spectroscopy [12]. Recent research in quantitative magnetic resonance imaging (qMRI) has led to the proposal [13] and validation [14] of the use of lateral ventricular (LV) CSF diffusivity as an in vivo marker of human brain temperature [14]. Kozak and colleagues [13] showed that the lateral ventricular CSF temperature may be related to the diffusion coefficient (D) by the equation: T (°C) = 2256.74/ln (4.39221/D) - 273.15, where T is the temperature in degrees Celsius. Sakai and colleagues [14] used diffusivity of LV CSF to show that brain temperature decreases in normal aging with comparable rate between healthy men and women [14]. A reduction in brain temperature with age may be related to reduced metabolic demand due to neuronal and axonal atrophy with natural aging [15]. In patient populations, Yamada and colleagues [9] used this measure to infer that brain temperature is elevated in Moyamoya patients [9]. More recently, Sai and colleagues [16] used this measure on thirteen healthy controls and thirteen MS patients and reported that brain temperature is reduced in MS patients, apparently contradicting a short report of elevated temperature in MS using magnetic resonance spectroscopy [12].
Steady state brain temperature is highly regulated through homeostasis balance between energy demand, production and heat dissipation via thermal conduction and the convective cooling effects of blood flow [17, 18]. One might hypothesize that impaired electrical signal conduction MS due to demyelination and axonal loss might increase heat generation.
We hypothesized that widespread MS pathology in cerebral tissues can lead to elevated deep brain temperature as evidenced by measurements of LV CSF diffusivity, and that elevated diffusivity might reflect poor heat dissipation. Additionally, we expected that natural aging reduction in brain temperature [14] might be modulated in MS due to the increased thermal load.
We utilized validated techniques to segment the LV using diffusion tensor imaging (DTI) tissue contrast and studied the effects of age, disease duration, lesion load and disability on LV volumetry and demonstrate that LV CSF diffusivity is a useful marker of MS pathology. We also discuss limitations and possible confounders.
2. Materials and Methods
2.1. Study Population
The MRI protocol was approved by our Institutional Review Board (IRB). Written informed consent was obtained from each subject. Data from 103 healthy adult controls and 108 medicated patients and MRI data were obtained during their remission. The patient cohort included eighty-seven (20 men and 67 women) with relapsing-remitting MS (RRMS) with 42.6 ± 9.9 years of age (mean ± standard deviation; see Table 1), nine patients with clinically isolated syndrome (CIS), and 12 with secondary progressive MS (SPMS) [19]. At the time of their imaging session, 47% of patients were using glatiramer acetate, 22% an interferon preparation (73.7% a subcutaneous product), and 25% were not on any disease modifying therapy. The healthy adult cohort (48 men and 55 women) 37.0 ± 10.5 years (see Table 1) were recruited from the local community and university staff. All control subjects were screened for history of trauma, surgery, chronic illness, alcohol and/or drug abuse, neurological illness, and current pregnancy. None of the controls in this study reported any neurological conditions and their fluid-attenuated inversion recovery (FLAIR) conventional MRI were judged to be normal.
Table 1.
Main demographic, clinical and MRI derived characteristics of patients and healthy controls.
| Healthy Controls | CIS | RRMS | SPMS | |
|---|---|---|---|---|
| N(Females) | 103 (55) | 9 (7) | 87 (67) | 12 (6) |
|
Age (years)
Mean ± S.D. Median [Range] |
37.0 ± 10.5 35.9 [20.7-61.8] |
39.2 ± 14.7 40.2 [20.8-50.6] |
42.6 ± 9.9 44.6 [22.0-63.1] |
54.2 ± 9.0 56.1 [35.4-62.9] |
|
Disease Duration
(years) |
not applicable | 2.8 ± 3.2 1.3 [0.2-8.8] |
11.0 ± 9.2 10.0 [0.1-36.8] |
18.4 ± 9.3 18.9 [1.8-30.9] |
| EDSS | not applicable | 0.4 ± 0.8 0 [0-2] |
1.7 ± 1.6 1.5 [0-6.5] |
4.4 ± 1.5 4.5 [2-6.5] |
| Lesion Load(mL) | No lesions | 2.21 ± 2.74 1.34 [0.15-8.16] |
12.35 ± 11.71 7.41 [0.18-4.8] |
25.0 ± 14.4 26.8 [7.0-59.3] |
|
LV Volume (mL)
LV-to-ICV volume Percentage |
12.07 ± 5.70 0.78 ± 0.36 |
15.45 ± 9.95 1.02 ± 0.59 P (HC, CIS) = 0.08 |
18.75 ± 9.52 1.29 ± 0.65 P (RRMS, HC) ~ 3×10⁻¹⁰ |
35.52 ± 14.30 2.47 ± 1.04 P (SPMS, HC) ~5×10⁻²¹ |
|
LV
Mean Diffusivity (×10−3 mm2 sec−1) |
2.79 ± 0.10 | 2.78 ± 0.10 P (HC , CIS) = 0.6 |
2.85 ± 0.10 P (RRMS > HC) = 0.0001 |
2.97 ± 0.08 P (SPMS > HC) ~ 4×10⁻⁸ |
The MRI derived measures include the lateral ventricle volume cerebrospinal fluid volume (mL), and LV-to-intracranial volume percentage (LVv/ICV (x100%), and corresponding average LV diffusivity.
Abbreviations: CIS = clinically isolated syndrome; RRMS = Relapsing-remitting multiple sclerosis; SPMS = Secondary progressive multiple sclerosis; HC = healthy controls.
2.2. MRI Data Acquisition
All MRI studies were performed on the same 3.0 T Philips Intera scanner with a dual quasar gradient system with maximum gradient amplitude of 80 mT/m and an eight channel SENSE-compatible head coil (Philips Medical Systems, Best, Netherlands). All sequences were acquired without respiratory or cardiac gating.
2.3. Conventional MRI
The MRI protocol included whole brain axial 3D T1-weighted volume (reconstructed voxel size = 0.94 mm × 0.94 mm × 0.94 mm), echo time (TE) = 3.7 ms, and repetition time (TR) = 8.1 ms and total scan time was 6 minutes. The T1-weighted image volume was used for LV segmentation validation. In addition, dual fast spin-echo (FSE) images were acquired with echo and repetition times of TE1/TE2/TR = 8.2/90/6800 ms and a FLAIR sequence with (TE/TI/TR = 80/2500/8000 ms). These images were used for lesion quantification [19, 20]. The slice thickness for both FSE and FLAIR data was 3.0 mm with 44 contiguous axial slices covering the same inferior-to-superior prescription of the 3D T1-weighted sequence and a square field-of-view (FOV) of 240 mm.
2.4. Diffusion Tensor Imaging Data Acquisition
DTI data were acquired using a single-shot spin-echo diffusion sensitized echo-planar imaging sequence with balanced Icosa21 diffusion encoding scheme with twenty-one uniformly- distributed orientations over the unit hemisphere [21] with b-factor = 1000 sec.mm−2, TR/TE = 7100/65 ms. The slice thickness, FOV and spatial coverage matched the FSE and FLAIR.
2.5 Conventional MRI and DTI Data Processing
All human brain MRI data sets were masked to remove non-brain tissues and estimate the intracranial volume (ICV) for each subject as described elsewhere [19, 20].
2.6. Lesion Load Segmentation using Conventional MRI
Whole brain lesion load (LL) was quantified in the patient groups using the co-registered multispectral dual FSE and the FLAIR volumes as described elsewhere [19, 20]. The lesion volumes were saved as binary masks to enable fusion with other multimodal volumes acquired from the same subject.
2.7. DTI Data Processing
Diffusion-weighted images (DWI) were coregistered to the baseline “b0” images (without diffusion weighting) to correct for the eddy-current-induced image distortions using the software on the Philips PRIDE workstation (Philips Medical Systems, Best, Netherlands). The distortion- corrected DWI volumes were then decoded [21] and DTI maps were generated using an in-house toolbox implemented in Matlab under SPM [22]. The results of the DTI pipeline included fractional anisotropy (FA), mean diffusivity (MD), radial and axial diffusivity maps.
2.8. Lateral Ventricle Volume Segmentation
The high contrast between brain parenchyma and CSF on the DTI-derived FA and MD maps were used to segment brain tissue using unified and multi-modal segmentation [23] implemented in SPM (http://www.fil.ion.ucl.ac.uk/spm/) as detailed elsewhere [24]. The automatic identification of LV utilized a binary mask of the LV in standard space built from a large cohort of normal subjects [25]. The segmentation of the LV in the native space was achieved by applying the inverse spatial normalization parameters for each subject [24].
2.9. Quantification of LV using DTI Measures, Validation and Data Quality Assurance
The DTI-based segmentation procedure provided the LV mask in each subject’s native space that was used to estimate the volume by counting the number of voxels and multiplying by the voxel volume. To assess spatial overlap between the DTI-based and the T1w LV segmentations the b0 map was realigned to the T1w volume using normalized mutual information and carried the transformation unto the LV mask using nearest neighbor interpolation. The Dice similarity index, defined as the percentage of spatial overlap volume between the DTI-based and T1w-based masks to the mean value of the two volumes was then estimated [24, 25]. In addition, the LV and the corresponding DTI-derived measures such as the diffusivities and fractional anisotropy were estimated for each subject. To assure the accuracy of the estimated DTI measures of the LV and reduce contamination of LV with bordering brain tissue, the LV volume mask was eroded maintaining mean diffusivity values in the range 0.0025 to 0.0035 mm*mm/sec [24]. The LV voxels on all subjects were pooled to examine closely the histogram distribution of the LV and its corresponding DTI measures to help reject potential outliers [14, 17] due to non-random motion (i.e. turbulent flow, pulsation).
To assure scanner stability during the ~ 4 years of the study, data were acquired monthly using identical DTI protocol on a spherical water phantom. The water DTI phantom data were analyzed from a central region-of-interest to assure temporal stability using quality assurance measures described previously [26].
2.10. Statistical Analysis
Correlations between age, LV volume-to-ICV percentage, LL, disease duration, DTI-derived measures of the LV were computed using the Pearson correlation coefficient. Age-covaried correlations between expanded disability status score (EDSS) score and all other MRI-based measures were computed using the Spearman coefficient. For EDSS covariance with LL and age, generalized linear models was used. Slopes and rates of change of MRI measures with age were compared using the r to z-Fisher transform [27]. Comparisons between group means and medians were performed using ANOVA (t-test) and the Mann-Whitney U-test. Statistical significance accounted for multiple comparisons (i.e. p < 0.05 / number of comparisons = 3 for three MS subgroups vs. healthy controls). All group comparison differences, significance, rate of change and correlations with age, EDSS, LL were computed volume-wise in native data space and were presented in standard space for visual inspection and fusion with the lesion probability maps. All statistical analyses used MATLAB R12.1 Statistical Toolbox v 3.0 (The Mathworks Inc, Natick, MA).
3. Results
3.1. Population Demographics and Clinical Information
The healthy men and women were age-matched (p=0.18). Women and men in the RRMS patient group were age-matched (p=0.55). In this report both left and right LV sides are included; side and gender effects and interaction with pathology and age are not analyzed. The LV volumetry and corresponding mean diffusivity on the 9 CIS, 87 RRMS, 12 SPMS patients and 103 healthy controls are presented in Table 1. The patient subgroups were significantly different in age, disease duration (DD), EDSS, and LL. The univariate correlation coefficient and statistical significance of these variables is provided in Table 2. EDSS correlated with the whole brain LL (r=0.472; p<0.000001) and DD (r=0.456; p<0.000001). These cross-sectional correlations are generally consistent with well-documented longitudinal and cross-sectional age-related trends in large MS populations [28].
Table 2.
Univariate linear correlation coefficient (r) and significance (p) covariance matrix of age, DD, EDSS (Spearman), Lesion load, LV volume-to-ICV percentage and corresponding mean diffusivity. Age, total lesion load and atrophy correlations of EDSS with LVp and diffusivity are also provided.
| 108 patients Correlation Coefficient r(p) |
DD | EDSS | Lesion Load | LVp | MD(LV) |
|---|---|---|---|---|---|
| Age | 0.512 (1.5×10⁻⁸) |
0.337 (3.6×10⁻⁴) |
0.215 (0.025) |
0.361 (1.3×10⁻⁴) |
0.153 (0.11) |
| DD | 0.456 (7×10⁻⁷) |
0.358 (1.4×10⁻⁴) |
0.349 (2.1×10⁻⁴) |
0.237 (0.013) |
|
| Lesion Load | 0.522 (7×10⁻⁹) |
0.533 (2.9×10⁻⁹) |
|||
|
EDSS
EDSS adjusted for age for Age and LL for age, LL& LVp |
0.472(3×10⁻⁷)
0.43 (4×10⁻⁶) |
0.47(2×10⁻⁷)
0.4 (2×10⁻⁵) 0.2 (0.04) |
0.40 (2×10⁻⁵)
0.36 (0.0001) 0.15 (0.14) 0.05 (0.61) |
Abbreviations: DD = disease duration; EDSS = extended disability score; LL = lesion load; LVp = lateral ventricular volume to intracranial volume percentage; MD = mean diffusivity
3.2. Water Phantom Stability Analysis
Analysis of the water phantom data [18] acquired almost monthly over 4 years indicate stability over time (i.e. average FA ± S.D. = 0.015 ± 0.002; FA temporal correlation significance p=0.30; average MD ± S.D. = (1.88 ± 0.16) ×10−3 mm2 sec−1; MD temporal correlation significance p=0.20, and a relative mean diffusivity coefficient-of-variation (0.45 ± 0.06) %).
3.3. Validation of DTI-based LV Segmentation using T1-weighted Data
The average spatial overlap or Dice between the T1w and DTI-LV segmentations on healthy controls was (79.3 ± 3.9%, range 75.6 - 86.4%, and median = 80.3%. The values on patients were Dice index average = 81.4 ± 3.9%, range 70-88 % and median = 82.3%. Figure 1A illustrates the fusion of the DTI-based and T1w masks on one MS patient. The spatially normalized FA and MD maps on the MS cohort are shown in Figure 1B, 1C shows the effect of LV mask erosion on lateral ventricular mean diffusivity and FA histogram distributions, respectively obtained on all MS patients. Figure 1B image insert illustrates the spatial variability in LV diffusivity. Note that the diffusivity is highest in the anterior horn of the LV.
Figure 1.

Illustration of LV segmentation validation and LV mean diffusivity spatial variability. (A) A fusion map of the DTI-based and T1w masks on one MS patient with lesions shown in red, DTI-based mask shown in green and T1w-based LV mask shown in blue; the overlapping regions will show as cyan. This patient had a dice similarity index of 88.1%. Illustration of the effect of LV mask erosion on lateral ventricular (B) mean diffusivity and (C) FA histogram distributions obtained on all MS patients (red is high level of erosion and black is low level of erosion). The spatial normalization of MD in the LV is shown as an image insert in (B). Note the spatial variability in LV diffusivity (i.e. anterior LV has higher diffusivity).
3.4. Group Comparisons of Lateral Ventricular Volume and Diffusivity
The patient subgroups were different on LV volumetry and corresponding diffusivity. The LV volume-to-ICV percentage (LVp) was ~ 80% greater (p=2×10⁻¹¹) in the entire patient cohort (LVp=1.4 ± 0.80; N=108) than healthy controls (LVp=0.78 ± 0.36; N=103). Using erosion level 4 (see Figure 1.B), the LV CSF mean diffusivity was ~ 2% greater (p=0.00001) in the MS patient cohort (2.86 ± 0.11) × 10−3 mm2 sec−1) compared with healthy controls (2.79 ± 0.10) x10−3 mm2 sec−1).
3.5. Lateral Ventricular Volume and Diffusivity: Age, Lesion Load and EDSS
Figure 2 shows the scatter plot of age vs. (A) LVp and (B) corresponding mean diffusivity.
Figure 2.
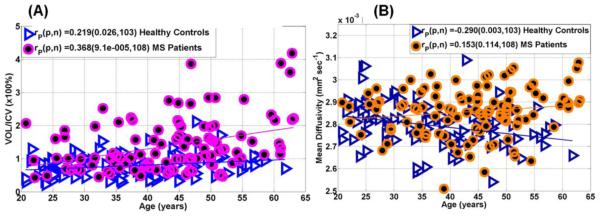
Representative scatter plots and regression analysis illustrating the age-dependence of (A) lateral ventricular volume-to-ICV percentage and (B) age dependence of LV mean diffusivity in 103 healthy controls and 108 MS patients (see Table 1). Note the increase in LV volume with age in controls (p=0.03) and patients (p=0.0001), and the decrease in LV diffusivity with age in controls (p=0.003).
Figure 3 shows (A) the age-adjusted correlations between LL, and (B) EDSS with lateral ventricular mean diffusivity. Note the increase in the LV volume with age in healthy controls and that the rate of increase is greater in MS patients (p=0.008). The LV CSF diffusivity decreased with age in healthy controls (r=−0.29; p=0.003), but not in MS (r=0.15; p=0.11). The LV CSF diffusivity adjusted for age increased with total lesion volume (r=0.518; p=1x10⁻⁸). The LV CSF diffusivity increased with disease duration (r=0.24; p=0.01), and EDSS (r=0.4; p=0.00002; Table 2), but when adjusted for age and total LL, the correlation was lost (r=0.05; p=0.61) suggesting that total brain LL is the primary contributor to the increase in LV CSF diffusivity in MS (Table 2).
Figure 3.
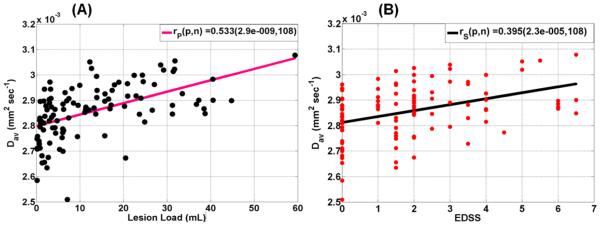
Representative scatter plots and regression analysis of (A) total brain lesion load (mL) and mean diffusivity adjusted for age, and (B) EDSS and mean diffusivity in the MS cohort adjusted for age and total lesion load. Note the strong dependence of LV diffusivity on lesion load (p=2.9x10⁻⁹) and its interplay with disability (p=2.3 ×10⁻⁵; see Table 2 for age-adjusted values).
4. Discussion
A comprehensive report on the LV CSF volumetry and corresponding mean diffusivity in a relatively large cohort of MS patients and healthy controls is presented with validated LV segmentation methods [24, 25] and water phantom DTI measurements to assure scanner stability [24, 26]. The data were also analyzed as a function of age, DD, and LL to provide potential predictors of physical disability in MS patients as measured by EDSS. The LV CSF diffusivity method used in this work has been validated [13, 29, 30] and used previously by others [9, 14, 16] to infer core brain temperature. Water molecular diffusion, relaxation time, and proton frequency shift dependence on temperature is well-documented [31-36]. The method used in this work is limited to CSF and contamination with neighboring parenchyma and pulsatile flow have been reduced through a combination of mask erosion and thesholding as has been described previously [13, 14, 24, 31].
4.1. Age effects and Comparison of Findings with Previous Literature
The age dependence of our LV volumetry results is consistent with previous reports on the increase in LV volume in healthy aging [37]. Our results on the LV volumetry in MS and its sensitivity to central atrophy are also consistent with previous reports [38]. The decrease in LV CSF diffusivity with age in healthy controls is consistent with a recent report in healthy controls using manually-delineated LV [14]. Sakai and colleagues attributed their findings to a decrease in brain temperature subsequent to reduced energy demand as a result of tissue loss with healthy aging [14].
4.2. Biophysical Contributors to Measured Water Diffusivity
As described in APPENDIX A, water molecular diffusivity is affected by both temperature (13, 30-32) and protein content [39. An increase in CSF protein content results in higher viscosity at constant temperature [39]. A reduction in LV CSF diffusivity is expected due to increased viscosity based on a potential increase in CSF protein content with advancing age [40, 41], or pathology [39, 42, 43]. We were unable to find reports on direct LV CSF viscosity measurements in controls or MS patients. One report indicated that plasma viscosity in MS was not significantly different from healthy age-matched controls [44]. Since much of the CSF protein originates from filtering blood plasma protein through the CSF-blood barrier, one would expect the CSF viscosity to be smaller than that of blood plasma viscosity [44]. In addition, even if there was a slight increase in the CSF protein content as might be expected in MS due to increased blood-CSF permeability [6], this would result in decreased diffusivity due to increased molecular interactions or internal fluid friction [32, 39] rather than the increase in diffusivity as observed in this study.
4.3. Interpretation of Findings
The relationship between change in the CSF molecular diffusivity and slight temperature changes [13, 14, 30-32] expects an increase of ~2% for a 1 degree Celsius change in temperature (see APPENDIX A). Our results show ~2% increase in CSF diffusivity measured in RRMS patients relative to healthy controls. The LV CSF temperature is expected to be higher than any other brain region [11], and our data (Fig. 1B) indicate a clear spatial gradient in LV CSF diffusivity consistent with an expected temperature distribution based on the bioheat equation [17, 45]. Given the strong dependence of water diffusivity on temperature [13, 14, 30-32], this would account for a change in CSF temperature by ~1 °C in RRMS when compared to healthy controls. This estimate is consistent with a recent short report in MS using magnetic resonance spectroscopy [12]. It is noteworthy that a recent DTI-based study by Sai and colleagues [15] on 13 medicated MS patients with disease duration of 5-22 years and EDSS of 0-7 reported a decrease in central brain temperature which was attributed to decreased brain metabolism in MS patients [46, 47]. The study by Sai and colleagues conducted at 3T -- using comparable diffusion b-factor, spatial and temporal scan acquisition parameters-- [15] did not include an analysis of lesion load and did not report correlations with disease duration and disability, and hence their results may be confounded by the small numbers and age effects. One might hypothesize that impaired electrical signal conduction MS due to demyelination and axonal loss [2] might increase heat generation. Additionally, the well-documented reduction in total [48] and regional [49, 50] cerebral blood flow in MS patients compared with healthy controls might lessen the cooling effects of blood circulation [17, 18, 45]. An increase in core brain temperature may also cause further damage as the result of changes in barrier permeability with temperature and subsequent increase in tissue extracellular edema [5, 6].
4.4. Implications of Findings to Multiple Sclerosis
Empirically, and aside from the limitations of the biophysical interpretation, our data show that LV CSF diffusivity increases with DD, LL and EDSS and offers a potential and noninvasive biomarker that could be useful in clinical trials. The LV CSF volumetry and corresponding diffusivity are measures that can be obtained using simple DWI methods without estimating the full tensor with short acquisition times. Our results may offer a refinement to explanations of reports of extreme sensitivity of MS patients to increased ambient temperature and of therapies that may increase the efficiency of thermal heat dissipation [3, 4].
4.5. Limitations
Limitations of our work include the lack of blood-plasma and CSF laboratory data on both controls and patients. Due to ethical concerns one could not justify acquiring LV CSF protein content and direct brain temperature measures on humans, but this could be pursued in animal models. To reduce the number of comparisons, we did not study gender and LV-CSF side effects and their interactions with age and pathology. We also have not studied the effect of therapy [51] and lesion spatial distribution on the LV diffusivity [52].
Due to acquisition time considerations, we did not acquire pulse-gated DTI data on the same subjects to study the effect of CSF pulsatility on the estimated mean diffusivity. We also have not acquired additional in vivo MRI measurements [36] such as magnetic resonance spectroscopy [7] to compare methods to estimate brain temperature [53]. Despite the application of carefully implemented erosion procedure to minimize the inclusion of non-CSF brain tissues, we have not examined the potential effects of erosion and motion on our measurements [54]. We also have not examined subtle confounding effects of turbulent CSF flow and CSF production rate [55]. These issues were beyond the scope of this retrospective study and may be pursued in the future using data acquired serially on patients and controls. In this work we adopted a DTI encoding scheme that provided multiple intrascan estimates of diffusivity [21], this assured reproducibility and SNR-independence of the LV-CSF diffusivity measure. Our data show that the anterior LV CSF diffusivity is highest in the brain consistent with expected in vivo measurements [11] with no contamination from choroid plexus which is commonly present posterior. Despite the provision of spatial distribution of LV-CSF diffusivity in standard space, we have not analyzed the effects of spatial variability on the reported LV diffusivity in each subject native space. This requires an extension of the atlas-based methods to the lateral ventricular specific fields, and eventually to all ventricular CSF compartments. Additionally, the reported increase in iron content in deep brain gray matter with age, location [56, 57, 58] or MS pathology [59, 60] could not have been the direct cause of CSF diffusivity increase as our measurements were taken at the core brain. A detailed account of the interplay between elevated iron content in MS deep gray matter and brain temperature is beyond the scope of this work and may require additional measurements (i.e. MRS) to map temperature in structures adjacent to the lateral ventricles [12].
This report presented a retrospective analysis of DTI data collected using a protocol optimized primarily for whole brain parenchyma quantification at b=1000 s mm−2 and using 3mm sections with DTI scan time kept under 7 minutes to accommodate a wide range of ages and patient populations that were scanned at our imaging center. For combined CSF and brain tissue quantification, a DTI protocol with multiple b-factors (i.e. 300, 600 s mm−2) and thinner slices (i.e. 1-2 mm) would have provided additional data to optimize the protocol for CSF DTI quantification and test potential partial volume and signal-to-noise estimation biases [17].
4.6. Conclusions
In summary, despite these limitations, our results demonstrate that DTI acquisition and analysis methods adopted in this work are reliable for CSF volume and DTI metric quantification on large cohorts of healthy controls and MS patients. These results support exploration of CSF LV volumetry and diffusivity as neuroimaging markers for clinical trials.
Acknowledgements
This work is funded by Dunn Foundation (KMH) and the National Institutes of Health (NIH/NINDS R01-NS052505 to KMH, NIH/NIBIB EB002095 & 1 R01 NS078244-01A1 to PAN, 5K23NS072134-02 awarded to FN, and an unrestricted gift from the Band Against Multiple Sclerosis to JSW. The purchase of the 3.0 T MRI clinical scanner is partially funded by NIH grant S10 RR19186 to PAN.
Abbreviations
- CSF
cerebrospinal fluid
- DD
disease duration
- EDSS
expanded disability score
- LV
lateral ventricles
- CIS
clinically isolated syndrome
- RRMS
relapsing-remitting multiple sclerosis
- SPMS
secondary progressive multiple sclerosis
- HC
healthy controls
APPENDIX A
Dependence of CSF Diffusivity on Temperature and Protein Content
The water molecular diffusion coefficient (DC) in the CSF may be related to the H2O “solvent” self-diffusion coefficient in de-ionized water at comparable temperature (32). The Einstein-Stokes equation (14) also predicts a reduction in diffusivity as viscosity (η) increases due to increase in protein content (PC) or “solute”. Thus, DC ~ T/η and this may be approximated in the vicinity of 37 °C using the water diffusivity vs. temperature calibration data (30, 32) and CSF viscosity vs. protein content (39)
| [A1] |
Note that an increase in CSF total protein content at constant temperature is expected to decrease diffusivity, but this is a weak effect for the expected protein content in CSF in healthy controls (40, 41) and MS patients (0.1-1.0 g/L). From the above equation, the increase in diffusivity due to 1 °C rise in temperature is ~ 2%.
Footnotes
Publisher's Disclaimer: This is a PDF file of an unedited manuscript that has been accepted for publication. As a service to our customers we are providing this early version of the manuscript. The manuscript will undergo copyediting, typesetting, and review of the resulting proof before it is published in its final citable form. Please note that during the production process errors may be discovered which could affect the content, and all legal disclaimers that apply to the journal pertain.
References
- [1].Trapp BD, Stys PK. Virtual hypoxia and chronic necrosis of demyelinated axons in multiple sclerosis. Lancet Neurol. 2009;8:280–91. doi: 10.1016/S1474-4422(09)70043-2. [DOI] [PubMed] [Google Scholar]
- [2].Paling D, Golay X, Wheeler-Kingshott C, Kapoor R, Miller D. Energy failure in multiple sclerosis and its investigation using MR techniques. J Neurol. 2011;258:2113–27. doi: 10.1007/s00415-011-6117-7. [DOI] [PubMed] [Google Scholar]
- [3].Nelson DA, McDowell F. The effects of induced hyperthermia on patients with multiple sclerosis. J Neurol Neurosurg Psychiatry. 1959;22:113–6. doi: 10.1136/jnnp.22.2.113. [DOI] [PMC free article] [PubMed] [Google Scholar]
- [4].Davis SL, Wilson TE, White AT, Frohman EM. Thermoregulation in multiple sclerosis. J Appl Physiol. 2010;109:1531–7. doi: 10.1152/japplphysiol.00460.2010. [DOI] [PMC free article] [PubMed] [Google Scholar]
- [5].Kiyatkin EA, Sharma HS. Permeability of the blood-brain barrier depends on brain temperature. Neuroscience. 2009;161:926–39. doi: 10.1016/j.neuroscience.2009.04.004. [DOI] [PMC free article] [PubMed] [Google Scholar]
- [6].Sharma HS, Johanson CE. Blood-cerebrospinal fluid barrier in hyperthermia. Prog Brain Res. 2007;162:459–78. doi: 10.1016/S0079-6123(06)62023-2. [DOI] [PubMed] [Google Scholar]
- [7].Marshall I, Karaszewski B, Wardlaw JM, et al. Measurement of regional brain temperature using proton spectroscopic imaging: validation and application to acute ischemic stroke. Magn Reson Imaging. 2006;24:699–706. doi: 10.1016/j.mri.2006.02.002. [DOI] [PubMed] [Google Scholar]
- [8].Rango M, Arighi A, Bonifati C, Bresolin N. Increased brain temperature in Parkinson’s disease. Neuroreport. 2012;23:129–33. doi: 10.1097/WNR.0b013e32834e8fac. [DOI] [PubMed] [Google Scholar]
- [9].Yamada K, Sakai K, Akazawa K, et al. Moyamoya patients exhibit higher brain temperatures than normal controls. Neuroreport. 2010;21:851–5. doi: 10.1097/WNR.0b013e32833d6b7a. [DOI] [PubMed] [Google Scholar]
- [10].Rumana CS, Gopinath SP, Uzura M, Valadka AB, Robertson CS. Brain temperature exceeds systemic temperature in head-injured patients. Crit Care Med. 1998;26:562–7. doi: 10.1097/00003246-199803000-00032. [DOI] [PubMed] [Google Scholar]
- [11].Hirashima Y, Takaba M, Endo S, Hayashi N, Yamashita K, Takaku A. Intracerebral temperature in patients with hydrocephalus of varying aetiology. J Neurol Neurosurg Psychiatry. 1998;64:792–4. doi: 10.1136/jnnp.64.6.792. [DOI] [PMC free article] [PubMed] [Google Scholar]
- [12].Pietroboni A, Arighi A, Deriz M, Scarpini E, Galimberti D, Bresolin N, Rango M. Brain temperature in multiple sclerosis. Mult. Scler. 2014;20(7):894–6. doi: 10.1177/1352458513508838. [DOI] [PubMed] [Google Scholar]
- [13].Kozak LR, Bango M, Szabo M, Rudas G, Vidnyanszky Z, Nagy Z. Using diffusion MRI for measuring the temperature of cerebrospinal fluid within the lateral ventricles. Acta Paediatr. 2010;99:237–43. doi: 10.1111/j.1651-2227.2009.01528.x. [DOI] [PMC free article] [PubMed] [Google Scholar]
- [14].Sakai K, Yamada K, Mori S, Sugimoto N, Nishimura T. Age-dependent brain temperature decline assessed by diffusion-weighted imaging thermometry. NMR Biomed. 2011;24:1063–67. doi: 10.1002/nbm.1656. [DOI] [PubMed] [Google Scholar]
- [15].Pakkenberg B, Gundersen HJ. Neocortical neuron number in humans: effect of sex and age. J Comp Neurol. 1997;384:312–20. [PubMed] [Google Scholar]
- [16].Sai A, Shimono T, Sakai K, Takeda A, Shimada H, Tsukamoto T, Maeda H, Sakamoto S, Miki Y. Diffusion-weighted imaging thermometry in multiple sclerosis. J Magn Reson Imaging. 2014;40:649–654. doi: 10.1002/jmri.24396. [DOI] [PubMed] [Google Scholar]
- [17].Zhu M, Ackerman JJ, Yablonskiy DA. Body and brain temperature coupling: the critical role of cerebral blood flow. J Comp Physiol B. 2009;179:701–10. doi: 10.1007/s00360-009-0352-6. [DOI] [PMC free article] [PubMed] [Google Scholar]
- [18].Bertolizio G, Mason L, Bissonnette B. Brain temperature: heat production, elimination and clinical relevance. Paediatr Anaesth. 2011;21:347–58. doi: 10.1111/j.1460-9592.2011.03542.x. [DOI] [PubMed] [Google Scholar]
- [19].Hasan KM, Walimuni IS, Abid H, et al. Multimodal quantitative magnetic resonance imaging of thalamic development and aging across the human lifespan: implications to neurodegeneration in multiple sclerosis. J Neurosci. 2011;31:16826–32. doi: 10.1523/JNEUROSCI.4184-11.2011. [DOI] [PMC free article] [PubMed] [Google Scholar]
- [20].Hasan KM, Walimuni IS, Abid H, Wolinsky JS, Narayana PA. Multi-modal quantitative MRI investigation of brain tissue neurodegeneration in multiple sclerosis. J Magn Reson Imaging. 2012;35:1300–11. doi: 10.1002/jmri.23539. [DOI] [PMC free article] [PubMed] [Google Scholar]
- [21].Hasan KM, Parker DL, Alexander AL. Comparison of gradient encoding schemes for diffusion-tensor MRI. J Magn Reson Imaging. 2001;13:769–80. doi: 10.1002/jmri.1107. [DOI] [PubMed] [Google Scholar]
- [22].Hasan KM, Walimuni IS, Abid H, Hahn KR. A review of diffusion tensor magnetic resonance imaging computational methods and software tools. Comput Biol Med. 2011;41:1062–72. doi: 10.1016/j.compbiomed.2010.10.008. [DOI] [PMC free article] [PubMed] [Google Scholar]
- [23].Ashburner J. Computational anatomy with the SPM software. Magn Reson Imaging. 2009;27:1163–74. doi: 10.1016/j.mri.2009.01.006. [DOI] [PubMed] [Google Scholar]
- [24].Hasan KM, Moeller FG, Narayana PA. DTI-based segmentation and quantification of human brain lateral ventricular CSF volumetry and mean diffusivity: Validation, age, gender effects and biophysical implications. Magn Reson Imag. 2014;32:405–12. doi: 10.1016/j.mri.2014.01.014. [DOI] [PMC free article] [PubMed] [Google Scholar]
- [25].Kempton MJ, Underwood TS, Brunton S, Stylios F, Schmechtig A, Ettinger U, et al. A comprehensive testing protocol for MRI neuroanatomical segmentation techniques: Evaluation of a novel lateral ventricle segmentation method. Neuroimage. 2011;58:1051–9. doi: 10.1016/j.neuroimage.2011.06.080. [DOI] [PMC free article] [PubMed] [Google Scholar]
- [26].Hasan KM, Wilde EA, Miller ER, Kumar Patel V, Staewen TD, Frisby ML, et al. Serial atlas-based diffusion tensor imaging study of uncomplicated mild traumatic brain injury in adults. J Neurotrauma. 2014;31:466–475. doi: 10.1089/neu.2013.3085. [DOI] [PubMed] [Google Scholar]
- [27].Zou KH, Tuncali K, Silverman SG. Correlation and simple linear regression. Radiology. 2003;227:617–622. doi: 10.1148/radiol.2273011499. [DOI] [PubMed] [Google Scholar]
- [28].Trojano M, Liguori M, Bosco Zimatore G, Bugarini R, Avolio C, Paolicelli D, et al. Age-related disability in multiple sclerosis. Ann Neurol. 2002;51:475–80. doi: 10.1002/ana.10147. [DOI] [PubMed] [Google Scholar]
- [29].Tofts PS, Jackson JS, Tozer DJ. Imaging cadavers: cold FLAIR and noninvasive brain thermometry using CSF diffusion. Magn Reson Med. 2008;59:190–95. doi: 10.1002/mrm.21456. [DOI] [PMC free article] [PubMed] [Google Scholar]
- [30].Sakai K1, Yamada K, Sugimoto N. Calculation methods for ventricular diffusion- weighted imaging thermometry: phantom and volunteer studies. NMR Biomed. 2012;25:340–6. doi: 10.1002/nbm.1755. [DOI] [PubMed] [Google Scholar]
- [31].Mills R. Self-diffusion in normal and heavy-water in range 1-45 degrees. J Phys Chem. 1973;77:685–8. [Google Scholar]
- [32].Le Bihan D, Delannoy J, Levin RL. Temperature mapping with MR imaging of molecular diffusion: application to hyperthermia. Radiology. 1989;171:853–57. doi: 10.1148/radiology.171.3.2717764. [DOI] [PubMed] [Google Scholar]
- [33].Bloembergen N, Purcell EM, Pound RV. Relaxation effects in nuclear magnetic resonance absorption. Phys Rev. 1948;73:679–712. [Google Scholar]
- [34].Parker DL. Applications of NMR imaging in hyperthermia: an evaluation of the potential for localized tissue heating and noninvasive temperature monitoring. IEEE Trans Biomed Eng. 1984;31:161–67. doi: 10.1109/TBME.1984.325382. [DOI] [PubMed] [Google Scholar]
- [35].Kickhefel A, Roland J, Weiss C, Schick F. Accuracy of real-time MR temperature mapping in the brain: a comparison of fast sequences. Phys Med. 2010;26:192–201. doi: 10.1016/j.ejmp.2009.11.006. [DOI] [PubMed] [Google Scholar]
- [36].Rieke V, Butts Pauly K. MR thermometry. J Magn Reson Imaging. 2008;27:376–90. doi: 10.1002/jmri.21265. [DOI] [PMC free article] [PubMed] [Google Scholar]
- [37].Walhovd KB, Westlye LT, Amlien I, Espeseth T, Reinvang I, Raz N, et al. Consistent neuroanatomical age-related volume differences across multiple samples. Neurobiol Aging. 2011;32:916–32. doi: 10.1016/j.neurobiolaging.2009.05.013. [DOI] [PMC free article] [PubMed] [Google Scholar]
- [38].Horakova D, Dwyer MG, Havrdova E, Cox JL, Dolezal O, Bergsland N, et al. Gray matter atrophy and disability progression in patients with early relapsing-remitting multiple sclerosis: a 5-year longitudinal study. Neurol Sci. 2009;282:112–19. doi: 10.1016/j.jns.2008.12.005. [DOI] [PubMed] [Google Scholar]
- [39].Brydon HL, Hayward R, Harkness W, Bayston R. Physical properties of cerebrospinal fluid of relevance to shunt function. 1: The effect of protein upon CSF viscosity. Br J Neurosurg. 1995;9:639–44. doi: 10.1080/02688699550040927. [DOI] [PubMed] [Google Scholar]
- [40].Murakami K, Nakagawa T, Shozu M, Uchide K, Koike K, Inoue M. Changes with aging of steroidal levels in the cerebrospinal fluid of women. Maturitas. 1999;33:71–80. doi: 10.1016/s0378-5122(99)00040-7. [DOI] [PubMed] [Google Scholar]
- [41].Sjögren M, Vanderstichele H, Agren H, Zachrisson O, Edsbagge M, Wikkelsø C, et al. Tau and Abeta42 in cerebrospinal fluid from healthy adults 21-93 years of age: establishment of reference values. Clin Chem. 2001;47:1776–81. [PubMed] [Google Scholar]
- [42].Kuhle J, Leppert D, Petzold A, Regeniter A, Schindler C, Mehling M, et al. Neurofilament heavy chain in CSF correlates with relapses and disability in multiple sclerosis. Neurology. 2011;76:1206–13. doi: 10.1212/WNL.0b013e31821432ff. [DOI] [PubMed] [Google Scholar]
- [43].Yetkin F, Kayabas U, Ersoy Y, Bayindir Y, Toplu SA, Tek I. Cerebrospinal fluid viscosity: a novel diagnostic measure for acute meningitis. South Med J. 2010;103:892–5. doi: 10.1097/SMJ.0b013e3181ebe260. [DOI] [PubMed] [Google Scholar]
- [44].Brunetti A, Ricchieri GL, Patrassi GM, Girolami A, Tavolato B. Rheological and fibrinolytic findings in multiple sclerosis. J Neurol Neurosurg Psychiatry. 1981;44:340–43. doi: 10.1136/jnnp.44.4.340. [DOI] [PMC free article] [PubMed] [Google Scholar]
- [45].Pennes HH. Analysis of tissue and arterial blood temperatures in the resting human forearm. J. Appl. Physiol. 1948;1:93–122. doi: 10.1152/jappl.1948.1.2.93. [DOI] [PubMed] [Google Scholar]
- [46].Brooks DJ, Leenders KL, Head G, Marshall J, Legg NJ, Jones T. Studies on regional cerebral oxygen utilisation and cognitive function in multiple sclerosis. J Neurol Neurosurg Psychiatry. 1984;47:1182–1191. doi: 10.1136/jnnp.47.11.1182. [DOI] [PMC free article] [PubMed] [Google Scholar]
- [47].Bakshi R, Miletich RS, Kinkel PR, Emmet ML, Kinkel WR. High-resolution fluorodeoxyglucose positron emission tomography shows both global and regional cerebral hypometabolism in multiple sclerosis. J Neuroimaging. 1998;8:228–34. doi: 10.1111/jon199884228. [DOI] [PubMed] [Google Scholar]
- [48].Swank RL, Roth JG, Woody DC., Jr Cerebral blood flow and red cell delivery in normal subjects and in multiple sclerosis. Neurol Res. 1983;5:37–59. doi: 10.1080/01616412.1983.11739631. [DOI] [PubMed] [Google Scholar]
- [49].Law M, Saindane AM, Ge Y, Babb JS, Johnson G, Mannon LJ, et al. Microvascular abnormality in relapsing-remitting multiple sclerosis: perfusion MR imaging findings in normal-appearing white matter. Radiology. 2004;231:645–52. doi: 10.1148/radiol.2313030996. [DOI] [PubMed] [Google Scholar]
- [50].Narayana PA, Zhou Y, Hasan KM, Datta S, Sun X, Wolinsky JS. Hypoperfusion and T1-hypointense lesions in white matter in multiple sclerosis. Mult Scler. 2014;20:365–373. doi: 10.1177/1352458513495936. [DOI] [PMC free article] [PubMed] [Google Scholar]
- [51].Ghezzi A, Amato MP, Capobianco M, Gallo P, Marrosu MG, Martinelli V, et al. Treatment of earlyonset multiple sclerosis with intramuscular interferonbeta-1a: long-term results. Neurol Sci. 2007;28:127–32. doi: 10.1007/s10072-007-0804-2. [DOI] [PubMed] [Google Scholar]
- [52].Demir CF, Inci MF, Özkan F, Özdemir HH. Is it possible to detect active multiple sclerosis plaques using MR thermometry techniques? Med Hypotheses. 2013;80:321–24. doi: 10.1016/j.mehy.2012.12.019. [DOI] [PubMed] [Google Scholar]
- [53].Dittmar A1, Gehin C, Delhomme G, Boivin D, Dumont G, Mott C. A non invasive wearable sensor for the measurement of brain temperature. Conf Proc IEEE Eng Med Biol Soc. 2006;1:900–2. doi: 10.1109/IEMBS.2006.259429. [DOI] [PubMed] [Google Scholar]
- [54].Le Bihan D1, Poupon C, Amadon A, Lethimonnier F. Artifacts and pitfalls in diffusion MRI. J Magn Reson Imaging. 2006;24(3):478–88. doi: 10.1002/jmri.20683. [DOI] [PubMed] [Google Scholar]
- [55].Magnano C, Schirda C, Weinstock-Guttman B, et al. Cine cerebrospinal fluid imaging in multiple sclerosis. J Magn Reson Imaging. 2012;36(4):825–34. doi: 10.1002/jmri.23730. [DOI] [PubMed] [Google Scholar]
- [56].Hasan KM, Walimuni IS, Kramer LA, Narayana PA. Human brain iron mapping using atlas-based T2 relaxometry. Magn Reson Med. 2012;67(3):731–9. doi: 10.1002/mrm.23054. [DOI] [PMC free article] [PubMed] [Google Scholar]
- [57].Rulseh AM, Keller J, Tintera J, Kožíšek M, Vymazal J. Chasing shadows: what determines DTI metrics in gray matter regions? An in vitro and in vivo study. J Magn Reson Imaging. 2013;38(5):1103–10. doi: 10.1002/jmri.24065. [DOI] [PubMed] [Google Scholar]
- [58].Zhang J, Tao R, Liu C, Wu W, Zhang Y, Cui J, Wang J. Possible effects of iron deposition on the measurement of DTI metrics in deep gray matter nuclei: an in vitro and in vivo study. Neurosci Lett. 2013;551:47–52. doi: 10.1016/j.neulet.2013.07.003. [DOI] [PubMed] [Google Scholar]
- [59].Bagnato F, Hametner S, Welch EB. Visualizing iron in multiple sclerosis. Magn Reson Imaging. 2013;31(3):376–84. doi: 10.1016/j.mri.2012.11.011. [DOI] [PMC free article] [PubMed] [Google Scholar]
- [60].Stephenson E, Nathoo N, Mahjoub Y, Dunn JF, Yong VW. Iron in multiple sclerosis: roles in neurodegeneration and repair. Nat Rev Neurol. 2014;10(8):459–68. doi: 10.1038/nrneurol.2014.118. [DOI] [PubMed] [Google Scholar]