

Abstract
Context
Thirst is a pervasive, intense, and distressing symptom in intensive care unit (ICU) patients. Although thirst may be avoided and/or treated, scant data are available to help providers identify patients most in need.
Objectives
This study was designed to identify predictors of the presence, intensity, and distress of thirst in ICU patients.
Methods
This descriptive cross-sectional study enrolled 353 patients from three ICUs (medical-surgical, cardiac, and neurological). To measure outcomes, patients were asked to report the presence of thirst (yes/no) and, if present, to rate its intensity and distress on zero to 10 numeric rating scales (10 = worst). Predictor variables were demographic (e.g., age), treatment-related (e.g., opioids), and biological (e.g., total body water). Data were analyzed with logistic regression and truncated regression with alpha preset at 0.05.
Results
Thirst presence was predicted by high opioid doses (≥50 mg), high furosemide doses (>60 mg), selective serotonin reuptake inhibitors, and low ionized calcium. Thirst intensity was predicted by patients not receiving oral fluid and having a gastrointestinal (GI) diagnosis. Thirst distress was predicted by mechanical ventilation, negative fluid balance, antihypertensive medications, and a GI or “other” diagnosis.
Conclusion
Thirst presence was predicted by selected medications (e.g., opioids). Thirst intensity and/or thirst distress were predicted by other treatments (e.g., mechanical ventilation) and medical diagnoses (e.g., GI). This is one of the first studies describing predictors of the multidimensional characteristics of thirst. Clinicians can use these data to target ICU patients whose thirst might warrant treatment.
Keywords: Thirst, ICU, symptom, palliation
Introduction
Thirst is a prevalent, intense, distressing, and under appreciated symptom in intensive care (ICU) patients.1 Thirst is closely tied to regulation of the body s fluid balance.2 Increases in osmolality and decreases in volume increase levels of angiotensin II. Fluid balance is tightly regulated; fluctuations in fluid status remain at less than 1%.3 However, ICU patients undergo many treatments that are not only essential for their recovery but that also may result in derangement of the neuroendocrine pathways that regulate fluid balance and thirst.4 Medications such as diuretics and analgesics also may predispose patients to fluid imbalance and thirst.5 Older age is a recognized risk factor for fluid imbalance and decreased thirst sensation.6,7
In a study of 50 chronically critically patients, 36 were able to report symptoms and almost 90% of those reported thirst.8 Thirst also has been reported in 70% or more of critically ill cancer patients (n = 100), 9 ICU patients at high risk of dying (n = 171), 10 and mechanically ventilated ICU patients (n = 15).11 Thirst intensity was moderate to severe across these various groups. Moderate-to-severe thirst distress also was reported in cancer patients, 9 chronically critically ill patients1, and patients at high risk of dying in the ICU.10
Despite its frequency, thirst is not routinely assessed or treated. Thirst presence, intensity, and distress, like pain, are treatable and could be reduced. Understanding the contribution of factors that can impact thirst may help clinicians target ICU patients who would benefit from thirst assessment and treatment.
This study was part of a larger trial that tested an intervention to relieve thirst.12 The participating institution provided ethical approval for the study. Patients (n = 349) or surrogates (n = 4) provided written consent. Data were gathered from January 2010 to May 2012. The overall aim of this study was to identify predictors of thirst in ICU patients. Three hypotheses were tested, namely demographic, treatment-related, and biological variables predict 1) thirst presence, 2) thirst intensity, and 3) thirst distress.
Methods
Research nurses recruited patients from three ICUs (medical-surgical, cardiac, and neurological) of a major West Coast medical center. The sample included English-speaking adults (≥18 years) who were oriented to name, date of birth, and location and were in the ICU at least 24 hours at enrollment. We sought patients who could self-report thirst, as self-report is the gold standard for symptom assessment; thus, we included patients who were oriented and scored between −1 and +1 on the Richmond Agitation Sedation Scale (i.e., not sedated or agitated).13 We enrolled patients who reported no thirst and those whose thirst intensity or thirst distress score was three or higher on a zero to 10 numeric rating scale (NRS; worst = 10). Patients with an NRS score of one or two were not included so there would be a clear delineation between those with and without thirst. Patients with electrical devices (e.g., pacemaker) were excluded, as these instruments preclude use of bioelectrical impedance analysis (BIA), the measure of total body water (TBW).
The research nurse asked each patient whether he/she was thirsty and the patient answered yes or no to measure thirst presence. For those with thirst, thirst intensity and distress were separately measured using zero to 10 NRS. Anchor words for thirst intensity were “no thirst” and “worst possible thirst” and for thirst distress were “no distress” and “very distressing.” Validity of the NRS is established. 14 – 16
The BIA measured resistance and reactance (Quantum II; RJL Systems, San Diego, CA) as the basis for calculating TBW (liter) 17 and hydration status (hypovolemia, normovolemia, or hypervolemia).18 The BIA accurately measures water in the fluid compartments19,20 and volume status is related to thirst.7 Resistance and reactance accuracy of the Quantum II is ±1.0 Ω (Quantum II Manual). Patients' weight and height were measured (tape measure or knee-height calipers) 21 to calculate body mass index (BMI; normal, overweight, or obese).
The research nurse abstracted demographic, treatment-related, and biological data from patients' medical records for the day of enrollment (7 am until 6:59 am the next day). Demographic and health variables were age (years; ≤65 or >65), gender (male/female), race/ethnicity (white, African-American, Asian, other, or Hispanic), total days in ICU, whether the patient died in ICU (yes/no), primary diagnosis at ICU admission (neurological, cardiovascular, respiratory, gastrointestinal [GI], or other [infection, organ failure, or cancer]), and severity of illness (Acute Physiology and Chronic Health Evaluation II [APACHE II]).22–24
Treatment-related variables included oral care (yes/ no; none, minimal, or standard), which was recorded because of the potential effect on reducing thirst by stimulating oropharyngeal osmoreceptors. 25 Sources of fluid intake (specifically the presence of a nil per os [NPO] order [yes/no], oral intake of fluid over the enrollment day [volume in milliliters (mL)], and fluid balance [intake – output/100 mL]) also were recorded because of their known effect on thirst.2 Medications that might affect fluid balance or thirst and their doses were documented and classified, that is, opioids (later translated into morphine equivalents, yes/no; mean 24 hour opioid dose; none, ≤50 mg, or >50 mg); diuretics, serotonin reuptake inhibitors (SSRIs); antihypertensive medications; steroids; and proton pump inhibitors. Of the diuretics, only furosemide was retained in later analyses (yes/no; none, ≤30 mg, 31 – 60 mg, or >60 mg). Mechanical ventilation at enrollment (yes/no) was another treatment-related variable.
In addition to TBW and BMI, the biological variables recorded were electrolytes (sodium, potassium, and ionized calcium), blood urea nitrogen (BUN), and glucose to calculate plasma osmolality.26 Serum osmolality was calculated using the formula (2 [Na + K]) + (BUN/2.8) + (glucose/18). Creatinine was recorded as a measure of renal function.
Statistical Analysis
Hypothesis 1 (thirst presence) was tested using the patients divided into thirst and no-thirst groups. Hypotheses 2 (thirst intensity) and 3 (thirst distress) were tested within the thirst group. All hypothesis testing was two sided.
All data were de-identified and double entered into IBM Statistical Package for the Social Sciences (SPSS) for Windows® Version 22 (IBM Corp; Armonk, NY).27 Data were cleaned, files compared with SPSS Stats Builder, and descriptive statistics calculated.
Identifying Predictors of Thirst Presence
To test the association between demographic, treatment-related, and biological variables and thirst presence, a bivariate association was assessed with each of the variables, using point biserial correlations for continuous measures and phi coefficients for dichotomous measures. Variables that correlated with thirst presence (alpha = 0.05) were then entered into a multiple logistic regression model.28 To build the exploratory models, the selected variables in the model were entered jointly and removed one at a time, least significant first, until all predictors were significant with alphas = 0.05, assuming the model itself was significant with alpha = 0.05.28,29
Identifying Predictors of Thirst Intensity
To test the association between demographic, treatment-related, and biological variables and thirst intensity, truncated regression analysis was performed. 30,31 Truncated regression is necessary to correct the expected error distribution over the restricted range, when a portion of the observed distribution is excluded from the regression analysis (i.e., scores of 1 or 2). This hypothesis was tested with alpha = 0.05 (two-sided) for the model, and predictors were retained if significant in the model at alpha = 0.05. Data were analyzed with Stata/SE for Windows® Release 13 (StataCorp LP; College Station, TX), 32 using the “truncreg” program. Predictors not meeting the criterion were removed, one at a time, until all predictors remaining in the model were significant at 0.05.28
Identifying Predictors of Thirst Distress
To test the association between demographic, treatment-related, and biological variables and thirst distress, truncated regression analysis was used as it was for the examination of thirst intensity.
Results
Of 1181 eligible ICU patients, 252 were in the thirst group and 101 in the no-thirst group (Fig. 1). The mean age of the entire sample was 55.7 years (standard deviation [SD] = 14.5). Most participants were white and male; the most frequent primary diagnosis was neurological. The mean thirst intensity score in the thirst group was 6.67 (SD = 2.03) and the mean thirst distress score was 6.35 (SD = 2.32).
Fig. 1.
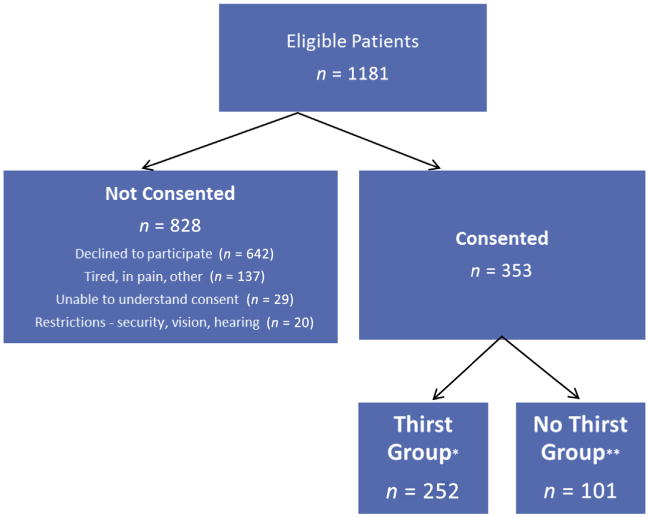
Flow diagram of screening and consent. *Thirst group: Thirst intensity and/or distress score of three or higher on numeric rating scale. **No-thirst group: No thirst.
Hypothesis 1: Thirst Presence
Bivariate analysis (Table 1) showed that thirst presence was significantly related to higher APACHE II scores, more frequent NPO orders, not receiving oral fluid, a higher percent of patients receiving opioids, higher daily doses of opioids, high doses of furosemide, receiving SSRIs, and lower levels of ionized calcium. Further exploration of the presence of an NPO order showed that some patients who were NPO received oral fluids; thus, this variable was omitted from further analysis. Also, medical diagnostic categories differed between the thirst and no-thirst groups (P = 0.016); however, the difference was not significant when further explored with paired post hoc analyses.
Table 1. Comparison of Demographic, Treatment-Related, and Biological Variables in the Thirst and No-Thirst Groups.
| Variables | Thirst Group (N = 252), n (%) or Mean ± SD, (n) | No-Thirst Group (N = 101), n (%) or Mean ± SD, (n) | P-valuea |
|---|---|---|---|
| Demographic variables | |||
| Age (yrs) | 55.0 ± 14.4 (252) | 57.4 ± 14.5 (101) | 0.162 |
| Gender | |||
| Male | 138 (54.8) | 55 (54.5) | 0.958 |
| Female | 114 (45.2) | 46 (45.5) | |
| Race | |||
| White (n = 237) | 168 (66.7) | 69 (68.3) | 0.734 |
| African American (n = 32) | 25 (9.9) | 7 (6.9) | |
| Asian (n = 25) | 16 (6.3) | 9 (8.9) | |
| Other (n = 59) | 43 (17.1) | 16 (15.8) | |
| Hispanic (n = 59) | 40 (16.1) | 19 (18.8) | 0.535 |
| APACHE II (n = 353) | 20.4 ±8. 1 (252) | 18.4 ± 7.1 (101) | 0.030 |
| Total ICU days (n = 353) | 9.5 ± 11.1 (252) | 7.3 ± 5.3 (101) | 0.056 |
| Died in ICU (n = 10) | 8 (3.2) | 2 (2) | 0.779 |
| Medical diagnostic category | |||
| Neurological (n = 102) | 62 (24.6) | 40 (39.6) | 0.016 |
| Cardiovascular (n = 85) | 58 (23.0) | 27 (26.7) | |
| Respiratory (n = 61) | 46 (18.3) | 15 (14.9) | |
| Gastrointestinal (n = 57) | 47 (18.7) | 10 (9.9) | |
| Other (n = 48) | 39 (15.5) | 9 (8.9) | |
| Treatment-related variables | |||
| Oral care documented | |||
| No (n = 89) | 64 (25.4) | 25 (24.8) | 0.259 |
| Yes (n = 264) | 188 (74.6) | 76 (75.2) | |
| NPO order | |||
| No (n = 267) | 181 (71.8) | 86 (85.1) | 0.008 |
| Yes (n = 86) | 71 (28.2) | 159 (14.9) | |
| Oral intake | |||
| No (n = 66) | 54 (21.4) | 12 (11.9) | 0.038 |
| Yes (n = 287) | 198 (78.6) | 89 (88.1) | |
| Fluid deficit/excess (100 cc) | −2.6 ± 18.6 (252) | − 1.3 ± 12.3 (101) | 0.510 |
| Hydration status (n = 302) | |||
| Hypovolemic (n = 45) | 28 (13.7) | 17 (17.3) | 0.620 |
| Normovolemic (n = 211) | 143 (70.1) | 68 (69.4) | |
| Hypervolemic (n = 46) | 33 (16.2) | 13 (13.3) | |
| Opioids (n = 237) | 183 (72.6) | 54 (53.5) | <0.001 |
| Morphine equivalent opioids 24 hour dose (mg) | 51.5 ± 116 (252) | 20.3 ± 5.9 (101) | 0.079 |
| Morphine equivalent opioids 24 hour (n = 353) | |||
| None (n = 116) | 69 (27.4) | 47 (46.5) | <0.001 |
| Low dose, ≤50 mg (n = 174) | 129 (21.2) | 45 (44.6) | |
| High dose, >50 mg (n = 63) | 54 (21.4) | 9 (8.9) | |
| Diuretics (n = 115) | 87 (34.5) | 28 (27.7) | 0.219 |
| Furosemide (n = 353) | |||
| None (n = 273) | 187 (74.2) | 86 (85.1) | 0.032 |
| Low dose, 1–30 mg (n = 23) | 17 (6.7) | 6 (5.9) | |
| Moderate dose, 31–60 mg (n = 35) | 31 (12.3) | 4 (4.0) | |
| High dose, >60 mg (n = 22) | 17 (6.7) | 5 (5.0) | |
| Selective serotonin reuptake inhibitors (n = 48) | 40 (15.9) | 8 (7.9) | 0.049 |
| Antihypertensives (n = 151) | 105 (41.7) | 46 (45.5) | 0.507 |
| Steroids (n = 91) | 58 (32.7) | 33 (23.0) | 0.061 |
| Proton pump inhibitor (n = 259) | 189 (75.0) | 70 (69.3) | 0.275 |
| Mechanical ventilation (n = 17) | 15 (6.0) | 2 (2.0) | 0.116 |
| Biologic variables | |||
| Body mass index (BMI) (n = 332) | 30.2 ± 7.9 (234) | 30.1 ± 8.1 (98) | 0.886 |
| Body mass index (n = 327) | |||
| Normal (n = 90) | 62 (26.8) | 28 (29.2) | 0.844 |
| Overweight (n = 97) | 70 (30.3) | 27 (28.1) | |
| Obese/morbidly obese (n = 140) | 99 (42.9) | 41 (42.7) | |
| Total body water (n = 302) | 46.8 ± 17.2 (204) | 44.8 ± 11.24 (98) | 0.440 |
| Plasma osmolality, mmol/kg (n = 337) | 297.3 ± 11.5 | 295.0 ± 10.7 | 0.092 |
| Sodium, mmol/L (n = 337) | 136.7 ± 4.0 | 136.4 ± 3.9 | 0.558 |
| Potassium, mg/dL (n = 337) | 4.0 ± 0.47 | 4.0 ± 0.4 | .360 |
| Ionized calcium, mmol/L (n = 296) | 1.16 ± 0.1 | 1.19 ± 0.07 | 0.006 |
| Glucose, mg/dL (n = 337) | 135 ± 58 | 127 ± 33 | 0.234 |
| BUN, mg/dL (n = 337) | 23.5 ± 19.8 | 19.5 ± 17.5 | 0.087 |
| Creatinine, mg/dL (n = 296) | 1.3 ± 1.0 | 1.21 ± 1.6 | 0.557 |
APACHE = Acute Physiology and Chronic Health Evaluation II; ICU = intensive care unit; NPO = nil per os; BUN = blood urea nitrogen.
Bold items in this column are statistically significant.
A bivariate analysis was performed to explore the relationship of thirst presence and TBW, BMI, hydration status (hypovolemic, normovolemic, or hypervolemic), and electrolyte values (Table 1). None of those relationships was significant. Further exploration of the impact of these measures on thirst presence was conditioned on gender and BMI, but regression analysis yielded no significant interaction between TBW and gender (P = 0.32) or BMI (P = 0.34) or between hydration status and thirst (P = 0.34), even when we controlled for age (P = 0.67).
Finally, a multiple logistic regression analysis was performed on the significant thirst-associated variables. The final model showed that the significant predictors of thirst presence were a higher opioid dose, higher furosemide dose, SSRIs, and lower ionized calcium level (Table 2). For each 50 mg increase in opioids (none, ≤50 mg, or >50 mg), the patient was 1.26 times more likely to be thirsty. For each 30 mg increase in furosemide (none, ≤30 mg, 31–60 mg, or >60 mg), the patient was 1.4 times more likely to be thirsty. Logistic regression analyses also estimated that, with a 0.1 decrease in ionized calcium, patients were 35.4% more likely to experience thirst. Predicted probabilities of thirst presence from the final model correlated with thirst presence (r = 0.306) and predicted 9.4% of the variance in the presence of thirst.
Table 2. Predictors of Thirst Presencea.
| 95% Confidence Interval | |||||
|---|---|---|---|---|---|
|
|
|||||
| Variables | Wald Chi-Square | P-value | Odds Ratio | Lower | Upper |
| Serotonin reuptake inhibitors | 3.899 | 0.048 | 2.635 | 1.007 | 6.892 |
| Higher dose of opioids in morphine equivalents | 11.814 | 0.001 | 2.002 | 1.348 | 2.975 |
| Higher dose of furosemide | 4.287 | 0.038 | 1.394 | 1.018 | 1.909 |
| Lower ionized calcium level | 7.141 | 0.008 | 0.010 | 0.001 | 0.295 |
| Constant | 7.423 | 0.006 | 257.724 | ||
Findings from logistic regression analysis.
Hypothesis 2: Thirst Intensity
Variables that met the preset criteria were entered into the truncated regression analysis, specifically, medical diagnosis, mechanical ventilation, higher serum sodium, and oral fluids (yes/no). Only medical diagnosis and not taking oral fluids were significant predictors of thirst intensity in the final model (Table 3). Regression analysis showed that, when other variables were controlled for, taking oral fluids reduced thirst intensity by 1.7 points, and being in the GI diagnosis group increased thirst intensity by 1.5 points compared with the reference group (neurological).
Table 3. Predictors of Thirst Intensitya.
| 95% Confidence Interval | ||||||
|---|---|---|---|---|---|---|
|
|
||||||
| Variables | Coefficient | SE | Z | P-value | Lower | Upper |
| Taking oral fluids | −1.656 | 0.385 | −4.29 | 0.001 | −2.412 | −0.899 |
| Medical diagnostic group | 11.59b | 0.020 | ||||
| Constant | 5.625 | 0.350 | 16.07 | 0.001 | 4.939 | 6.311 |
GI = gastrointestinal.
Analyzed with truncated multiple regression.
Wald Chi-square = 17.27, P < 0.0017. Post hoc Sidak-adjusted pairwise comparisons found that the difference between the neurologic and GI groups was significant, coefficient = 1.47 higher for GI (95% CI = 0.53–2.40).
Exploratory truncated regressions were completed to determine whether thirst intensity scores were associated with theoretically plausible interactions between diagnosis (GI, neurological, and “other”), age (<65 or≤65), fluid balance (low or normal), hydration status (hypovolemic, normovolemic, or hypervolemic), plasma osmolality, sodium level (low or normal), and glucose level (normal, high, or very high). No statistically significant interaction was identified.
Hypothesis 3: Thirst Distress
Variables that met the preset criteria were entered into the truncated regression analysis for thirst distress (mechanical ventilation, negative fluid balance, taking oral fluid, serum glucose level, plasma osmolality, APACHE II score, and antihypertensive medications). Thirst distress in the final model was predicted by mechanical ventilation, negative fluid balance, antihypertensive medications, and a GI or “other” diagnosis (Table 4). Thirst patients were in negative fluid balance by an average of about 260 cc; however, the SD was large (1860 cc).
Table 4. Predictors of Thirst Distressa.
| 95% Confidence Interval | ||||||
|---|---|---|---|---|---|---|
|
|
||||||
| Variable | Coefficient | SE | Z | P-value | Lower | Upper |
| Mechanical ventilation | 2.379 | 0.972 | 2.45 | 0.014 | 0.463 | 4.286 |
| Fluid balance | 0.0268 | 0.013 | 2.03 | 0.043 | 0.001 | 0.052 |
| Antihypertensive medications | 1.805 | 0.560 | 3.22 | 0.001 | 0.707 | 2.904 |
| Diagnostic group | 16.28b | 0.003 | ||||
| Constant | 2.759 | 0.876 | 3.15 | 0.002 | 1.04 | 4.476 |
GI = gastrointestinal.
Analyzed with truncated multiple regression.
Wald Chi-square = 14.58, P = 0.0057. Post hoc Sidak-adjusted pairwise comparisons found that the difference between the neurologic and GI groups was significant, coefficient = 3.02 higher for GI (95% CI = 1.32– 4.70), and the difference between the neurologic and “other” groups was significant, coefficient = 2.70 higher for “other” (95% CI = 0.97–4.43).
Regression analysis showed that when controlling for the other variables in the model, being in the GI diagnosis group increased thirst distress scores by three points when compared with the reference group. Thus, for a patient with average thirst distress, being in the GI group would raise average thirst distress from 6.4 to 8.8. Being in the “other diagnoses” group would increase thirst distress by 2.7 points, raising the average score to 9.4. Although our sample of ventilated patients was small, mechanical ventilation increased thirst distress by 2.4 points, raising the mean distress score to 8.8. Antihypertensive medications increased distress by 1.8 points. Fluid balance, although statistically significant, had little effect on thirst distress scores; that is, distress increased only 0.03 points for each 100 cc of fluid deficit; thus, a 1 L fluid deficit would increase thirst distress by only 0.3 points.
Exploratory truncated logistic regressions showed no interaction on thirst distress scores between diagnosis and the same variables as used for the follow-up analysis for thirst intensity. Finally, we explored the possibility that multicollinearity among the predictors might have influenced the selection of predictors that remained in the final models. We examined multicollinearity among predictors for both thirst intensity and thirst distress by computing the variance inflation factor (VIF) for each predictor. No VIF was worrisome using the criterion by Fox33 (square root of VIF > 2 – 2.5). We found no pattern that indicated that the VIF level was associated with significance or nonsignificance of predictors examined in the multivariable models.
Discussion
This is the first study to use multivariable analyses to examine demographic, treatment-related, and biological predictors of thirst presence, intensity, and distress in ICU patients. Thirst presence was predicted by high doses of opioids and furosemide, SSRIs, and lower ionized calcium. Thirst intensity was predicted by not taking oral fluids and having a GI diagnosis. Thirst distress was predicted by a GI or “other” diagnosis, mechanical ventilation, antihypertensive medications, and negative fluid balance.
Presence of Thirst
Medications were predictors of thirst presence (i.e., furosemide, opioids, and SSRIs). Furosemide, a loop diuretic, would be expected to increase osmolality and thus thirst. Although minimal information exists about how diuretics affect thirst, consistent with our data are findings from one study showing higher furosemide use (P < 0.0001) and thirst (P < 0.001) in heart failure (HF) patients vs. non-HF patients;34 multivariate analysis was not reported.
A high daily dose of opioids was a predictor of thirst presence, which is important as opioids are often administered to ICU patients.35 Although some studies report the prevalence of thirst in ICU patients, no multivariable analyses identified opioids as a predictor of thirst. Animal research indicates that opioids function, at least in part, in the hypothalamus near the thirst center and opioids demonstrate both inhibitory36 and excitatory effects on drinking, 37,38 a proxy for thirst. Clinically, nurses identified opioids as one cause of thirst in mechanically ventilated patients.39 In contrast, Morita et al40 found that opioids were not associated with thirst in terminally ill cancer patients (n = 50, P = 0.51); opioids were associated with thirst in only two of the 16 patients with severe thirst (visual analogue scale ≥8), a finding limited by the small sample size.
Consistent with other reports, 41,42 the SSRIs were associated with thirst in our study. Although the mechanism of action is not entirely understood, the SSRIs may cause hyponatremia by altering regulation of antidiuretic hormone and possibly stimulating sodium appetite. Similarly, data in rats show that the SSRIs increase sodium appetite and drinking. The SSRIs inhibit electrical activity in the subfornical organ (SFO) found at the entrance of the third ventricle, suggesting that these medications enhance sodium intake and thirst by acting in this forebrain structure.43
Decreased ionized calcium increased thirst in our study. One explanation for this finding is provided through laboratory studies showing that calcium sensing receptors have been identified in relevant regions of the brain. The SFO has a high concentration of these receptors and has been identified as a potential contributor to central regulation of fluid and electrolyte balance.44 Recent animal studies demonstrated that the calcium-regulating glycoprotein stanninocalcin-1, which functions within the SFO, may modulate angiotensin II to regulate fluid intake.45 Also, a pediatric study that examined the effect of ionized hypocalcemia on organ dysfunction early in the ICU stay found that treatment with furosemide was associated with hypocalcemia, 46 perhaps contributing a partial explanation for our ionized calcium findings. Nonetheless, the small difference inionized calcium seen in this study is not a clinically meaningful difference; how this difference contributes to thirst in ICU patients will require further study.
One surprising finding in our study was that age was not associated with thirst presence. Prior research shows older persons have an attenuated thirst response.6 Further work in ICU patients is needed to understand why ICU patients' thirst response differs from that of community-dwelling older adults.
Thirst Intensity
Our finding that thirst intensity was higher in patients who were not taking oral fluids is consistent with physiological controls of fluid balance.2 Morita et al40 found that reduced oral intake significantly predicted thirst in cancer patients (n = 50) but was not a determinant of thirst when entered into the multivariate equation, possibly from lack of power. In addition, we had anticipated that TBW and osmolality would be important predictors of thirst intensity, yet they were not key determinants of thirst intensity in our study. A potential explanation may be found in the work of Siami et al47 who found a relative arginine-vasopressin deficiency and diminished thirst during and after septic shock. Further work is required to understand whether such a deficiency exists in other ICU patients because Siami et al47 only examined patients with septic shock.
Volume of oral fluid intake has been examined extensively in the HF population as fluid restriction is a mainstay of treatment. When liberal vs. conservative fluid intake was compared in a crossover study, the only difference was in greater thirst intensity during the conservative fluid phase.48 A recent review of thirst in HF patients showed that limited oral intake was consistently accompanied by increased thirst.49 Thus, the relationship between oral fluid intake and thirst intensity appears consistent across different populations who are in control of their intake.
A GI diagnosis also predicted increased thirst intensity in our study, similar to what was reported in terminally ill cancer patients with a GI cancer diagnosis.40 The GI group in our study had a variety of diagnoses including liver failure; GI bleeding; and complex surgical procedures, for example, liver transplant. Loss of fluids through fever, draining fistulas, and diaphoresis may have caused these patients increased thirst intensity from low blood or total body fluid volume. Yet no interaction with diagnosis was identified that would account for thirst intensity when variables frequently associated with hypovolemia and hyperosmolality were explored (fluid balance, hydration status, plasma osmolality, sodium level, and glucose level). Further research is needed to understand this phenomenon.
Thirst Distress
Thirst distress was predicted by mechanical ventilation, negative fluid balance, antihypertensive medications, and a GI or “other” diagnosis. Data have shown that 70–80% of the mechanically ventilated patients experience thirst distress, 8,9,49 and thirst was rated as one of the three most remembered experiences in mechanically ventilated patients (n = 206).50 In a study of ventilated patients (n = 150), all reported that thirst was bothersome, and 82% reported severity as moderate to extreme.51 Although our sample of ventilated patients was limited, our data confirm its importance in thirst distress and help quantify its magnitude.
As with thirst intensity, having a GI diagnosis or an “other” diagnosis (infection, organ failure, or advanced cancer) increased thirst distress. However, exploration of variables often associated with thirst distress did not provide an explanation as to why these groups differed from the reference group (neurological patients).
Thirst distress was also significantly associated with having a negative fluid balance and receiving antihypertensive medications. Given the small negative fluid balance and the large SD, fluid balance in our sample contributed little to thirst distress. Some antihypertensive medications may cause fluid loss and/or prevent fluid retention causing thirst distress.
Limitations
Our data are cross-sectional and so show associations rather than cause and effect. The sample may not reflect the nature of patients admitted to all ICUs; our sample had few mechanically ventilated patients and many patients with a high BMI. Only about 30% of the eligible patients agreed to participate, perhaps a reflection of the stress of serious illness and demands of treatment. We were unable to tightly control the time of day when the patients were recruited and so there was not a consistent time between blood draws, intake, number of treatments, and patient thirst reports. We measured study variables only at baseline.
Conclusion
Important predictors of thirst presence were high doses of furosemide and opioids, and SSRIs. The GI diagnosis was the clinically significant predictor of thirst intensity. Meaningful predictors of thirst distress were mechanical ventilation, antihypertensive medications, and having a GI or “other diagnosis.” This study confirms the need to assess multiple dimensions of thirst in the ICU setting and test interventions that address these risk factors within the context of necessary ICU care. Clinicians can use these new relevant data to reduce the discomfort and burden of thirst in critically ill patients.
Acknowledgments
This study was supported by a grant from the National Institute of Nursing Research, United States (1NR011825-03; Principal Investigator: Dr. K. Puntillo). Dr. Nelson is supported by a K07 Academic Career Leadership Award (AG034234) from the National Institute on Aging, United States.
The authors are grateful to the patients who participated in this study, and to the nurses in the intensive care units where these data were collected, for their support to the study.
Footnotes
Disclosures: The authors have no conflicts of interest.
References
- 1.Puntillo K, Nelson JE, Weissman D, et al. Palliative care in the ICU: relief of pain, dyspnea, and thirst—a report from the IPAL-ICU Advisory Board. Intensive Care Med. 2014;40:235–248. doi: 10.1007/s00134-013-3153-z. [DOI] [PMC free article] [PubMed] [Google Scholar]
- 2.Arai S, Stotts N, Puntillo K. Thirst in critically ill patients: from physiology to sensation. Am J Crit Care. 2013;22:328–335. doi: 10.4037/ajcc2013533. [DOI] [PMC free article] [PubMed] [Google Scholar]
- 3.Grandjean AC, Reimers KJ, Bannick KE, Haven MC. The effect of caffeinated, non-caffeinated, caloric and non-caloric beverages on hydration. J Am Coll Nutr. 2000;19:591–600. doi: 10.1080/07315724.2000.10718956. [DOI] [PubMed] [Google Scholar]
- 4.Kaplan LJ, Kellum JA. Fluids, pH, ions and electrolytes. Curr Opin Crit Care. 2010;16:323–331. doi: 10.1097/MCC.0b013e32833c0957. [DOI] [PubMed] [Google Scholar]
- 5.Buckley MS, Leblanc JM, Cawley MJ. Electrolyte disturbances associated with commonly prescribed medications in the intensive care unit. Crit Care Med. 2010;38(Suppl 6):S253–S264. doi: 10.1097/CCM.0b013e3181dda0be. [DOI] [PubMed] [Google Scholar]
- 6.Kenney WL, Chiu P. Influence of age on thirst and fluid intake. Med Sci Sports Exerc. 2001;33:1524–1532. doi: 10.1097/00005768-200109000-00016. [DOI] [PubMed] [Google Scholar]
- 7.Farrell MJ, Zamarripa F, Shade R, et al. Effect of aging on regional cerebral blood flow responses associated with osmotic thirst and its satiation by water drinking: a PET study. Proc Natl Acad Sci U S A. 2008;105:382–387. doi: 10.1073/pnas.0710572105. [DOI] [PMC free article] [PubMed] [Google Scholar]
- 8.Nelson JE, Meier DE, Litke A, et al. The symptom burden of chronic critical illness. Crit Care Med. 2004;32:1527–1534. doi: 10.1097/01.ccm.0000129485.08835.5a. [DOI] [PubMed] [Google Scholar]
- 9.Nelson JE, Meier DE, Oei EJ, et al. Self-reported symptom experience of critically ill cancer patients receiving intensive care. Crit Care Med. 2001;29:277–282. doi: 10.1097/00003246-200102000-00010. [DOI] [PubMed] [Google Scholar]
- 10.Puntillo KA, Arai S, Cohen NH, et al. Symptoms experienced by intensive care unit patients at high risk of dying. Crit Care Med. 2010;38:2155–2160. doi: 10.1097/CCM.0b013e3181f267ee. [DOI] [PMC free article] [PubMed] [Google Scholar]
- 11.Li DT, Puntillo K. A pilot study on coexisting symptoms in intensive care patients. Appl Nurs Res. 2006;19:216–219. doi: 10.1016/j.apnr.2006.01.003. [DOI] [PubMed] [Google Scholar]
- 12.Puntillo K, Arai SR, Cooper BA, Stotts NA, Nelson JE. A randomized clinical trial of an intervention to relieve thirst and dry mouth in intensive care unit patients. Intensive Care Med. 2014;40:1295–1302. doi: 10.1007/s00134-014-3339-z. [DOI] [PMC free article] [PubMed] [Google Scholar]
- 13.Robinson BR, Berube M, Barr J, Riker R, Gélinas C. Psychometric analysis of subjective sedation scales in critically ill adults. Crit Care Med. 2013;41(9 Suppl 1):S16–S29. doi: 10.1097/CCM.0b013e3182a16879. [DOI] [PubMed] [Google Scholar]
- 14.Downie WW, Leatham PA, Rhind VM, et al. Studies with pain rating scales. Ann Rheum Dis. 1978;37:378–381. doi: 10.1136/ard.37.4.378. [DOI] [PMC free article] [PubMed] [Google Scholar]
- 15.Reading AE. A comparison of pain rating scales. J Psychosom Res. 1980;24:119–124. doi: 10.1016/0022-3999(80)90032-x. [DOI] [PubMed] [Google Scholar]
- 16.Jensen MP, Karoly P, Braver S. The measurement of clinical pain intensity: a comparison of six methods. Pain. 1986;27:117–126. doi: 10.1016/0304-3959(86)90228-9. [DOI] [PubMed] [Google Scholar]
- 17.Kotler DP, Burastero S, Wang J, Pierson RN., Jr Prediction of body cell mass, fat-free mass, and total body water with bioelectrical impedance analysis: effects of race, sex, and disease. Am J Clin Nutr. 1996;64(Suppl 3):489S–497S. doi: 10.1093/ajcn/64.3.489S. [DOI] [PubMed] [Google Scholar]
- 18.Valle R, Aspromonte N, Milani L, et al. Optimizing fluid management in patients with acute decompensated heart failure (ADHF): the emerging role of combined measurement of body hydration status and brain natriuretic peptide (BNP) levels. Heart Fail Rev. 2011;16:519–529. doi: 10.1007/s10741-011-9244-4. [DOI] [PMC free article] [PubMed] [Google Scholar]
- 19.Chertow GM, Lu ZJ, Xu X, et al. Self-reported symptoms in patients on hemodialysis with moderate to severe secondary hyperparathyroidism receiving combined therapy with cinacalcet and low-dose vitamin D sterols. Hemodial Int. 2012;16:188–197. doi: 10.1111/j.1542-4758.2011.00642.x. [DOI] [PubMed] [Google Scholar]
- 20.Yamaguchi H, Yamauchi H, Hazama S, Hamamoto H. Evaluation of body fluid status after cardiac surgery using bioelectrical impedance analysis. J Cardiovasc Surg (Torino) 2000;41:559–566. [PubMed] [Google Scholar]
- 21.Chumlea WC, Guo SS, Wholihan K, et al. Stature prediction equations for elderly non-Hispanic white, non-Hispanic black, and Mexican-American persons developed from NHANES III data. J Am Diet Assoc. 1998;98:137–142. doi: 10.1016/S0002-8223(98)00036-4. [DOI] [PubMed] [Google Scholar]
- 22.Knaus WA, Draper EA, Wagner DP, Zimmerman JE. APACHE II: a severity of disease classification system. Crit Care Med. 1985;13:818–829. [PubMed] [Google Scholar]
- 23.Knaus W, Wagner D, Draper E. APACHE III study design: analytic plan for evaluation of severity and outcome in intensive care unit patients. Implications. Crit Care Med. 1989;17:S219–S221. [PubMed] [Google Scholar]
- 24.Damiano AM, Bergner M, Draper EA, Knaus WA, Wagner DP. Reliability of a measure of severity of illness: acute physiology of chronic health evaluation–II. J Clin Epidemiol. 1992;45:93–101. doi: 10.1016/0895-4356(92)90001-4. [DOI] [PubMed] [Google Scholar]
- 25.Figaro MK, Mack GW. Regulation of fluid intake in dehydrated humans: role of oropharyngeal stimulation. Am J Physiol. 1997;272:R1740–R1746. doi: 10.1152/ajpregu.1997.272.6.R1740. [DOI] [PubMed] [Google Scholar]
- 26.Rasouli M, Kalantari KR. Comparison of methods for calculating serum osmolality: multivariate linear regression analysis. Clin Chem Lab Med. 2005;43:635–640. doi: 10.1515/CCLM.2005.109. [DOI] [PubMed] [Google Scholar]
- 27.SPSS. IBM SPSS statistics for Windows. Armonk, NY: IBM, Corp.; 2013. [Google Scholar]
- 28.Hosmer DW, Lemeshow S. Applied logistic regression. 2nd. New York: Wiley; 2000. [Google Scholar]
- 29.Afifi AA, Clark VA, May S. Computer-aided multivariate analysis. 4th. Boca Raton, FL: Chapman & Hall/CRC; 2003. [Google Scholar]
- 30.Breen R. Regression models: Censored, sample-selected, or truncated data. Thousand Oaks, CA: Sage Publications, Inc.; 1996. [Google Scholar]
- 31.Hardin JW, Hilbe JM. Generalized linear models and extensions. 3rd. College Station, TX: Stata Press; 2012. [Google Scholar]
- 32.StataCorp LP. Stata statistical software, release 12. College Station, TX: StataCorp LP; 2011. [Google Scholar]
- 33.Fox J. Sage University Paper series on Quantitative Applications in the Social Sciences 07–079. Thousand Oaks, CA: Sage Publications; 1991. Regression diagnostics: An introduction. [Google Scholar]
- 34.Waldréus N, Sjöstrand F, Hahn RG. Thirst in the elderly with and without heart failure. Arch Gerontol Geriatr. 2011;53:174–178. doi: 10.1016/j.archger.2010.10.003. [DOI] [PubMed] [Google Scholar]
- 35.Barr J, Fraser GL, Puntillo K, et al. Clinical practice guidelines for the management of pain, agitation, and delirium in adult patients in the intensive care unit. Crit Care Med. 2013;1:263–306. doi: 10.1097/CCM.0b013e3182783b72. [DOI] [PubMed] [Google Scholar]
- 36.Spencer RL, Deupree D, Hsiao S, et al. Centrally-administered opioid selective agonists inhibit drinking in the rat. Pharmacol Biochem Behav. 1986;25:77–82. doi: 10.1016/0091-3057(86)90233-9. [DOI] [PubMed] [Google Scholar]
- 37.Sanger DJ, McCarthy PS. Increased food and water intake produced in rats by opiate receptor agonists. Psychopharmacology (Berl) 1981;74:217–220. doi: 10.1007/BF00427097. [DOI] [PubMed] [Google Scholar]
- 38.Turkish S, Cooper SJ. Effects of a kappa receptor agonist, ethylketocyclazocine, on water consumption in waterdeprived and nondeprived rats in diurnal and nocturnal tests. Pharmacol Biochem Behav. 1984;21:47–51. doi: 10.1016/0091-3057(84)90129-1. [DOI] [PubMed] [Google Scholar]
- 39.Landström M, Rehn IM, Frisman GH. Perceptions of registered and enrolled nurses on thirst in mechanically ventilated adult patients in intensive care units—a phenomenographic study. Intensive Crit Care Nurs. 2009;25:133–139. doi: 10.1016/j.iccn.2009.03.001. [DOI] [PubMed] [Google Scholar]
- 40.Morita T, Tei Y, Tsunoda J, et al. Determinants of the sensation of thirst in terminally ill cancer patients. Support Care Cancer. 2001;9:177–186. doi: 10.1007/s005200000205. [DOI] [PubMed] [Google Scholar]
- 41.Liu BA, Mittmann N, Knowles SR, Shear NH. Hyponatremia and the syndrome of inappropriate secretion of antidiuretic hormone associated with the use of selective serotonin reuptake inhibitors: a review of spontaneous reports. CMAJ. 1996;155:519–527. [PMC free article] [PubMed] [Google Scholar]
- 42.Jacob S, Spinler SA. Hyponatremia associated with selective serotonin-reuptake inhibitors in older adults. Ann Pharmacother. 2006;40:1618–1622. doi: 10.1345/aph.1G293. [DOI] [PubMed] [Google Scholar]
- 43.de Magalhães-Nunes AP, Badauâ-Passos D, Jr, Ventura RR, et al. Sertraline, a selective serotonin reuptake inhibitor, affects thirst, salt appetite and plasma levels of oxytocin and vasopressin in rats. Exp Physiol. 2007;92:913–922. doi: 10.1113/expphysiol.2007.037358. [DOI] [PubMed] [Google Scholar]
- 44.Yano S, Brown EM, Chattopadhyay N. Calcium-sensing receptor in the brain. Cell Calcium. 2004;35:257–264. doi: 10.1016/j.ceca.2003.10.008. [DOI] [PubMed] [Google Scholar]
- 45.Moreau JM, Iqbal W, Turner JK, et al. Stanniocalcin-1 in the subfornical organ inhibits the dipsogenic response to angiotensin II. Am J Physiol Regul Integr Comp Physiol. 2012;303:R921–R928. doi: 10.1152/ajpregu.00057.2012. [DOI] [PubMed] [Google Scholar]
- 46.Dias CR, Leite HP, Nogueira PC, Brunow de Carvalho W. Ionized hypocalcemia is an early event and is associated with organ dysfunction in children admitted to the intensive care unit. J Crit Care. 2013;28:810–815. doi: 10.1016/j.jcrc.2013.03.019. [DOI] [PubMed] [Google Scholar]
- 47.Siami S, Polito A, Porcher R, et al. Thirst perception and osmoregulation of vasopressin secretion are altered during recovery from septic shock. PLoS One. 2013;8:e80190. doi: 10.1371/journal.pone.0080190. [DOI] [PMC free article] [PubMed] [Google Scholar]
- 48.Holst M, Strömberg A, Lindholm M, Willenheimer R. Description of self-reported fluid intake and its effects on body weight, symptoms, quality of life and physical capacity in patients with stable chronic heart failure. J Clin Nurs. 2008;17:2318–2326. doi: 10.1111/j.1365-2702.2008.02295.x. [DOI] [PubMed] [Google Scholar]
- 49.Waldréus N, Hahn RG, Jaarsma T. Thirst in heart failure: a systematic literature review. Eur J Heart Fail. 2013;15:141–149. doi: 10.1093/eurjhf/hfs174. [DOI] [PubMed] [Google Scholar]
- 50.Samuelson KA, Lundberg D, Fridlund B. Stressful experiences in relation to depth of sedation in mechanically ventilated patients. Nurs Crit Care. 2007;12:93–104. doi: 10.1111/j.1478-5153.2006.00199.x. [DOI] [PubMed] [Google Scholar]
- 51.Rotondi AJ, Chelluri L, Sirio C, et al. Patients' recollections of stressful experiences while receiving prolonged mechanical ventilation in an intensive care unit. Crit Care Med. 2002;30:746–752. doi: 10.1097/00003246-200204000-00004. [DOI] [PubMed] [Google Scholar]