

Abstract

The development of high-resolution liquid chromatography (LC) is essential for improving the sensitivity and throughput of mass spectrometry (MS)-based proteomics. Here we present systematic optimization of a long gradient LC–MS/MS platform to enhance protein identification from a complex mixture. The platform employed an in-house fabricated, reverse-phase long column (100 μm × 150 cm, 5 μm C18 beads) coupled to Q Exactive MS. The column was capable of achieving a peak capacity of ∼700 in a 720 min gradient of 10–45% acetonitrile. The optimal loading level was ∼6 μg of peptides, although the column allowed loading as many as 20 μg. Gas-phase fractionation of peptide ions further increased the number of peptide identification by ∼10%. Moreover, the combination of basic pH LC prefractionation with the long gradient LC–MS/MS platform enabled the identification of 96 127 peptides and 10 544 proteins at 1% protein false discovery rate in a post-mortem brain sample of Alzheimer’s disease. Because deep RNA sequencing of the same specimen suggested that ∼16 000 genes were expressed, the current analysis covered more than 60% of the expressed proteome. Further improvement strategies of the LC/LC–MS/MS platform were also discussed.
Keywords: long LC column, mass spectrometry, AD proteome
Introduction
In the post-genomic era, next-generation sequencing technology is now widely used to characterize the alterations of genome and transcriptome in the context of human diseases.1 Although gene expression can be analyzed by transcriptomic profiling, transcriptomic data do not always correlate well with protein expression in biological samples and often lack the information on protein posttranslational modifications. Thus, the development of proteomics platforms for deep proteome coverage becomes an urgent task to provide systematic and comparable protein expression information complementary to DNA and RNA data.
Mass spectrometry (MS)-based shotgun proteomics is predominantly used for complex proteome analysis.2,3 In a typical shotgun experiment, complex protein samples extracted from cells or tissues are digested with protease(s), and the resulting peptide mixtures are fractionated by organic gradient on HPLC columns, followed by tandem mass spectrometry analysis. The MS/MS spectra are then searched against protein database for the identification of proteins and posttranslational modifications. With the advent of high-resolution MS and the improvement of liquid chromatography (LC) performance, the current platform of shotgun proteomics can routinely identify thousands of proteins in mammalian cells in a single LC–MS/MS analysis. One of the key measurements of LC performance is the peak capacity that is defined as the number of peaks separated within a resolution of unity in a given LC gradient time.4 Peak capacity is estimated to be proportional to the root square of LC column length and inversely proportional to the root square of LC particle size.5 Several reports demonstrated the benefits of small particles (<2 μm) with ultrahigh pressure solvent delivery (up to 70 000 psi).6−9 High values of peak capacities were obtained on these columns (i.e., 75 μm × 50 cm) depending on the gradient length.9−15 However, column heating and ultrahigh system pressure (>10 000 psi) are usually required for running long columns packed with sub-2 μm beads, compromising the robustness of the system. Alternatively, when HPLC time is not a limiting factor, longer LC columns improve resolving power but with a higher backpressure. For instance, several reports have shown comparable peak capacity using 5 μm C18 particles and up to 1 m long column within regular HPLC pressure limit.16,17 When long LC was coupled to Q Exactive MS, it resulted in more than 4000 identified proteins in the human proteome under optimized conditions.15,18 However, because of the large (>107) dynamic range of proteins in mammalian cells, additional prefractionation step(s) (e.g., SDS-PAGE, strong anion exchange (SAX), strong cation exchange (SCX), basic pH LC and isofocusing) were applied to reduce peptide complexity and deepen the mammalian proteomic analysis.19−23 Further peptide separation was also achieved through gas-phase fractionation (GPF) through MS1 ion selection on mass spectrometer.24,25
To date, a few studies lead to the detection of more than 10 000 proteins in several human cancer cell lines using SAX fractionation and analysis on LTQ Orbitrap Velos MS and about a month of instrument time.26,27 The Marto group identified 11 352 mouse genes-derived proteins using LTQ XL MS and Triple TOF 5600 MS in 8 days from murine embryonic stem cells.23 Lehtio group reported the identification of 13 078 human proteins and 10 637 mouse proteins from cancer cell lines using high-resolution isofocusing fractionation and LTQ Orbitrap Velos MS with ∼15 days of instrument time.18,22 While we were preparing this manuscript, Mann’s group reported the identification of ∼10 000 proteins on Q Exactive MS using 4 day instrument time and long column coupled to UPLC system.28 Most recently, drafts of the entire human proteome (identifications of ∼18 000 genes products in varieties of human tissues and hematopoietic cells) were completed from ∼2000 LC–MS/MS runs using several months of MS instrument time by two research groups.29,30
Although significant progress has been achieved to identify deep mammalian proteome, there is no systematic report on the adjustment of parameters for ultralong LC–MS/MS runs to optimize protein identification on a genome wide scale. To obtain an in-depth coverage of mammalian proteome, we determined to further optimize key steps in the LC–MS/MS platform, following our previous optimization work using a regular short column (75 μm × 12 cm).31 In this study, we described a stepwise analysis to tune shotgun proteomics parameters using an in-house manufactured 150 cm LC column coupled to Q Exactive MS. The optimization process consisted of more than 30 LC–MS/MS runs of analyzing mammalian tissue (e.g., rat brain). Finally, we used the optimized LC/LC–MS/MS platform to process a human brain specimen of Alzheimer’s disease (AD) and identified more than 10 000 proteins, covering more than 60% of the expressed proteome.
Experimental Procedures
Construction of 100 μm × 150 cm Analytical Columns
The capillary column of 150 cm in length and 100 μm inner diameter (ID) was packed in-house following the previously reported protocol with modifications.17 This column consisted of two segments, namely, one 110 cm long blunt end-capillary column and one 40 cm long capillary column with a 15 μm opening tip. To make the blunt end column, we dipped 100 μm ID fused silica tubing into the activated silicate solution (Next Advance, NY), briefly followed by heating to 100 °C on a heater plate for 1 min before the ejection of excess silicate solution. Then, the frit was further heated for another hour at 100 °C and cut to 2 mm in length. The capillary tubing was washed with methanol thoroughly. The blunt end column was then packed with slurry of Magic C18 AQ 200 beads (5 μm) at a concentration of 30 mg/mL in methanol. A bed length of 110 cm was obtained after 6 h of continuous packing at 2800 psi using a Pressure Injection Cell system (Next Advance, NY). The second segment of capillary column was packed similarly to 40 cm in length using Self-Pack PicoFrit column (New Objective, 15 μm tip opening, 100 μm ID, cat no. PF360-100-N-5). Finally, two columns were connected through a metal union with zero dead volume (Upchurch Scientific, NY).
Protein Extraction and Digestion from the Rat Brain and AD Brain
Human tissues of prefrontal cortical regions were provided by the Brain and Body Donation Program at Banner Sun Health Research Institute. The AD case with short post-mortem interval (<3 h) was clinically and pathologically characterized in accordance with established criteria.32 This study was approved by Banner Sun Health Research Institute. Adult rat brains were purchased from Pel Freez Biologicals, and rat brain peptides were prepared as previously described.33 The cerebral cortex of AD brain was homogenized in 100 μL of lysis buffer (0.1 M Tris, pH 8.5, 8 M urea, 0.15% sodium deoxycholate) at 4 °C using 0.5 mm glass beads for 5 min in a Bullet Blender instrument (Next Advance).34,35 The entire cell lysate without clarification of the insoluble materials was digested with Lys-C (Wako, 200:1 by weight) at room temperature for 0.5 h in the lysis buffer, followed by trypsin digestion (Promega, 200:1 by weight) in 2 M urea, 0.1 M Tris-HCl, pH 8.5 at room temperature overnight. The peptides were then acidified with 0.15% TFA, precleared by centrifugation, desalted with Sep-Pak C18 SPE column (Waters), and eluted with 40% acetonitrile (ACN) plus 0.1%TFA. The eluent was dried and stored at −80 °C for further usage.15 Protein quantification was carried out by short SDS-gel-based staining and BCA method.31
Basic pH LC Fractionation of Peptides
The desalted peptides from AD brain were resuspended in 10 mM ammonium formate pH 8 at a concentration of 10 mg/mL. Basic pH HPLC was performed on a 4.6 mm × 250 mm Xbridge C18 column (Waters, 3.5 μm bead size) using Agilent 1270 HPLC instrument. About 400 μg peptides were loaded on the column and HPLC gradient started at 90% solvent A (10 mM ammonium formate, pH 8.0) for 5 min and went up to 50% solvent B (90% acetonitrile, 10 mM ammonium formate, pH 8.0) during a 50 min time period, followed by a steep increase to 90% B within 5 min at a flow rate of 0.4 mL/min. The eluted peptides were collected into 60 fractions, and every 6 fractions were combined into 10 subfractions in a concatenated pattern to ensure that each subfraction contained similar complexity of hydrophilic and hydrophobic peptides.36−38 The subfractions were then dried and stored at −80 °C for further analysis.
Protein Identification by LC–MS/MS
Dried peptides were dissolved in 5% formic acid and 0.1% TFA. Peptides were loaded on a 100 μm × 150 cm column using a nano ACQUITY UHPLC (Waters) system that was interfaced to a Q Exactive MS (Thermo Fisher Scientific) through a nanoelectrospray ion source.39 Peptides were separated by a designed gradient as indicated (solvent A: 0.2% formic acid; solvent B: 70% ACN, 0.2% formic acid). The peak capacity at each gradient time was calculated using formula p = 1 + tg/w, where tg is the time of the gradient and w is the average peak width across entire LC runs.31 The peak width of individual LC run was estimated by averaging the chromatographic peak width (4σ, where 2σ is defined as fwhm of the corresponding extracted ion chromatograms) of major peptide ions. Peptides in the 10 basic pH LC subfractions were resolved similarly on this long column using a 540 min, 15–65% buffer B linear gradient. The Q Exactive was operated in a data-dependent mode switching between full scan MS and up to 20 MS/MS acquisitions. The survey scans with an m/z range of 300–1600 were acquired in the Orbitrap with 35 000 resolution at m/z = 200 and a predicted AGC value of 1 × 10⁶ with maximal ion time of 60 ms. The ions detected in survey scans were then sequentially isolated and fragmented by HCD at normalized collision energy of 28 eV. The maximal ion injection time for MS/MS was set to 60 ms at a resolution of 17 500 or 128 ms with a resolution of 35 000. Isolation of precursor ions was performed at 1.6 m/z window. Different dynamic exclusion times were evaluated to maximize peptide identification including 10, 20, 40, and 60 s. At last, 20 s was chosen for AD brain samples. For GPF method, the operation of Q Exactive MS was similar to the non-GPF method with minor modifications. The entire m/z range for MS1 was 300–1600 but was divided into multiple m/z subsections, which were described in the Results and Discussion section. Each m/z subsection had 10 m/z overlapping with adjacent subsections.25,40 For data acquisition of GPF, the cycle started at the first m/z subsection of MS1 acquisition, and its data-dependent MS/MS was followed by the second m/z subsection of MS1 acquisition and its data-dependent MS/MS until the full m/z range in MS1 was covered.
Database Search and Analysis
The acquired raw MS data were processed with an in-house data-processing pipeline as previously reported.31 Briefly, the MS raw data were converted to mzXML format using ReAdW software. Up to six precursor ions were selected for a mixed MS/MS spectrum. The search was performed by the SEQUEST algorithm (version 28 revision 13)41 against a composite target/decoy human or rat protein database.42,43 The target human protein database was generated from Uniprot (combined Swissprot and Tremble) human database containing 71 809 protein entries. The target rat protein database contained 35 570 protein entries. Spectra were searched with ±10 ppm for precursor ion mass tolerance, ± 0.02 Da for fragment ion mass tolerance, fully tryptic restriction, dynamic mass shift for oxidized Met (+15.9949), two maximal missed cleavages, and three maximal modification sites. Only a, b, and y ions were considered during the search. The peptide spectrum matches (PSMs) were first filtered by the length of matched peptides (removal of PSMs with six or fewer amino acids) and then by mass accuracy. The survival PSMs were further filtered by matching scores to achieve unique protein identification (grouped using parsimony algorithm) at 1% FDR. To perform integrative analysis with RNaseq data, we converted UniProt IDs to official gene symbols according to UCSC annotation (downloaded on 01/23/14). For each gene, the number of accepted PSMs was calculated and further normalized by gene length.
RNA-seq Analysis
Total RNA was extracted from ∼20 mg inferior frontal cortex of the same AD brain for proteomics study using the RNeasy mini kit (Qiagen).35 On-column DNA digestion was performed to eliminate the endogenous genomic DNA contaminants. The mRNA samples were purified by poly(dT) beads and then fragmented before reverse transcription. The paired end adaptors were used to ligate the processed double-stranded cDNA fragments. The sequencing was carried out on the Illumina Genome Analyzer IIx platform. Using BWA (0.5.10) aligner, RNaseq reads were aligned to multiple databases, including human genome (GRCh37), human transcriptome (RefSeq and AceView), and all possible combinations of RefSeq exons. Finally, the reads mapped to the transcriptome were converted to genomic mapping and merged together in the final output BAM files.
Results and Discussion
Installation of a Long Gradient LC–MS/MS Platform
We packed a 100 μm × 150 cm nano LC column using 5 μm C18 beads and interfaced this column with a Q Exactive MS for deep shotgun proteomic analysis of mammalian proteome (Figure 1A). Recently, the Marto group17,23 has shown that nano LC columns packed with large beads (e.g., 5 μm) in extended length (up to 1 m) perform as efficiently as nano HPLC columns packed with sub 2 μm C18 beads for the separation of mammalian protein digest complexes, but the one meter column was operated at a flow rate of 5–10 nL/min under 1500 psi with a regular HPLC system. Although the extremely low flow rate may improve ionization sensitivity, it is not optimal for resolving peptides on the majority of nano LC–MS/MS platforms that typically run in the range of 150 to 300 nL/min.6,44 The current long LC system normally flowed at 300 nL/min with backpressure of 7500 psi. When heating the column to 60 °C with lower flow rate of 150 nL/min, this backpressure was reduced to ∼3000 psi. To achieve stable electrospray ionization of the eluted peptides, we split the column into two portions (110 and 40 cm) and connected them by a metal zero dead volume union where the voltage was applied.
Figure 1.

Evaluation of the reproducibility of long LC column coupled to Q Exactive MS. (A) Illustration of the setup of long LC column (100 μm × 150 cm, 5 μm C18 particles) coupled to Q Exactive MS. (B) Base peak chromatographs of three technically repeated runs. About 1 μg of rat brain tryptic peptide mixture was loaded on the column and then eluted in a 10–45% acetonitrile gradient over 4 h. (C) Comparison of accepted peptide spectrum matches (PSMs), peptide, and protein identifications.
To evaluate the reproducibility of this system, we examined the run-to-run variation by repeated LC–MS/MS analyses. The rat brain tryptic peptide mixture was used for the optimization of the system because of similar compositions and dynamic ranges between human and rat brain proteomes. The rat brain peptide mixture (∼1 μg) was analyzed three times on this column during a 4 h run. Base peak profiles for the replicates were almost identical (Figure 1B) with the retention time shifts of <1 min. After database search and filtering, the relative standard deviations of accepted PSMs, unique peptides, and proteins were 2.5, 2.1, and 0.6%, respectively (Figure 1C). This result strongly indicated high reproducibility of the LC–MS/MS platform. The same column was used for the entire optimization process, comprising more than 100 runs, and no obvious column deterioration was observed.
Optimization of LC Parameters
Increasing LC loading capacity is one of the leading approaches to maximize peptide detection in shotgun proteomics analysis.45 We examined the effect of peptide loading amount on peptide and protein identifications using this ultralong capillary LC column. When the loading amount of rat brain peptides was increased from 0.2 to 6 μg, the identified peptides and proteins were increased by 60.6 (from 12 159 to 19 529) and 39.9% (from 2105 to 2948), respectively (Figure 2A, 2B). However, further addition of loading amount to 20 μg resulted in only 1.4% gain of peptides and 0.9% gain of proteins. Consistently, the ion intensities of peptides exemplified by one 14–3–3 peptide and one TBB3 peptide were increased by ∼10-fold or 3.8-fold, respectively, when the loading amount was increased from 0.6 to 6 μg (Figure S1 in the Supporting Information). However, further improving the loading to 20 μg did not lead to stronger ion intensity. This result suggested that the optimal loading amount of peptides for the current system was ∼6 μg, which was six times higher than the optimal loading amount on a regular capillary LC column (e.g., 75 μm × 12 cm) and twice as much as the regular loading amount reported on other long LC columns.21,26,31
Figure 2.

Optimization of the loading amount of rat brain peptides for LC–MS/MS identification. Various amounts of rat brain peptides were loaded on the long column and analyzed by a 4 h gradient. (A) Number of detected peptides with different loading levels. (B) Protein identification with different loading levels. (C) Effect of different peptide loading amount on the global distribution of peak width for major peptide ions. (D) The effect of loading amounts on the peak width of protein TBB3 peptide NSSYFVEWIPNNVK.
Next, we examined the impact of increased peptide loading amount on the LC peak width (Figure 2C). In general, the average peak width increased only ∼20% (from 0.65 to 0.77 min) when the loading amount varied from 0.6 to 20 μg, indicating that this column has high loading capacity and reasonable performance during chromatography. Interestingly, when loading 20 μg of peptides, we found that a fraction of strong peaks showed significantly peak broadening (Figure 2D), which may result in ion suppression of adjacent weak peptides. This observation may also contribute to no gain of identified peptides at 20 μg loading. To balance the benefit of peak intensity and disadvantage of peak broadening, we selected ∼6 μg peptides as a standard loading level on this LC–MS/MS platform.
It is desirable to select a LC gradient range in which the number of identified peptides in unit time across the entire LC gradient region is similar to utilize MS instrument efficiently in the shotgun proteomics platform.31 We evaluated the LC gradient for the long column and found that the optimal gradient was in a linear gradient range of 10–45% ACN (Figure 3). Over 98% of the identified peptides were eluted within this gradient range during a 4 h run, and about 78.3 ± 21.6 peptides were identified per min. Interestingly, the reported optimal LC gradient range for mammalian cellular tryptic peptide mixture was about 10–30% of ACN for both regular 12 cm column and long LC column (up to 50 cm).8,13,14,31 However, only about half of the peptides were eluted at 30% of ACN on this extra-long column, suggesting that higher organic gradient was required for efficient elution of mammalian cellular peptide complex on ultralong C18 LC columns.5 This observation may be explained by the increasing interaction between peptides and C18 beads created by the long distance through which peptides have to travel.
Figure 3.
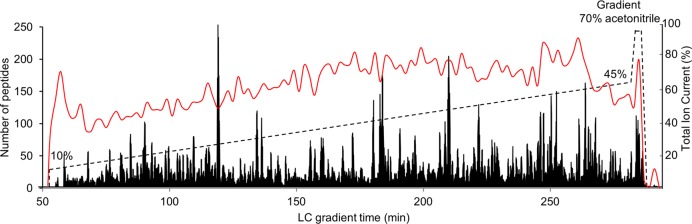
Optimization of the LC gradient buffer for peptide elution. ∼2 μg of peptides was loaded on the long column and eluted in a 10–45% gradient of acetonitrile over 4 h. The LC elution profile was represented by total ion current (solid black line) along with the gradient (dotted black line). The number of identified peptides every 2 min was plotted (solid red line). About 157 ± 42 peptides were identified in every two min.
To determine the optimal gradient time for peptide and protein identifications on this system, we tested various LC gradients ranging from 2 to 12 h. We first calculated the average peptide peak width of major peptide ions across the entire elution and then derived the corresponding peak capacity for each gradient (Figure 4A). When the peak capacities were plotted as a function of gradient time, a positive correlation was observed between peak capacity and gradient time. The peak capacity reached its maximum of 730, similar to the reported peak capacities of other nano LC columns used for in-depth proteomics analysis.13,17 Next, we investigated whether the increased peak capacities can lead to more peptide identifications. As expected, the number of PSMs was increased proportionally to the extended gradient time, while the number of identified peptides and proteins also followed this trend (Figure 4B). The number of detected peptides and proteins almost reached plateau at 12 h gradient with the identification of 23 884 peptides and 3484 proteins from 46 711 PSMs. Interestingly, there was a linear correlation (R2 = 0.985) between the peak capacity and the number of identified peptides (Figure 4C), supporting the notion that peak capacity is a major factor for optimizing LC–MS/MS-based peptide identification.13
Figure 4.

Optimization of the LC gradient time for peptide elution. (A) Peak capacities plotted against gradient time. Peak capacities were calculated by dividing the average peak width of major peptide ions in a LC run over entire gradient time. (B) Correlation between the number of identified peptides/proteins and gradient time. (C) Number of detected peptides was in a linear relationship with the peak capacity.
Evaluation of MS Parameters
One interesting finding was that MS sequencing efficiency was reduced when LC gradient time was extended on the long column, evidenced by a steady decline of the ratios of summed MS2 scans versus MS1 scans (Figure S2A in the Supporting Information). This result suggested that there was not a sufficient number of ions detected in survey MS1 scans to trigger MS2 scans. Because GPF is capable of detecting weak sample ions within a narrow m/z range but it takes multiple MS1 scans to cover a full scan region,24,25 we assessed the function of GPF to improve the MS sequencing efficiency. The m/z subsections of GPF were determined experimentally to contain the same number of PSMs in each subsection of m/z windows using rat brain peptides as a testing sample. During a 4 h LC–MS/MS analysis, one, two, three, and four m/z subsections in a full m/z range of MS1 were tested (Table S1 in the Supporting Information). Compared with no GPF, the implementation of GPF of three subsections exhibited the highest ratio of MS2/MS1 scans (Figure S2B in the Supporting Information) and led to 11.3 and 15.4% increase in the number of identified peptides and proteins, respectively (Figure S2C in the Supporting Information). Thus, the GFP of three subsections was chosen for later experiments.
To further optimize the sequencing efficiency of MS, we evaluated the effect of different dynamic exclusion time of MS on the identification of peptides and proteins. In a 4 h LC gradient on the long LC column, the number of PSMs, peptides, and proteins was the highest at 20 s dynamic exclusion time (Figure S3 in the Supporting Information). Because the calculated average peak width was ∼40 s for the 4 h LC gradient, each m/z ion would be analyzed about twice. Reduction of the dynamic exclusion time from 20 to 10 s leads to 22 and 15% drop in the number of peptide and protein identifications, respectively, even though the MS2/MS1 ratio reached the highest number of 10. This result clearly showed the redundant sampling at 10 s dynamic exclusion time because of repetitive sequencing of the same peptide ions. We observed 1.9% decrease in the number of peptide and protein identifications and >23% dropping of PSMs at 40 s dynamic exclusion time. Therefore, the dynamic exclusion time was set at 20 s for the 4 h LC gradient.
Deep Proteomic Analysis of AD Brain
We then used the optimized conditions to explore the entire proteome of AD brain (Figure 5A). About 400 μg of protein was extracted from the tissue and subjected to Lys-C and trypsin digestion. We digested the entire cell lysate without the removal of cell debris to increase the coverage of membrane and nucleus proteins as a recent study suggested.15 Basic pH reverse-phase LC was performed to prefractionate AD brain peptides because it provides better resolution and loading capacity than other methods (e.g., SCX, HILIC) and good orthogonality to acidic reverse-phase LC (Figure 5B).21,36 We collected 10 basic pH LC fractions and analyzed each fraction on the acidic pH LC–MS/MS system in a 9 h gradient time. Total MS instrument time was ∼4 days, which is comparable to other reported instrument times required for in-depth proteomes analysis varying from 1 to 2 weeks.23,26,46 A total of 1 695 626 high-resolution MS/MS spectra were acquired, identifying 629 747 PSMs (37% successful rate), 96 127 peptides, and 10 544 proteins when protein FDR was controlled at 1%. On average, each peptide was identified by MS for about seven times. In each basic pH LC fraction, the average number of detected peptides and proteins were 119 303 ± 651 and 4701 ± 119, respectively (Figure 5C). Nearly 80% of peptides were solely identified in one fraction and ∼95% of peptides were only found in one or two fractions, suggesting high partitioning of peptides within each fraction (Figure 5D).
Figure 5.

Deep proteomics analysis of AD brain tissue. (A) Flowchart of the procedure. (B) Chromatograph of basic pH RPLC prefractionation of peptides (upper panel) monitored at 214 nm and an example base peak chromatograph of acidic pH long gradient RPLC–MS/MS (lower panel).(C) Basic pH RPLC fractionation yielded even partitioning of peptides, which led to similar number of identified proteins in concaternated, pooled fractions. (D) Majority of the peptides was solely identified in one fraction.
To evaluate the depth of AD brain proteome analyzed in this pilot study, we performed deep RNA-seq analysis of the same sample and compared the proteome data with transcriptome results. We identified 16 670 protein coding genes by RNA expression, similar to the result in previous transcriptomic analysis of human brain.47 The abundance of each transcript was calculated as reads in fragment per kilobase of exon per million fragments mapped (FPKM). A total of 10 161 human genes were detected in AD brain proteome, corresponding to 61% of the expressed genes (Figure 6A). Next, we investigated the correlation between transcript and protein levels in our study. The protein level was indicated by a spectral counting based method,48 in which the total number of spectral counts for every protein was summed and normalized by the length of protein sequence (spectral counts per thousand amino acids) to adjust the bias created by protein size. We observed a modest correlation between the RNA and protein levels (Spearman correlation = 0.62, Figure 6B), which was consistent with the conclusions of other studies (Spearman correlation = 0.4 to 0.6).26 Taken together, our data suggested that the utilization of the current optimized LC/LC–MS/MS platform covers the majority of AD brain proteome.
Figure 6.

Comparison of deep proteomics and RNA-seq data from the same AD brain tissue. (A) Histogram of FPKM distribution of RNA-seq and proteomics data. The open bar represents the distribution of protein coding gene numbers detected by RNaseq, and the gray bar indicates the distribution of protein coding gene numbers validated by MS with different FPKM values. (B) Scatter plot of spectra counts per thousand amino acid of proteomic data versus FPKM of RNA-seq data.
The multidimensional LC–MS/MS system presented here was robust with no instrument down time during the entire process of deep proteomic analysis. By heating the LC column to 60 °C, this LC–MS/MS system can be operated under regular pressure limit (∼3000 psi with 0.15 μL/min flow rate), reducing potential problem of overpressure. It is conceivable that extensive prefractionation of peptides during basic pH LC separation would further reduce sample complexity and improve dynamic range in the prefractionated pools to further enhance the identification of extremely low-abundance proteins. At last, the combination of our long column LC/LC–MS/MS platform with the newly introduced Orbitrap Fusion Tribrid mass spectrometer would also allow considerably deeper proteomics analysis due to its higher scan rate and peptide identification efficiency than the Q Exactive MS instrument used in this study.11,49
Conclusions
We have demonstrated a reverse-phase-based, multidimensional long gradient LC–MS/MS platform suitable for deep proteomics analysis. We systematically examined and optimized various parameters of a 100 μm × 150 cm LC column packed with 5 μm reverse-phase C18 beads. The column exhibits great robustness and reproducibility together with high peak capacity (∼700) and loading capacity (optimal at 6 μg). Using this column in conjunction with basic pH LC and Q Exactive MS with GPF, the identification of a deep proteome of AD brain (>10 000 proteins) was achieved in ∼4 days of MS instrument time.
Acknowledgments
We thank all lab and proteomics facility members for helpful discussion. This work was partially supported by NIH grant R21AG039764, R21NS081571, U24NS072026, P30AG19610, Arizona Department of Health Services (contract 211002), the Arizona Biomedical Research Commission (contracts 4001, 0011, 05-901, and 1001), the Michael J. Fox Foundation, and ALSAC (American Lebanese Syrian Associated Charities). The MS analysis was performed in the St. Jude Children’s Research Hospital Proteomics Facility, partially supported by NIH Cancer Center Support Grant (P30CA021765).
Glossary
Abbreviations:
- LC
liquid chromatography
- MS
mass spectrometry
- FDR
false discovery rate
- AD
Alzheimer’s disease
- SAX
strong anion exchange
- SCX
strong cation exchange
Supporting Information Available
Table S1: MS1 m/z ranges selected for MS/MS in GPF method. Figure S1: Extracted base peak ion intensity of two peptides: LAEQAER of 14–3–3 γ protein and NSSYFVEWIPNNVK of TBB3 protein at different loading amounts. Figure S2: Improvement of peptide identification by GPF. Figure S3: Impact of dynamic exclusion time on protein and peptide identifications. This material is available free of charge via the Internet at http://pubs.acs.org.
Author Contributions
▽ H.W. and Z.W. contributed equally to this work.
The authors declare no competing financial interest.
Funding Statement
National Institutes of Health, United States
Supplementary Material
References
- Low T. Y.; van Heesch S.; van den Toorn H.; Giansanti P.; Cristobal A.; Toonen P.; Schafer S.; Hubner N.; van Breukelen B.; Mohammed S.; Cuppen E.; Heck A. J.; Guryev V. Quantitative and qualitative proteome characteristics extracted from in-depth integrated genomics and proteomics analysis. Cell Rep. 2013, 551469–1478. [DOI] [PubMed] [Google Scholar]
- Zhang Y.; Fonslow B. R.; Shan B.; Baek M. C.; Yates J. R. 3rd. Protein analysis by shotgun/bottom-up proteomics. Chem. Rev. 2013, 11342343–94. [DOI] [PMC free article] [PubMed] [Google Scholar]
- Aebersold R.; Mann M. Mass spectrometry-based proteomics. Nature 2003, 4226928198–207. [DOI] [PubMed] [Google Scholar]
- Giddings J. C. Maximum Number of Components Resolvable by Gel Filtration and Other Elution Chromatographic Methods. Anal. Chem. 1967, 3982. [Google Scholar]
- Shen Y.; Zhang R.; Moore R. J.; Kim J.; Metz T. O.; Hixson K. K.; Zhao R.; Livesay E. A.; Udseth H. R.; Smith R. D. Automated 20 kpsi RPLC-MS and MS/MS with chromatographic peak capacities of 1000–1500 and capabilities in proteomics and metabolomics. Anal. Chem. 2005, 77103090–100. [DOI] [PubMed] [Google Scholar]
- Shen Y.; Zhao R.; Berger S. J.; Anderson G. A.; Rodriguez N.; Smith R. D. High-efficiency nanoscale liquid chromatography coupled on-line with mass spectrometry using nanoelectrospray ionization for proteomics. Anal. Chem. 2002, 74164235–4249. [DOI] [PubMed] [Google Scholar]
- Mellors J. S.; Jorgenson J. W. Use of 1.5-microm porous ethyl-bridged hybrid particles as a stationary-phase support for reversed-phase ultrahigh-pressure liquid chromatography. Anal. Chem. 2004, 76185441–5450. [DOI] [PubMed] [Google Scholar]
- Thakur S. S.; Geiger T.; Chatterjee B.; Bandilla P.; Frohlich F.; Cox J.; Mann M. Deep and highly sensitive proteome coverage by LC-MS/MS without prefractionation. Mol. Cell. Proteomics 2011, 108M110 003699. [DOI] [PMC free article] [PubMed] [Google Scholar]
- Burgess M. W.; Keshishian H.; Mani D. R.; Gillette M. A.; Carr S. A. Simplified and efficient quantification of low-abundance proteins at very high multiplex via targeted mass spectrometry. Mol. Cell. Proteomics 2014, 1341137–1149. [DOI] [PMC free article] [PubMed] [Google Scholar]
- Shi T.; Fillmore T. L.; Gao Y.; Zhao R.; He J.; Schepmoes A. A.; Nicora C. D.; Wu C.; Chambers J. L.; Moore R. J.; Kagan J.; Srivastava S.; Liu A. Y.; Rodland K. D.; Liu T.; Camp D. G. 2nd; Smith R. D.; Qian W. J. Long-gradient separations coupled with selected reaction monitoring for highly sensitive, large scale targeted protein quantification in a single analysis. Anal. Chem. 2013, 85199196–9203. [DOI] [PMC free article] [PubMed] [Google Scholar]
- Senko M. W.; Remes P. M.; Canterbury J. D.; Mathur R.; Song Q.; Eliuk S. M.; Mullen C.; Earley L.; Hardman M.; Blethrow J. D.; Bui H.; Specht A.; Lange O.; Denisov E.; Makarov A.; Horning S.; Zabrouskov V. Novel parallelized quadrupole/linear ion trap/Orbitrap tribrid mass spectrometer improving proteome coverage and peptide identification rates. Anal. Chem. 2013, 852411710–11714. [DOI] [PubMed] [Google Scholar]
- Kocher T.; Swart R.; Mechtler K. Ultra-high-pressure RPLC hyphenated to an LTQ-Orbitrap Velos reveals a linear relation between peak capacity and number of identified peptides. Anal. Chem. 2011, 8372699–2704. [DOI] [PubMed] [Google Scholar]
- Kocher T.; Pichler P.; Swart R.; Mechtler K. Analysis of protein mixtures from whole-cell extracts by single-run nanoLC-MS/MS using ultralong gradients. Nat. Protoc. 2012, 75882–890. [DOI] [PubMed] [Google Scholar]
- Hsieh E. J.; Bereman M. S.; Durand S.; Valaskovic G. A.; MacCoss M. J. Effects of column and gradient lengths on peak capacity and peptide identification in nanoflow LC-MS/MS of complex proteomic samples. J. Am. Soc. Mass Spectrom. 2013, 241148–153. [DOI] [PMC free article] [PubMed] [Google Scholar]
- Pirmoradian M.; Budamgunta H.; Chingin K.; Zhang B.; Astorga-Wells J.; Zubarev R. A. Rapid and deep human proteome analysis by single-dimension shotgun proteomics. Mol. Cell. Proteomics 2013, 12113330–3338. [DOI] [PMC free article] [PubMed] [Google Scholar]
- Wang X.; Stoll D. R.; Schellinger A. P.; Carr P. W. Peak capacity optimization of peptide separations in reversed-phase gradient elution chromatography: fixed column format. Anal. Chem. 2006, 78103406–3416. [DOI] [PMC free article] [PubMed] [Google Scholar]
- Zhou F.; Lu Y.; Ficarro S. B.; Webber J. T.; Marto J. A. Nanoflow low pressure high peak capacity single dimension LC-MS/MS platform for high-throughput, in-depth analysis of mammalian proteomes. Anal. Chem. 2012, 84115133–5139. [DOI] [PMC free article] [PubMed] [Google Scholar]
- Zhang B.; Pirmoradian M.; Chernobrovkin A.; Zubarev R. A. DeMix Workflow for Efficient Identification of Co-fragmented Peptides in High Resolution Data-dependent Tandem Mass Spectrometry. Mol. Cell. Proteomics 2014, 13113211–3223. [DOI] [PMC free article] [PubMed] [Google Scholar]
- Mann M.; Kulak N. A.; Nagaraj N.; Cox J. The coming age of complete, accurate, and ubiquitous proteomes. Mol. Cell 2013, 494583–590. [DOI] [PubMed] [Google Scholar]
- Xu P.; Duong D. M.; Seyfried N. T.; Cheng D.; Xie Y.; Robert J.; Rush J.; Hochstrasser M.; Finley D.; Peng J. Quantitative proteomics reveals the function of unconventional ubiquitin chains in proteasomal degradation. Cell 2009, 1371133–145. [DOI] [PMC free article] [PubMed] [Google Scholar]
- Mertins P.; Qiao J. W.; Patel J.; Udeshi N. D.; Clauser K. R.; Mani D. R.; Burgess M. W.; Gillette M. A.; Jaffe J. D.; Carr S. A. Integrated proteomic analysis of post-translational modifications by serial enrichment. Nat. Methods 2013, 107634–637. [DOI] [PMC free article] [PubMed] [Google Scholar]
- Branca R. M.; Orre L. M.; Johansson H. J.; Granholm V.; Huss M.; Perez-Bercoff A.; Forshed J.; Kall L.; Lehtio J. HiRIEF LC-MS enables deep proteome coverage and unbiased proteogenomics. Nat. Methods 2014, 11159–62. [DOI] [PubMed] [Google Scholar]
- Zhou F.; Lu Y.; Ficarro S. B.; Adelmant G.; Jiang W.; Luckey C. J.; Marto J. A. Genome-scale proteome quantification by DEEP SEQ mass spectrometry. Nat. Commun. 2013, 4, 2171. [DOI] [PMC free article] [PubMed] [Google Scholar]
- Scherl A.; Shaffer S. A.; Taylor G. K.; Kulasekara H. D.; Miller S. I.; Goodlett D. R. Genome-specific gas-phase fractionation strategy for improved shotgun proteomic profiling of proteotypic peptides. Anal. Chem. 2008, 8041182–1191. [DOI] [PubMed] [Google Scholar]
- Vincent C. E.; Potts G. K.; Ulbrich A.; Westphall M. S.; Atwood J. A. 3rd; Coon J. J.; Weatherly D. B. Segmentation of precursor mass range using “tiling” approach increases peptide identifications for MS1-based label-free quantification. Anal. Chem. 2013, 8552825–2832. [DOI] [PMC free article] [PubMed] [Google Scholar]
- Nagaraj N.; Wisniewski J. R.; Geiger T.; Cox J.; Kircher M.; Kelso J.; Paabo S.; Mann M. Deep proteome and transcriptome mapping of a human cancer cell line. Mol. Syst. Biol. 2011, 7, 548. [DOI] [PMC free article] [PubMed] [Google Scholar]
- Geiger T.; Wehner A.; Schaab C.; Cox J.; Mann M. Comparative proteomic analysis of eleven common cell lines reveals ubiquitous but varying expression of most proteins. Mol. Cell. Proteomics 2012, 113M111 014050. [DOI] [PMC free article] [PubMed] [Google Scholar]
- Kulak N. A.; Pichler G.; Paron I.; Nagaraj N.; Mann M. Minimal, encapsulated proteomic-sample processing applied to copy-number estimation in eukaryotic cells. Nat. Methods 2014, 113319–324. [DOI] [PubMed] [Google Scholar]
- Wilhelm M.; Schlegl J.; Hahne H.; Moghaddas Gholami A.; Lieberenz M.; Savitski M. M.; Ziegler E.; Butzmann L.; Gessulat S.; Marx H.; Mathieson T.; Lemeer S.; Schnatbaum K.; Reimer U.; Wenschuh H.; Mollenhauer M.; Slotta-Huspenina J.; Boese J. H.; Bantscheff M.; Gerstmair A.; Faerber F.; Kuster B. Mass-spectrometry-based draft of the human proteome. Nature 2014, 5097502582–587. [DOI] [PubMed] [Google Scholar]
- Kim M. S.; Pinto S. M.; Getnet D.; Nirujogi R. S.; Manda S. S.; Chaerkady R.; Madugundu A. K.; Kelkar D. S.; Isserlin R.; Jain S.; Thomas J. K.; Muthusamy B.; Leal-Rojas P.; Kumar P.; Sahasrabuddhe N. A.; Balakrishnan L.; Advani J.; George B.; Renuse S.; Selvan L. D.; Patil A. H.; Nanjappa V.; Radhakrishnan A.; Prasad S.; Subbannayya T.; Raju R.; Kumar M.; Sreenivasamurthy S. K.; Marimuthu A.; Sathe G. J.; Chavan S.; Datta K. K.; Subbannayya Y.; Sahu A.; Yelamanchi S. D.; Jayaram S.; Rajagopalan P.; Sharma J.; Murthy K. R.; Syed N.; Goel R.; Khan A. A.; Ahmad S.; Dey G.; Mudgal K.; Chatterjee A.; Huang T. C.; Zhong J.; Wu X.; Shaw P. G.; Freed D.; Zahari M. S.; Mukherjee K. K.; Shankar S.; Mahadevan A.; Lam H.; Mitchell C. J.; Shankar S. K.; Satishchandra P.; Schroeder J. T.; Sirdeshmukh R.; Maitra A.; Leach S. D.; Drake C. G.; Halushka M. K.; Prasad T. S.; Hruban R. H.; Kerr C. L.; Bader G. D.; Iacobuzio-Donahue C. A.; Gowda H.; Pandey A. A draft map of the human proteome. Nature 2014, 5097502575–581. [DOI] [PMC free article] [PubMed] [Google Scholar]
- Xu P.; Duong D. M.; Peng J. Systematical optimization of reverse-phase chromatography for shotgun proteomics. J. Proteome Res. 2009, 883944–3950. [DOI] [PMC free article] [PubMed] [Google Scholar]
- Hyman B. T.; Trojanowski J. Q. Consensus recommendations for the postmortem diagnosis of Alzheimer disease from the National Institute on Aging and the Reagan Institute Working Group on diagnostic criteria for the neuropathological assessment of Alzheimer disease. J. Neuropathol. Exp. Neurol. 1997, 56101095–1097. [DOI] [PubMed] [Google Scholar]
- Na C. H.; Jones D. R.; Yang Y.; Wang X.; Xu Y.; Peng J. Synaptic protein ubiquitination in rat brain revealed by antibody-based ubiquitome analysis. J. Proteome Res. 2012, 1194722–32. [DOI] [PMC free article] [PubMed] [Google Scholar]
- Gozal Y. M.; Duong D. M.; Gearing M.; Cheng D.; Hanfelt J. J.; Funderburk C.; Peng J.; Lah J. J.; Levey A. I. Proteomics analysis reveals novel components in the detergent-insoluble subproteome in Alzheimer’s disease. J. Proteome Res. 2009, 8115069–5079. [DOI] [PMC free article] [PubMed] [Google Scholar]
- Bai B.; Hales C. M.; Chen P. C.; Gozal Y.; Dammer E. B.; Fritz J. J.; Wang X.; Xia Q.; Duong D. M.; Street C.; Cantero G.; Cheng D.; Jones D. R.; Wu Z.; Li Y.; Diner I.; Heilman C. J.; Rees H. D.; Wu H.; Lin L.; Szulwach K. E.; Gearing M.; Mufson E. J.; Bennett D. A.; Montine T. J.; Seyfried N. T.; Wingo T. S.; Sun Y. E.; Jin P.; Hanfelt J.; Willcock D. M.; Levey A.; Lah J. J.; Peng J. U1 small nuclear ribonucleoprotein complex and RNA splicing alterations in Alzheimer’s disease. Proc. Natl. Acad. Sci. U. S. A. 2013, 1104116562–16567. [DOI] [PMC free article] [PubMed] [Google Scholar]
- Wang Y.; Yang F.; Gritsenko M. A.; Wang Y.; Clauss T.; Liu T.; Shen Y.; Monroe M. E.; Lopez-Ferrer D.; Reno T.; Moore R. J.; Klemke R. L.; Camp D. G. 2nd; Smith R. D. Reversed-phase chromatography with multiple fraction concatenation strategy for proteome profiling of human MCF10A cells. Proteomics 2011, 11102019–2026. [DOI] [PMC free article] [PubMed] [Google Scholar]
- Dwivedi R. C.; Spicer V.; Harder M.; Antonovici M.; Ens W.; Standing K. G.; Wilkins J. A.; Krokhin O. V. Practical implementation of 2D HPLC scheme with accurate peptide retention prediction in both dimensions for high-throughput bottom-up proteomics. Anal. Chem. 2008, 80187036–7042. [DOI] [PubMed] [Google Scholar]
- Song C.; Ye M.; Han G.; Jiang X.; Wang F.; Yu Z.; Chen R.; Zou H. Reversed-phase-reversed-phase liquid chromatography approach with high orthogonality for multidimensional separation of phosphopeptides. Anal. Chem. 2010, 82153–56. [DOI] [PubMed] [Google Scholar]
- Michalski A.; Damoc E.; Lange O.; Denisov E.; Nolting D.; Muller M.; Viner R.; Schwartz J.; Remes P.; Belford M.; Dunyach J. J.; Cox J.; Horning S.; Mann M.; Makarov A. Ultra high resolution linear ion trap Orbitrap mass spectrometer (Orbitrap Elite) facilitates top down LC MS/MS and versatile peptide fragmentation modes. Mol. Cell. Proteomics 2012, 113O111 013698. [DOI] [PMC free article] [PubMed] [Google Scholar]
- Dayon L.; Sonderegger B.; Kussmann M. Combination of gas-phase fractionation and MS(3) acquisition modes for relative protein quantification with isobaric tagging. J. Proteome Res. 2012, 11105081–5089. [DOI] [PubMed] [Google Scholar]
- Eng J. K.; McCormack A. L.; Yates J. R. An approach to correlate tandem mass spectral data of peptides with amino acid sequences in a protein database. J. Am. Soc. Mass Spectrom. 1994, 511976–989. [DOI] [PubMed] [Google Scholar]
- Peng J.; Elias J. E.; Thoreen C. C.; Licklider L. J.; Gygi S. P. Evaluation of multidimensional chromatography coupled with tandem mass spectrometry (LC/LC-MS/MS) for large-scale protein analysis: the yeast proteome. J. Proteome Res. 2003, 2143–50. [DOI] [PubMed] [Google Scholar]
- Elias J. E.; Gygi S. P. Target-decoy search strategy for increased confidence in large-scale protein identifications by mass spectrometry. Nat. Methods 2007, 43207–214. [DOI] [PubMed] [Google Scholar]
- Wilm M.; Mann M. Analytical properties of the nanoelectrospray ion source. Anal. Chem. 1996, 6811–8. [DOI] [PubMed] [Google Scholar]
- Eriksson J.; Fenyo D. Improving the success rate of proteome analysis by modeling protein-abundance distributions and experimental designs. Nat. Biotechnol. 2007, 256651–655. [DOI] [PubMed] [Google Scholar]
- Zubarev R. A. The challenge of the proteome dynamic range and its implications for in-depth proteomics. Proteomics 2013, 135723–726. [DOI] [PubMed] [Google Scholar]
- Hawrylycz M. J.; Lein E. S.; Guillozet-Bongaarts A. L.; Shen E. H.; Ng L.; Miller J. A.; van de Lagemaat L. N.; Smith K. A.; Ebbert A.; Riley Z. L.; Abajian C.; Beckmann C. F.; Bernard A.; Bertagnolli D.; Boe A. F.; Cartagena P. M.; Chakravarty M. M.; Chapin M.; Chong J.; Dalley R. A.; Daly B. D.; Dang C.; Datta S.; Dee N.; Dolbeare T. A.; Faber V.; Feng D.; Fowler D. R.; Goldy J.; Gregor B. W.; Haradon Z.; Haynor D. R.; Hohmann J. G.; Horvath S.; Howard R. E.; Jeromin A.; Jochim J. M.; Kinnunen M.; Lau C.; Lazarz E. T.; Lee C.; Lemon T. A.; Li L.; Li Y.; Morris J. A.; Overly C. C.; Parker P. D.; Parry S. E.; Reding M.; Royall J. J.; Schulkin J.; Sequeira P. A.; Slaughterbeck C. R.; Smith S. C.; Sodt A. J.; Sunkin S. M.; Swanson B. E.; Vawter M. P.; Williams D.; Wohnoutka P.; Zielke H. R.; Geschwind D. H.; Hof P. R.; Smith S. M.; Koch C.; Grant S. G.; Jones A. R. An anatomically comprehensive atlas of the adult human brain transcriptome. Nature 2012, 4897416391–399. [DOI] [PMC free article] [PubMed] [Google Scholar]
- Griffin N. M.; Yu J.; Long F.; Oh P.; Shore S.; Li Y.; Koziol J. A.; Schnitzer J. E. Label-free, normalized quantification of complex mass spectrometry data for proteomic analysis. Nat. Biotechnol. 2010, 28183–89. [DOI] [PMC free article] [PubMed] [Google Scholar]
- Hebert A. S.; Richards A. L.; Bailey D. J.; Ulbrich A.; Coughlin E. E.; Westphall M. S.; Coon J. J. The one hour yeast proteome. Mol. Cell. Proteomics 2014, 131339–347. [DOI] [PMC free article] [PubMed] [Google Scholar]
Associated Data
This section collects any data citations, data availability statements, or supplementary materials included in this article.