

Abstract
Patients with pancreatic cancer (PC) are usually diagnosed at late stages, when the disease is nearly incurable. Sensitive and specific markers are critical for supporting diagnostic and therapeutic strategies. The aim of this study was to use a metabonomics approach to identify potential plasma biomarkers that can be further developed for early detection of PC. In this study, plasma metabolites of newly diagnosed PC patients (n = 100) and age- and gender-matched controls (n = 100) from Connecticut (CT), USA, and the same number of cases and controls from Shanghai (SH), China, were profiled using combined gas and liquid chromatography mass spectrometry. The metabolites consistently expressed in both CT and SH samples were used to identify potential markers, and the diagnostic performance of the candidate markers was tested in two sample sets. A diagnostic model was constructed using a panel of five metabolites including glutamate, choline, 1,5-anhydro-d-glucitol, betaine, and methylguanidine, which robustly distinguished PC patients in CT from controls with high sensitivity (97.7%) and specificity (83.1%) (area under the receiver operating characteristic curve [AUC] = 0.943, 95% confidence interval [CI] = 0.908–0.977). This panel of metabolites was then tested with the SH data set, yielding satisfactory accuracy (AUC = 0.835; 95% CI = 0.777–0.893), with a sensitivity of 77.4% and specificity of 75.8%. This model achieved a sensitivity of 84.8% in the PC patients at stages 0, 1, and 2 in CT and 77.4% in the PC patients at stages 1 and 2 in SH. Plasma metabolic signatures show promise as biomarkers for early detection of PC.
Keywords: Pancreatic cancer, metabonomics, plasma, LC−MS, GC−MS, multivariate statistical analysis, OPLS-DA, ROC, logistic regression
Introduction
Pancreatic cancer (PC) is one of the most fatal cancers, with a 5 year survival of less than 5%.1 An estimated 46 420 new cases of PC are expected in the U.S. in 2014 as well as 39 590 deaths from this disease.2 A major hurdle toward improving clinical outcome of PC is the lack of diagnostic biomarkers at early stages of the disease.3 Given the high mortality associated with PC, novel and cost-effective biomarkers to improve treatment and survival outcomes of PC patients are urgently needed.
To date, the only treatment that provides significant survival benefit is surgical resection, but only 20–25% of patients are diagnosed at early disease stages when resection is appropriate.4 The clinical symptoms of PC are usually vague and nonspecific until progression to advanced stages has occurred. Once diagnosed, most patients are found already to have metastases.5 Attempts to reduce PC deaths have therefore relied greatly on early cancer detection and treatment, generally through imaging examination, such as magnetic resonance imaging (MRI), computed tomography, endoscopic retrograde cholangiopancreatography (ERCP), or endoscopic ultrasound (EU). However, the specificity and sensitivity of these modalities are not adequate for tumors of less than 2 cm in diameter.6,7 The traditional tumor marker CA19-9, the sensitivity of which can reach 80% for PC, is unsuitable for early detection of PC due to low sensitivity for patients at resectable stages8 and especially because of its weak specificity.9 Numerous efforts have been made in the search for PC biomarkers during recent decades, and, as a result, tumor-specific growth factor (TSGF),10 CA242,11 MIC-1,12 platelet factor 4,13 peanut agglutinin (PNA)-binding glycoprotein,14 cell adhesion molecule 17.1,15 and serum immune signatures found by affinity proteomics16 have been identified as candidate biomarkers. Unfortunately, these biomarkers display low sensitivity for resectable disease, and their accuracy for detecting resectable stage cancer has not been evaluated.
Metabonomics, a new member of omics technologies that quantitatively measures altered metabolites resulting from pathophysiological changes, is rapidly becoming a discovery tool for new diagnostic and prognostic biomarkers of human diseases.17−19 We have previously shown the use of metabonomics for diagnosis and evaluation of pathologic conditions of various cancers.20−23 Recently, metabonomics studies of PC have identified biomarkers in plasma or tissue24−30 that differentiate PC from controls. However, these studies have had relatively small sample sizes and a small number of early stage or resectable cancers.
In this study, we used a combination of liquid chromatography–time-of-flight mass spectrometry (LC–TOFMS) and gas chromatography–time-of-flight mass spectrometry (GC–TOFMS) to profile plasma metabolites of PC patients and controls from the U.S. and China. The aim of this study was to identify plasma metabolites as potential markers for early detection of PC and to test the diagnostic performance of these markers.
Materials and Methods
Study Populations
Blood samples used in this study were from 100 PC patients and 100 age- and gender-matched population controls in Connecticut (CT), USA, and from 100 PC patients and 100 similarly matched population controls from Shanghai (SH), China (Table 1). The PC patients were newly diagnosed with pancreatic ductal adenocarcinoma and were not recurrent or on any medication prior to sample collection. Patient characteristics, staging of the disease, and other parameters are shown in Table 1. Control samples were collected using the same protocols. These studies were approved by the State of Connecticut Department of Public Health as well as by the Institutional Review Boards of 30 Connecticut hospitals (CT), the Institutional Human Subjects Review Board of the Shanghai Cancer Institute (SH), and the Human Investigation Committee of Yale University (CT) and Shanghai Cancer Institute (SH). All participants signed informed consent before participation.
Table 1. Demographic and Clinical Characteristics of PC Patients and Controls.
| subjects
from Connecticut (CT set) |
subjects from Shanghai (SH set) |
|||||
|---|---|---|---|---|---|---|
| cases | controls | p | cases | controls | p | |
| number | 100 | 100 | 100 | 100 | ||
| age (mean, range) | 67.9 (44.2, 85.7) | 67.8 (44.1, 84.3) | 0.96 | 64.3 (40.5, 79.1) | 64.4 (41.2, 79.2) | 0.99 |
| male/female ratio | 49/51 | 49/51 | 50/50 | 50/50 | ||
| BMI (kg/m2) | 25.78 | 26.20 | 0.49 | 23.06 | 22.80 | 0.56 |
| TNM stage | ||||||
| stage 0 | 4 | |||||
| stage 1 | 11 | 79 | ||||
| stage 2 | 51 | 21 | ||||
| stage 3 | 34 | |||||
| diabetes mellitus (%) | 0 | 0 | 0 | 0 | ||
| history of smoking (years) | 21.27 | 15.52 | <0.001 | 12.20 | 12.83 | 0.89 |
| alcohol (g/day) | 28.25 | 21.28 | 0.22 | 6.60 | 7.33 | 0.75 |
| history of pancreatitis | 8 | 3 | 2 | 1 | ||
| family PC history | 4 | 5 | 6 | 1 | ||
Plasma Sample Collection
Blood specimens were collected from all participants and returned on ice to our laboratories within 2 h of collection for blood processing. The samples were stored at −80 °C until analysis.
Metabolic Profiling
LC–TOFMS and GC–TOFMS were used for the metabonomic profiling of all samples in the study. The profiling procedure (sample preparation, metabolite separation and detection, metabonomic data preprocessing, metabolite annotation, and statistical analysis for biomarker identification) was performed following our previously published protocols with minor modifications.20,21,32 Quality control (QC) samples, which were prepared by mixing equal amounts of plasma from all subject samples, were used to control intra- and interbatch variability. QC samples were injected every 10 samples for each day. Details of plasma sample preparation and LC/GC–MS analysis are provided in the Supporting Information.
Data Analysis and Statistics
The metabonomic data obtained were normalized using internal standard p-chlorophenylalanine and calibrated using QC samples. All annotated metabolites from GC–TOFMS and LC–TOFMS data sets were combined and exported to SIMCA-P+ 12.0 software (Umetrics, Umeå, Sweden) for multivariate statistical analysis.21 Orthogonal partial least squares-discriminant analysis (OPLS-DA) were performed to discriminate between PC patients and controls. On the basis of a threshold of variable importance in the projection (VIP, value >1) from the 7-fold cross-validated OPLS-DA model, a panel of metabolites responsible for the difference in the metabolic profiles of patients and controls was obtained. In addition to the multivariate statistical method, Student’s t-test was also applied to measure the significance of each metabolite. The resultant p values for all metabolites were subsequently adjusted to account for multiple testing by a false discovery rate (FDR) method.34 Metabolites with both multivariate and univariate statistical significance (VIP > 1 and p < 0.05) were considered to be potential markers capable of differentiating PC from controls. The corresponding fold change was calculated to show how these selected differential metabolites varied in the cancer samples relative to the controls. Altered metabolic pathways in PC were analyzed by means of the quantitative enrichment analysis (QEA) algorithm represented in the metabolite set enrichment analysis (MSEA) method.35 Visualization of metabolic pathways was achieved by using Metscape 2 running on cytoscape.36,37
Receiver Operating Characteristic Curve Analysis and Prediction Models
Receiver operating characteristic (ROC) curve analysis and binary logistic regression were conducted using SPSS software (IBM SPSS Statistics 19, USA) following our previously published data analysis protocols.22 Briefly, a logistic regression model constructed using the binary outcome of PC and control as dependent variables was used to determine the best combination of plasma markers for PC prediction. The forward stepwise regression, the procedure to select the strongest variables (metabolites) until there are no more significant predictors in the data set, was used for potential biomarker selection. The Wald test was used to assess significance in logistic regression, and this test assigns a p value to each metabolite to assess significance. ROC curves for the logistic regression model were plotted with the fitted probabilities from the established model as possible cut-points for the computation of sensitivity and specificity.
Results
Plasma Metabolite Profiling of PC Patients
Demographic, lifestyle, and clinical information of the study subjects is listed in Table 1. Patients and controls were well-matched for age and gender within each study site. SH subjects were slightly younger than CT subjects. In total, 202 metabolites were identified (Supporting Information Table S1) from the detected spectral features of samples; of these, 109 metabolites (53.7%, 70 metabolites from GC–MS and 39 from LC–MS) were validated with reference standards, whereas the others were annotated by comparing with available databases including the NIST library and the Human Metabolome Database (HMDB). A one-predictive component and two-orthogonal component OPLS-DA model (R2X = 0.170, R2Y(cum) = 0.757, Q2(cum) = 0.565) was constructed with satisfactory discriminating ability using the metabonomics data of the 202 identified plasma metabolites in CT samples (Figure 1A). Similarly, a one-predictive component and four-orthogonal component OPLS-DA model (R2X = 0.258, R2Y(cum) = 0.880, Q2(cum) = 0.679) was constructed with satisfactory discriminating ability using the metabonomics data of the 202 identified plasma metabolites in SH samples (Figure 1B). PC patients from both CT and SH sample sets could be separated from their control counterparts.
Figure 1.

Metabolic profiles depicted by OPLS-DA scores plots of LC−TOFMS and GC−TOFMS spectral data (202 metabolites) from (A) CT plasma samples, (B) SH plasma samples, and (C) 3D OPLS-DA scores plot of plasma metabolic profiles of PC patients and controls from CT and SH.
Using the VIP values (VIP > 1) derived from the OPLS-DA model and the p values (p < 0.05), 65 differentially expressed metabolites in the CT set and 62 in the SH set were obtained, among which 31 metabolites were the same and were significantly altered in the same direction (Table 2). PC patients can be discriminated from control subjects with the 31 differential metabolites identified both in CT and SH samples, as evidenced by a 3D OPLS-DA scores plot of plasma metabolic profiles of PC patients and controls from CT and SH shown in Figure 1C.
Table 2. Plasma Differential Metabolites in PC Patients Compared to Controls in the CT and SH Groups.
| CT set |
SH set |
||||||||
|---|---|---|---|---|---|---|---|---|---|
| compound | class | VIPa | FCb | pc | adjusted pd | VIPa | FCb | pc | adjusted pd |
| urea | aliphatic acyclic compounds | 1.8 | 0.73 | 6.31 × 10⁻⁸ | 6.68 × 10⁻⁷ | 2.03 | 0.75 | 4.51 × 10⁻⁹ | 5.96 × 10⁻⁸ |
| choline | aliphatic acyclic compounds | 1.5 | 0.87 | 1.20 × 10⁻⁵ | 5.88 × 10⁻⁵ | 1.79 | 0.82 | 5.41 × 10⁻⁸ | 5.11 × 10⁻⁷ |
| methylguanidine | aliphatic acyclic compounds | 1.66 | 1.35 | 1.67 × 10⁻⁵ | 6.91 × 10⁻⁵ | 1.35 | 1.36 | 1.08 × 10⁻⁴ | 3.97 × 10⁻⁴ |
| creatinine | aliphatic heteromonocyclic compounds | 2.07 | 0.73 | 5.36 × 10⁻⁹ | 1.36 × 10⁻⁷ | 1.37 | 0.8 | 1.23 × 10⁻⁴ | 4.31 × 10⁻⁴ |
| 3-amino-2-piperidone | aliphatic heteromonocyclic compounds | 1.9 | 0.77 | 1.35 × 10⁻⁷ | 1.14 × 10⁻⁶ | 1.49 | 0.75 | 1.19 × 10⁻⁵ | 6.05 × 10⁻⁵ |
| 2-aminobutyric acid | amino acids | 2.13 | 0.72 | 7.98 × 10⁻⁹ | 1.69 × 10⁻⁷ | 1.04 | 1.21 | 6.52 × 10⁻³ | 1.35 × 10⁻² |
| betaine | amino acids | 2.36 | 0.79 | 6.90 × 10⁻¹³ | 2.19 × 10⁻¹¹ | 1.54 | 0.88 | 5.66 × 10⁻⁶ | 3.25 × 10⁻⁵ |
| valine | amino acids | 2 | 0.79 | 2.02 × 10⁻⁸ | 3.67 × 10⁻⁷ | 1.08 | 0.86 | 1.07 × 10⁻³ | 2.73 × 10⁻³ |
| 2,4-diaminobutyric acid | amino acids | 2.42 | 0.8 | 1.28 × 10⁻¹³ | 5.42 × 10⁻¹² | 1.74 | 0.87 | 3.09 × 10⁻⁷ | 2.27 × 10⁻⁶ |
| glutamine | amino acids | 1.31 | 0.84 | 3.21 × 10⁻³ | 6.79 × 10⁻³ | 1.57 | 0.73 | 1.16 × 10⁻⁵ | 6.05 × 10⁻⁵ |
| tryptophan | amino acids | 1.62 | 0.85 | 1.67 × 10⁻⁵ | 6.91 × 10⁻⁵ | 1.61 | 0.85 | 5.24 × 10⁻⁶ | 3.15 × 10⁻⁵ |
| proline | amino acids | 1 | 0.87 | 2.13 × 10⁻² | 3.26 × 10⁻² | 1.94 | 0.72 | 5.31 × 10⁻⁹ | 6.39 × 10⁻⁸ |
| glutamate | amino acids | 1.52 | 1.66 | 4.91 × 10⁻⁶ | 2.81 × 10⁻⁵ | 1.9 | 1.63 | 1.65 × 10⁻⁷ | 1.46 × 10⁻⁶ |
| N-acetylglutamine | amino acids | 1.84 | 2.33 | 7.16 × 10⁻⁷ | 5.35 × 10⁻⁶ | 1.23 | 1.29 | 9.23 × 10⁻⁴ | 2.40 × 10⁻³ |
| indoleacetic acid | aromatic heteropolycyclic compounds | 1.71 | 0.76 | 1.16 × 10⁻⁶ | 7.39 × 10⁻⁶ | 1.42 | 0.8 | 1.41 × 10⁻⁴ | 4.55 × 10⁻⁴ |
| 1,3,7-trimethyluric acid | aromatic heteropolycyclic compounds | 1.5 | 0.79 | 2.94 × 10⁻⁵ | 1.13 × 10⁻⁴ | 1.59 | 0.55 | 7.70 × 10⁻⁶ | 4.25 × 10⁻⁵ |
| uric acid | aromatic heteropolycyclic compounds | 1.34 | 0.81 | 2.03 × 10⁻⁵ | 8.07 × 10⁻⁵ | 2.21 | 0.73 | 3.57 × 10⁻¹⁰ | 6.75 × 10⁻⁹ |
| indoleacrylic acid | aromatic heteropolycyclic compounds | 1.48 | 0.85 | 4.65 × 10⁻⁵ | 1.60 × 10⁻⁴ | 1.47 | 0.86 | 3.87 × 10⁻⁵ | 1.65 × 10⁻⁴ |
| adenine | aromatic heteropolycyclic compounds | 1.18 | 0.85 | 1.30 × 10⁻⁴ | 3.74 × 10⁻⁴ | 1.15 | 0.85 | 5.27 × 10⁻⁴ | 1.42 × 10⁻³ |
| monoisobutyl phthalic acid | aromatic homomonocyclic compounds | 1.62 | 0.39 | 5.08 × 10⁻⁶ | 2.81 × 10⁻⁵ | 1.49 | 0.64 | 4.08 × 10⁻⁵ | 1.69 × 10⁻⁴ |
| 2,5-dihydroxybenzoic acid | aromatic homomonocyclic compounds | 1.49 | 0.61 | 1.43 × 10⁻⁴ | 3.94 × 10⁻⁴ | 2.41 | 0.38 | 5.70 × 10⁻¹² | 1.89 × 10⁻¹⁰ |
| 2-hydroxycinnamic acid | aromatic homomonocyclic compounds | 1.23 | 0.85 | 4.92 × 10⁻⁵ | 1.64 × 10⁻⁴ | 1.17 | 0.88 | 4.42 × 10⁻⁴ | 1.24 × 10⁻³ |
| 1,5-anhydro-d-glucitol | carbohydrates | 2.74 | 0.5 | 1.75 × 10⁻¹⁶ | 2.22 × 10⁻¹⁴ | 1.69 | 0.64 | 1.97 × 10⁻⁶ | 1.30 × 10⁻⁵ |
| talopyranose | carbohydrates | 1.21 | 1.57 | 1.71 × 10⁻³ | 4.10 × 10⁻³ | 2.21 | 1.89 | 1.12 × 10⁻¹⁰ | 2.46 × 10⁻⁹ |
| propionylcarnitine | lipids | 2.56 | 0.64 | 6.56 × 10⁻¹⁴ | 4.17 × 10⁻¹² | 2.42 | 0.68 | 4.96 × 10⁻¹³ | 2.19 × 10⁻¹¹ |
| LysoPC(14:0) | lipids | 1.58 | 0.74 | 7.19 × 10⁻⁶ | 3.81 × 10⁻⁵ | 2.3 | 0.57 | 2.00 × 10⁻¹¹ | 5.30 × 10⁻¹⁰ |
| galactitol | lipids | 1.26 | 0.85 | 4.26 × 10⁻⁵ | 1.56 × 10⁻⁴ | 1.19 | 0.86 | 2.21 × 10⁻⁴ | 6.64 × 10⁻⁴ |
| glycocholic acid | lipids | 1.16 | 3.65 | 2.14 × 10⁻³ | 4.87 × 10⁻³ | 1.12 | 7.35 | 1.70 × 10⁻³ | 4.09 × 10⁻³ |
| nicotinic acid mononucleotide | nucleosides | 1.85 | 0.76 | 4.35 × 10⁻⁸ | 5.52 × 10⁻⁷ | 1.88 | 0.62 | 2.11 × 10⁻⁷ | 1.64 × 10⁻⁶ |
| 2-oxoglutaric acid | organic acids | 1.58 | 1.89 | 1.57 × 10⁻⁵ | 6.91 × 10⁻⁵ | 1.42 | 2.05 | 8.94 × 10⁻⁵ | 3.38 × 10⁻⁴ |
| 2-methyl-3-oxopropanoic acid | organic acids | 1.85 | 1.84 | 1.35 × 10⁻⁷ | 1.14 × 10⁻⁶ | 1.59 | 1.77 | 1.44 × 10⁻⁵ | 6.81 × 10⁻⁵ |
Variable importance in the projection (VIP) was obtained from OPLS-DA with a threshold of 1.0.
Fold change (FC) was obtained by comparing those metabolites in the PC group to the control group; FC with a value >1 indicates a relatively higher concentration present in the PC group, whereas a value <1 indicates a relatively lower concentration compared to the control group.
p values from Student’s t-test.
Adjusted for multiple comparison based on FDR.34
The 31 significantly altered plasma metabolites in both CT and SH patients (adjusted p < 0.05, Supporting Information Figure S1A) include amino acids, carbohydrates, lipids, nucleosides, organic acids, aromatic heteropolycyclic compounds, aliphatic acyclic compounds, and aliphatic heteromonocyclic compounds (Table 2 and Supporting Information Figure S1A). Thirty six metabolic pathways were found to be dysregulated in PC based on the analysis of the QEA algorithm of the MSEA method (Bonferroni-corrected p < 0.05, Supporting Information Figure S1B).35
Logistic Regression and Receiver Operating Characteristic Curve Analysis
To evaluate the potential utility of plasma metabolites for the discrimination between PC patients and control subjects, we developed a logistic regression model based on the 31 validated biomarkers from the CT set. Through a forward stepwise analysis, we identified glutamate, choline, 1,5-anhydro-d-glucitol, betaine, and methylguanidine as being the best predictors of disease status in the regression model (Table 3). Using these metabolites, we established a regression model as follows:
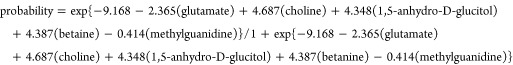 |
Table 3. Logistic Regression Analysis of PC-Associated Plasma Metabolite Signatures in CT.
| coefficient | SE | p valuea | |
|---|---|---|---|
| glutamate | –2.365 | 0.790 | 2.75 × 10⁻³ |
| choline | 4.687 | 1.314 | 3.60 × 10⁻⁴ |
| 1,5-anhydro-d-glucitol | 4.348 | 0.834 | 1.84 × 10⁻⁷ |
| betaine | 4.837 | 1.568 | 2.03 × 10⁻³ |
| methylguanidine | –0.414 | 0.121 | 6.10 × 10⁻⁴ |
| constant | –9.168 | 2.113 | 1.43 × 10⁻⁵ |
p values were calculated using the Wald test.
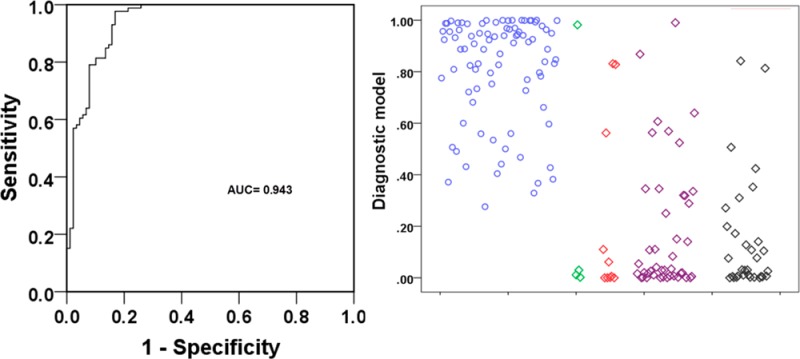
Next, we generated ROC curves to assess the potential usefulness of plasma metabolite signatures as noninvasive biomarkers for the diagnosis of PC. Our ROC analyses revealed that plasma metabolite biomarkers were robust in discriminating patients with PC from controls in CT, with an area under the curve (AUC) value of 0.943 (95% CI = 0.908–0.977) (Figure 2A). Using a cutoff value of 0.3598, the sensitivity, specificity, and positive and negative predictive values are given in Table 4.
Figure 2.

(A) ROC curve analysis for the predictive power of combined plasma biomarkers for distinguishing PC from controls in the CT set. The final logistic model included five plasma biomarkers: glutamate, choline, 1,5-anhydro-d-glucitol, betaine, and methylguanidine. (B) ROC curve analysis for the predictive power of combined plasma biomarkers for distinguishing PC from control in the SH set. At the cutoff value determined in the CT set, plasma metabolite biomarkers yielded an AUC value of 0.835 (95% CI, 0.777–0.893) with 77.4% sensitivity and 75.8% in discriminating PC from controls. (C) Plots of the diagnostic values of the constructed diagnostic model and tumor marker levels in 100 PC patients and 100 controls in the CT set and 100 PC patients and 100 controls in the SH set, according to disease stage.
Table 4. Diagnostic Performance of the Constructed Model and Tumor Markers.
| diagnostic model | ||
|---|---|---|
| CT set | AUC (95% confidence interval) | 0.943 (0.908–0.977) |
| cutoff value | 0.3598 | |
| sensitivity | 97.7% | |
| specificity | 83.1% | |
| positive predictive value | 84.3% | |
| negative predictive value | 87.2% | |
| sensitivity in PC of stages 0–2 | 84.8% | |
| SH set | AUC (95% confidence interval) | 0.835 (0.777–0.893) |
| sensitivity | 77.4% | |
| specificity | 75.8% | |
| sensitivity in PC of stages 1–2 | 77.4% |
Third, the parameters obtained from the CT set were used to predict the probability of PC diagnosis in the SH set. Similarly, the ROC curve was constructed with the predicted probability for the SH set and is shown in Figure 2B. The AUC of the model was 0.835. At the same cutoff value of 0.3598, its sensitivity and specificity values were still substantial (Table 4). The predictive values obtained from this classification method in the CT and SH samples are also shown in scatter plots in Figure 2C.
To investigate whether the PC-associated plasma metabolite signatures can differentiate between patients and controls independently of possible confounding risk factors, logistic regression analysis was performed in combined CT and SH data sets. The PC-associated plasma metabolite signatures remained significant (p < 0.001) after adjustment for BMI and use of tobacco and alcohol (Supporting Information Table S2).
Discussion
Altered metabolism is considered to be one of the hallmarks of cancer.38 Genetic alterations enable cancer cells to reprogram metabolism to meet increased energy demands for cell proliferation and to survive in hypoxic and nutrient-deprived tumor microenvironments.39 In this regard, a better understanding of metabolic dysregulation in PC is important and necessary. The new understanding may also lead to the discovery of novel biomarkers. Metabonomics allows for global assessment of the cellular metabolic state within the context of the immediate environment, taking into account genetic regulation, altered kinetic activity of enzymes, and changes in inflammatory and stress levels.40 In this study, we used combined LC–TOFMS and GC–TOFMS to profile plasma metabolites.20,21 The combination of different analytical platforms takes advantage of complementary analytical outcomes and, therefore, provides an unrivaled number of identified metabolites for explaining biological variations associated with pathophysiological conditions41 and obtains cross-validated results as well. We also included two groups of subjects with different ethnic backgrounds, from USA and China, to identify and validate the metabolite biomarkers. Although there are ethnic differences in metabonomic profiles between CT and SH subjects (Figure 1C), PC patients can still be readily discriminated from the controls.
The OPLS-DA models derived from the current metabonomic analysis were able to differentiate between PC and controls in both the CT and SH cohorts, highlighting the diagnostic potential of this noninvasive analytical approach. Our results also demonstrated the potential role of metabolite biomarkers in the early detection of PC, which is supported by the markedly high AUC values of 0.943 and 0.835 from comparisons between PC patients and controls (sensitivity = 97.7 and 77.4%; specificity = 83.1 and 75.8%) in the CT and SH cohorts, respectively. Even more important for potential early diagnosis of PC, our metabonomics-based diagnostic model was sensitive at detecting early stage PC in the models that were adjusted for BMI and history of smoking and drinking.42
The pathogenesis of pancreatic disease can cause significant decreases in plasma levels of amino acids, fatty acids, aliphatic acyclic compounds, and aromatic heteropolycyclic compounds (valine, glutamine, proline, tryptophan, monoisobutyl phthalic acid, propionylcarnitine, urea, and uric acid) and increases in glutamic acid and glycocholic acid, which have been demonstrated by other research groups that have found alterations in plasma/serum metabolites similar to ours.24,30,43 It is well-known that uptake and catabolism of amino acids and fatty acids are enhanced to support rapid cell proliferation in cancer tissues44 and that these changes may be explained as a result of the enhanced usage in tumors (Supporting Information Figures S2 and S3). Metabolic pathway analysis also suggests that glycine/serine/threonine/methionine metabolism (Supporting Information Figure S2), glutamate pathway (Supporting Information Figure S3), tyrosine metabolism (Supporting Information Figure S4), TCA cycle (Supporting Information Figure S5), choline metabolism (Supporting Information Figures S2 and S6), and bile acid metabolism (Supporting Information Figure S7) are markedly altered.
PC may result from a mutation in either the exocrine or endocrine function of the pancreas.45 Therefore, there is a possibility that the decreases in their plasma metabolite levels also reflect malnutrition. Consistent with results found by Kobayashi and colleagues,30 we observed that plasma levels of 1,5-anhydro-d-glucitol were significantly reduced in PC patients compared to controls (Table 2). 1,5-Anhydro-d-glucitol is reported to be a biomarker of short-term glycemic control,44 and decreased plasma levels of 1,5-anhydro-d-glucitol suggest the presence of hyperglycemia and glycosuria. These results indicate some impairment of glucose tolerance in these patients because of pancreatic insufficiency. Glutamate is one of the main components in tumor growth and progression. Glutamate has been implicated in tumorigenesis through activation of alpha-amino-3-hydroxy-5-methyl-4-isoxazolepropionic acid (AMPA) receptors (AMPAR), and glutamate concentration plays a key role in PC cell invasion and migration.46 Our observation of a significantly elevated plasma level of glutamate is in accordance with serum analyses of PC by Bathe et al.26 (Supporting Information Figure S3). Choline-containing metabolites have already been chosen as biomarkers in various carcinoma studies47 and have been reported to be decreased in PC.25 Choline deficiency can also produce severe acute pancreatitis in animal models.48 In our results, reduced betaine enhanced the discrimination of PC from controls. Betaine donates methyl groups for remethylation of homocysteine to methionine and dimethylglycine, which support proper liver and pancreatic function, cellular replication, and detoxification reactions. Because choline is a precursor of betaine, the depletion of both betaine and choline in PC may be interrelated (Supporting Information Figures S2 and S6). It has been reported that urinary levels of methylguanidine are significantly increased in chronic pancreatitis patients,49 yet this metabolite has not been studied in PC to date.
Glycocholic acid was not selected in the panel of markers (glutamate, choline, 1,5-anhydro-d-glucitol, betaine, and methylguanidine) for the prediction of PC using the forward stepwise regression method. Because its level is remarkably increased in PC patients (3.65-fold increase in the CT set and 7.35-fold increase in the SH set), we added glycocholic acid manually into the logistic regression model, and as a result, there is no statistical significance for glycocholic acid in the model (p = 0.229) (Supporting Information Table S3).
Although our current assay may stimulate the development of tools for early diagnosis of PC, there are a number of limitations to consider. First, the identified markers used to build the logistic regression model were selected from both the CT and SH data sets. Therefore, the marker panel needs to be further validated with a new independent sample set. Second, chronic pancreatitis is one major risk factor for PC. We did not have access to subjects with chronic pancreatitis and thus our marker panel needs to be examined in such patients to see how much they differ from PC patients. Third, recent metabolomics studies of PC have provided metabolite biomarkers24−30 that can differentiate PC patients from controls. However, whether the identified metabolite biomarkers are specific to PC, rather than involving other malignancies or inflammatory disease in general, is not clear. Future metabonomics studies need to evaluate the specificity of metabolite biomarkers for PC versus other malignancies. Fourth, we observed the impact of only two ethnic backgrounds on the performance of diagnostic markers. A new sample set with more diverse ethnic backgrounds would be useful to increase generalizability. In addition, the sensitivity and specificity of this metabolite panel needs to be compared with the performance of existing markers, such as CA19-9, in future studies.
Conclusions
In summary, we identified a panel of five plasma metabolite markers of PC and developed a diagnostic model using logistic regression analysis of the biomarker panel. Our model achieved reasonably high accuracy. Additional studies are still necessary for further evaluation and validation of the biomarkers identified in the current study. However, this novel approach holds potential to improve patient prognosis by early detection of PC, when it may still be at a resectable stage.
Acknowledgments
This work was funded by the grants R01 CA098870 and R01 CA114421 from the U.S. National Institutes of Health, by grant 08411954100 from the Science and Technology Commission of the Shanghai Municipality, and by grant SB10-06 from the Shanghai Cancer Institute.
Supporting Information Available
Methods: Plasma sample preparation and analysis by GC–TOFMS and LC–TOFMS. Table S1: List of 202 identified plasma metabolites by GC–TOFMS and LC–TOFMS in pancreatic cancer patients and controls from CT and SH. Table S2: Logistic regression analysis reveals that the PC-associated plasma metabonomics signature was independent of the possible confounding risk factors including BMI, use of tobacco and alcohol, age, and sex. Table S3: Logistic regression analysis of six plasma metabolite signatures in CT. Figure S1: The total altered metabolites and altered metabolic pathways in PC. Figure S2: Glycine/serine/threonine/methionine metabolism of PC. Figure S3: Glutamate pathway of PC. Figure S4: Tyrosine metabolism of PC. Figure S5: TCA cycle of PC. Figure S6: Choline metabolism of PC. Figure S7: Bile acid metabolism of PC. This material is available free of charge via the Internet at http://pubs.acs.org.
The authors declare no competing financial interest.
Funding Statement
National Institutes of Health, United States
Supplementary Material
References
- Gong Z.; Holly E. A.; Bracci P. M. Survival in population-based pancreatic cancer patients: San Francisco Bay area, 1995–1999. Am. J. Epidemiol. 2011, 174, 1373–81. [DOI] [PMC free article] [PubMed] [Google Scholar]
- Cancer Facts & Figures; American Cancer Society, Inc: Atlanta, GA, 2014.
- Brand R. The diagnosis of pancreatic cancer. Cancer J. 2001, 7, 287–97. [PubMed] [Google Scholar]
- Hidalgo M. Pancreatic cancer. N. Engl. J. Med. 2010, 362, 1605–17. [DOI] [PubMed] [Google Scholar]
- What you need to know about cancer of the pancreas; National Cancer Institute, U.S. Department of Health and Human Services: Bethesda, MD, 2001.
- Brenner D. J.; Hall E. J. Computed tomography—an increasing source of radiation exposure. N. Engl. J. Med. 2007, 357, 2277–84. [DOI] [PubMed] [Google Scholar]
- Brand R. E.; Matamoros A. Imaging techniques in the evaluation of adenocarcinoma of the pancreas. Dig. Dis. 1998, 16, 242–52. [DOI] [PubMed] [Google Scholar]
- Rosty C.; Goggins M. Early detection of pancreatic carcinoma. Hematol. Oncol. Clin. North Am. 2002, 16, 37–52. [DOI] [PubMed] [Google Scholar]
- Brand R. E.; Nolen B. M.; Zeh H. J.; Allen P. J.; Eloubeidi M. A.; Goldberg M.; Elton E.; Arnoletti J. P.; Christein J. D.; Vickers S. M.; Langmead C. J.; Landsittel D. P.; Whitcomb D. C.; Grizzle W. E.; Lokshin A. E. Serum biomarker panels for the detection of pancreatic cancer. Clin. Cancer Res. 2011, 17, 805–16. [DOI] [PMC free article] [PubMed] [Google Scholar]
- Jiang J. T.; Wu C. P.; Deng H. F.; Lu M. Y.; Wu J.; Zhang H. Y.; Sun W. H.; Ji M. Serum level of TSGF, CA242 and CA19-9 in pancreatic cancer. World J. Gastroenterol. 2004, 10, 1675–7. [DOI] [PMC free article] [PubMed] [Google Scholar]
- Kawa S.; Tokoo M.; Hasebe O.; Hayashi K.; Imai H.; Oguchi H.; Kiyosawa K.; Furuta S.; Homma T. Comparative study of CA242 and CA19-9 for the diagnosis of pancreatic cancer. Br. J. Cancer 1994, 70, 481–6. [DOI] [PMC free article] [PubMed] [Google Scholar]
- Koopmann J.; Rosenzweig C. N.; Zhang Z.; Canto M. I.; Brown D. A.; Hunter M.; Yeo C.; Chan D. W.; Breit S. N.; Goggins M. Serum markers in patients with resectable pancreatic adenocarcinoma: macrophage inhibitory cytokine 1 versus CA19-9. Clin. Cancer Res. 2006, 12, 442–6. [DOI] [PubMed] [Google Scholar]
- Fiedler G. M.; Leichtle A. B.; Kase J.; Baumann S.; Ceglarek U.; Felix K.; Conrad T.; Witzigmann H.; Weimann A.; Schutte C.; Hauss J.; Buchler M.; Thiery J. Serum peptidome profiling revealed platelet factor 4 as a potential discriminating peptide associated with pancreatic cancer. Clin. Cancer Res. 2009, 15, 3812–9. [DOI] [PubMed] [Google Scholar]
- Ching C. K.; Rhodes J. M.; Enzyme-linked P. N. A. lectin binding assay compared with CA19-9 and CEA radioimmunoassay as a diagnostic blood test for pancreatic cancer. Br. J. Cancer 1989, 59, 949–53. [DOI] [PMC free article] [PubMed] [Google Scholar]
- Yiannakou J. Y.; Newland P.; Calder F.; Kingsnorth A. N.; Rhodes J. M. Prospective study of CAM 17.1/WGA mucin assay for serological diagnosis of pancreatic cancer. Lancet 1997, 349, 389–92. [DOI] [PubMed] [Google Scholar]
- Wingren C.; Sandstrom A.; Segersvard R.; Carlsson A.; Andersson R.; Lohr M.; Borrebaeck C. A. Identification of serum biomarker signatures associated with pancreatic cancer. Cancer Res. 2012, 72, 2481–90. [DOI] [PubMed] [Google Scholar]
- Nicholson J. K.; Lindon J. C.; Holmes E. ‘Metabonomics’: understanding the metabolic responses of living systems to pathophysiological stimuli via multivariate statistical analysis of biological NMR spectroscopic data. Xenobiotica 1999, 29, 1181–9. [DOI] [PubMed] [Google Scholar]
- Fiehn O. Metabolomics—the link between genotypes and phenotypes. Plant Mol. Biol. 2002, 48, 155–71. [PubMed] [Google Scholar]
- Liesenfeld D. B.; Habermann N.; Owen R. W.; Scalbert A.; Ulrich C. M. Review of mass spectrometry-based metabolomics in cancer research. Cancer Epidemiol., Biomarkers Prev. 2013, 22, 2182–201. [DOI] [PMC free article] [PubMed] [Google Scholar]
- Chen T.; Xie G.; Wang X.; Fan J.; Qiu Y.; Zheng X.; Qi X.; Cao Y.; Su M.; Xu L. X.; Yen Y.; Liu P.; Jia W. Serum and urine metabolite profiling reveals potential biomarkers of human hepatocellular carcinoma. Mol. Cell. Proteomics 2011, 10, M110.004945. [DOI] [PMC free article] [PubMed] [Google Scholar]
- Qiu Y. P.; Cai G. X.; Su M. M.; Chen T. L.; Zheng X. J.; Xu Y.; Ni Y.; Zhao A. H.; Xu L. X.; Cai S. J.; Jia W. Serum Metabolite Profiling of Human Colorectal Cancer Using GC–TOFMS and UPLC–QTOFMS. J. Proteome Res. 2009, 8, 4844–50. [DOI] [PubMed] [Google Scholar]
- Wei J.; Xie G.; Zhou Z.; Shi P.; Qiu Y.; Zheng X.; Chen T.; Su M.; Zhao A.; Jia W. Salivary metabolite signatures of oral cancer and leukoplakia. Int. J. Cancer 2011, 129, 2207–17. [DOI] [PubMed] [Google Scholar]
- Cai Z.; Zhao J. S.; Li J. J.; Peng D. N.; Wang X. Y.; Chen T. L.; Qiu Y. P.; Chen P. P.; Li W. J.; Xu L. Y.; Li E. M.; Tam J. P.; Qi R. Z.; Jia W.; Xie D. A combined proteomics and metabolomics profiling of gastric cardia cancer reveals characteristic dysregulations in glucose metabolism. Mol. Cell. Proteomics 2010, 9, 2617–28. [DOI] [PMC free article] [PubMed] [Google Scholar]
- Nishiumi S.; Shinohara M.; Ikeda A.; Yoshie T.; Hatano N.; Kakuyama S.; Mizuno S.; Sanuki T.; Kutsumi H.; Fukusaki E.; Azuma T.; Takenawa T.; Yoshida M. Serum metabolomics as a novel diagnostic approach for pancreatic cancer. Metabolomics 2010, 6, 518–28. [Google Scholar]
- Fang F.; He X.; Deng H.; Chen Q.; Lu J.; Spraul M.; Yu Y. Discrimination of metabolic profiles of pancreatic cancer from chronic pancreatitis by high-resolution magic angle spinning 1H nuclear magnetic resonance and principal components analysis. Cancer Sci. 2007, 98, 1678–82. [DOI] [PMC free article] [PubMed] [Google Scholar]
- Bathe O. F.; Shaykhutdinov R.; Kopciuk K.; Weljie A. M.; McKay A.; Sutherland F. R.; Dixon E.; Dunse N.; Sotiropoulos D.; Vogel H. J. Feasibility of identifying pancreatic cancer based on serum metabolomics. Cancer Epidemiol., Biomarkers Prev. 2011, 20, 140–7. [DOI] [PubMed] [Google Scholar]
- Urayama S.; Zou W.; Brooks K.; Tolstikov V. Comprehensive mass spectrometry based metabolic profiling of blood plasma reveals potent discriminatory classifiers of pancreatic cancer. Rapid Commun. Mass Spectrom. 2010, 24, 613–20. [DOI] [PubMed] [Google Scholar]
- Tesiram Y. A.; Lerner M.; Stewart C.; Njoku C.; Brackett D. J. Utility of nuclear magnetic resonance spectroscopy for pancreatic cancer studies. Pancreas 2012, 41, 474–80. [DOI] [PubMed] [Google Scholar]
- OuYang D.; Xu J. J.; Huang H. G.; Chen Z. Metabolomic profiling of serum from human pancreatic cancer patients using 1H NMR spectroscopy and principal component analysis. Appl. Biochem. Biotechnol. 2011, 165, 148–54. [DOI] [PubMed] [Google Scholar]
- Kobayashi T.; Nishiumi S.; Ikeda A.; Yoshie T.; Sakai A.; Matsubara A.; Izumi Y.; Tsumura H.; Tsuda M.; Nishisaki H.; Hayashi N.; Kawano S.; Fujiwara Y.; Minami H.; Takenawa T.; Azuma T.; Yoshida M. A novel serum metabolomics-based diagnostic approach to pancreatic cancer. Cancer Epidemiol Biomarkers Prev 2013, 22, 571–9. [DOI] [PubMed] [Google Scholar]
- Fordahl S.; Cooney P.; Qiu Y.; Xie G.; Jia W.; Erikson K. M. Waterborne manganese exposure alters plasma, brain, and liver metabolites accompanied by changes in stereotypic behaviors. Neurotoxicol. Teratol. 2012, 34, 27–36. [DOI] [PMC free article] [PubMed] [Google Scholar]
- Pike N. Using false discovery rates for multiple comparisons in ecology and evolution. Methods Ecol. Evol. 2011, 2, 278–82. [Google Scholar]
- Xia J.; Wishart D. S. MSEA: a web-based tool to identify biologically meaningful patterns in quantitative metabolomic data. Nucleic Acids Res. 2010, 38, W71–7. [DOI] [PMC free article] [PubMed] [Google Scholar]
- Karnovsky A.; Weymouth T.; Hull T.; Tarcea V. G.; Scardoni G.; Laudanna C.; Sartor M. A.; Stringer K. A.; Jagadish H. V.; Burant C.; Athey B.; Omenn G. S. Metscape 2 bioinformatics tool for the analysis and visualization of metabolomics and gene expression data. Bioinformatics 2012, 28, 373–80. [DOI] [PMC free article] [PubMed] [Google Scholar]
- Shannon P.; Markiel A.; Ozier O.; Baliga N. S.; Wang J. T.; Ramage D.; Amin N.; Schwikowski B.; Ideker T. Cytoscape: a software environment for integrated models of biomolecular interaction networks. Genome Res. 2003, 13, 2498–504. [DOI] [PMC free article] [PubMed] [Google Scholar]
- Hanahan D.; Weinberg R. A. Hallmarks of cancer: the next generation. Cell 2011, 144, 646–74. [DOI] [PubMed] [Google Scholar]
- Le A.; Rajeshkumar N. V.; Maitra A.; Dang C. V. Conceptual framework for cutting the pancreatic cancer fuel supply. Clin. Cancer Res. 2012, 18, 4285–90. [DOI] [PMC free article] [PubMed] [Google Scholar]
- Spratlin J. L.; Serkova N. J.; Eckhardt S. G. Clinical applications of metabolomics in oncology: a review. Clin. Cancer Res. 2009, 15, 431–40. [DOI] [PMC free article] [PubMed] [Google Scholar]
- Williams R.; Lenz E. M.; Wilson A. J.; Granger J.; Wilson I. D.; Major H.; Stumpf C.; Plumb R. A multi-analytical platform approach to the metabonomic analysis of plasma from normal and Zucker (fa/fa) obese rats. Mol. BioSyst. 2006, 2, 174–83. [DOI] [PubMed] [Google Scholar]
- Pancreatic cancer; American Cancer Society: Atlanta, GA, 2014; http://www.cancer.org/acs/groups/cid/documents/webcontent/003131-pdf.pdf.
- Schrader H.; Menge B. A.; Belyaev O.; Uhl W.; Schmidt W. E.; Meier J. J. Amino acid malnutrition in patients with chronic pancreatitis and pancreatic carcinoma. Pancreas 2009, 38, 416–21. [DOI] [PubMed] [Google Scholar]
- Yamanouchi T.; Akanuma Y. Serum 1,5-anhydroglucitol (1,5 AG): new clinical marker for glycemic control. Diabetes Res. Clin. Pract. 1994, 24, S261–8. [DOI] [PubMed] [Google Scholar]
- Meier R. F.; Beglinger C. Nutrition in pancreatic diseases. Best Pract. Res., Clin. Gastroenterol. 2006, 20, 507–29. [DOI] [PubMed] [Google Scholar]
- Herner A.; Sauliunaite D.; Michalski C. W.; Erkan M.; De Oliveira T.; Abiatari I.; Kong B.; Esposito I.; Friess H.; Kleeff J. Glutamate increases pancreatic cancer cell invasion and migration via AMPA receptor activation and Kras-MAPK signaling. Int. J. Cancer 2011, 129, 2349–59. [DOI] [PubMed] [Google Scholar]
- Cheng L. L.; Anthony D. C.; Comite A. R.; Black P. M.; Tzika A. A.; Gonzalez R. G. Quantification of microheterogeneity in glioblastoma multiforme with ex vivo high-resolution magic-angle spinning (HRMAS) proton magnetic resonance spectroscopy. Neuro-Oncology 2000, 2, 87–95. [DOI] [PMC free article] [PubMed] [Google Scholar]
- Su K. H.; Cuthbertson C.; Christophi C. Review of experimental animal models of acute pancreatitis. HPB 2006, 8, 264–86. [DOI] [PMC free article] [PubMed] [Google Scholar]
- Lusczek E. R.; Paulo J. A.; Saltzman J. R.; Kadiyala V.; Banks P. A.; Beilman G.; Conwell D. L. Urinary 1H-NMR metabolomics can distinguish pancreatitis patients from healthy controls. J. Pancreas 2013, 14, 161–70. [DOI] [PMC free article] [PubMed] [Google Scholar]
Associated Data
This section collects any data citations, data availability statements, or supplementary materials included in this article.