

Abstract
Although apolipoprotein E (APOE) variants are associated with age-related diseases, the underlying mechanism is unknown and DNA methylation may be a potential one. With methylation data, measured by the Infinium Human Methylation 450 array, from 993 participants (age ranging from 18 to 87 years) in the Genetics of Lipid Lowering Drugs and Diet Network (GOLDN) study, and from Encyclopedia of DNA Elements (ENCODE) consortium, combined with published methylation datasets, we described the methylation pattern of 13 CpG sites within APOE locus, their correlations with gene expression across cell types, and their relationships with age, plasma lipids, and sequence variants. Based on methylation levels and the genetic regions, we categorized the 13 APOE CpG sites into three groups: Group 1 showed hypermethylation (> 50%) and were located in the promoter region, Group 2 exhibited hypomethylation (< 50%) and were located in the first two exons and introns, and Group 3 showed hypermethylation (> 50%) and were located in the exon 4. APOE methylation was negatively correlated with gene expression (minimum r = −0.66, P = 0.004). APOE methylation was significantly associated with age (minimum P = 2.06E-08) and plasma total cholesterol (minimum P = 3.53E-03). Finally, APOE methylation patterns differed across APOE ε variants (minimum P = 3.51E-05) and the promoter variant rs405509 (minimum P = 0.01), which further showed a significant interaction with age (P = 0.03). These findings suggest that methylation may be a potential mechanistic explanation for APOE functions related to aging and call for further molecular mechanistic studies.
Keywords: apolipoprotein E, age, DNA methylation, variants, epidemiology, interaction
Introduction
Apolipoprotein E (ApoE, encoded by the APOE gene), a protein involved in both exogenous and endogenous lipid metabolism, plays a significant role in the process of age-related diseases, including cardiovascular diseases, Alzheimer's disease, and age-related macular disease (Ang et al., 2008). While the vast majority of studies have investigated relationships between APOE sequence variants and age-related diseases (Davignon et al., 1988; Saunders et al., 1996; Klaver et al., 1998; Ward et al., 2009), current studies on the relationship between aging and methylation pattern APOE are limited. One small-scale study suggested that the differences in APOE methylation between brains with late-onset Alzheimer's disease and normal brains increase with age (Wang et al., 2008). The effect of aging on APOE methylation is highly plausible based on the general link between DNA methylation and aging. For example, nearly every step of cellular development and differentiation involves DNA methylation changes (Cedar & Bergman, 2012). DNA methylation has also been shown to be associated with age-related diseases (Johnson et al., 2012). Furthermore, methylation of APOE was shown to be functional as it is modified by environmental factors such as folate (Yi-Deng et al., 2007; Glier et al., 2014) and correlates with clinical phenotypes in some (Turan et al., 2012) but not all studies (Sharma et al., 2008).
In light of the potential shared relationship with aging that appears to link APOE sequence variants and APOE methylation, along with the observation that sequence variants may actually alter methylation status (Zhi et al., 2013), we propose that studying the two phenomena in combination may be especially informative. Specifically, three functional single nucleotide polymorphisms (SNPs) may modify DNA methylation at the APOE locus. The first SNP, rs405509, is located in the promoter region. The variant of this SNP was postulated to increase DNA methylation based on its demonstrated decreasing effect on gene transcription (Artiga et al., 1998), the main functional effect of DNA methylation (Lindahl, 1981). The other two SNPs are rs429358 and rs7412, which define the ε2/ε3/ε4 isoforms of ApoE and both are located within exon 4. These two SNPs are hypothesized to change DNA methylation as well, not only because they are located within the CpG island contained in the exon 4, but also because both are CpG-related SNPs (the cytosine allele forms a CpG dinucleotide while the thymine allele disrupts it).
Using data from 993 participants of the Genetics of Lipid Lowering Drugs and Diet Network (GOLDN) study, publically available data from Encyclopedia of DNA Elements (ENCODE) consortium, and previously open-published datasets, we described the general methylation pattern of the 13 CpG sites distributed along the entire APOE locus, which were available in the Infinium Human Methylation 450 array. With the data from ENCODE consortium, we analyzed the relationship between APOE methylation and gene expression across different cell types. Finally, we utilized the GOLDN population to explore (i) whether age is associated with APOE methylation, (ii) whether the effects of age on APOE methylation leads to changes in plasma lipids, the main functional phenotype of APOE, and (iii) whether the effect of age on APOE methylation can be modulated by methylation-related genetic variants in the APOE locus.
Results
Population characteristics of GOLDN by age
Population characteristics were compared across age quintiles (Table1). Gender distribution did not differ across age quintiles. Compared to the younger age quintiles, the older quintiles tended to contain fewer smokers (P = 0.004) but more individuals with a past history of taking antilipemic medications (P < 0.0001). Also, those individuals in the older age quintiles tended to consume less total energy, vitamin B12, and folate (P ≤ 0.0001).
Table 1.
Subject characteristics of GOLDN by age quintiles*
| Age quintiles |
||||||
|---|---|---|---|---|---|---|
| Variable | Q1 | Q2 | Q3 | Q4 | Q5 | P for trend† |
| Age (year)‡ | 24 (18–34) | 40 (35–43) | 47 (44–51) | 57 (52–64) | 71 (65–87) | – |
| N | 200 | 185 | 204 | 209 | 195 | – |
| Men | 88 (44.0) | 98 (53.0) | 96 (47.1) | 99 (47.4) | 94 (48.2) | 0.64 |
| Current smoker | 17 (8.5) | 18 (9.7) | 21 (10.3) | 13 (6.2) | 4 (2.1) | 0.004 |
| Ever drinker | 79 (39.5) | 101 (54.6) | 104 (51.0) | 102 (48.8) | 95 (48.7) | 0.16 |
| Total energy intake (kcal day−1) | 2448 (1758) | 2228 (1202) | 2169 (981) | 2037 (925) | 1746 (809) | < 0.0001 |
| Vitamin B12 intake (μg day−1) | 6.1 (4.4) | 5.4 (3.3) | 5.3 (3.0) | 5.3 (2.9) | 4.7 (3.3) | 0.0001 |
| Folate intake (μg day−1) | 467.0 (315.7) | 411.9 (237.7) | 398.2 (171.4) | 398.5 (187.1) | 362.9 (166.5) | < 0.0001 |
| History of taking antilipemic medications | 0 (0.0) | 2 (1.1) | 1 (0.5) | 14 (6.7) | 20 (10.3) | < 0.0001 |
Data are means (standard deviation) or n (%).
Mantel–Haenszel χ2 tests and ANOVA tests were applied to obtain P-values for trend of categorical and continuous variables, respectively, according to the median of age in each quintile.
Data are median age (minimum age–maximum age) within each quintile.
APOE methylation patterns are similar in blood lymphocytes and other cell types
We examined the methylation status of 13 CpG sites distributed along the entire APOE using data from GOLDN, ENCODE, and previous publications. The genetic structure of APOE locus is illustrated in Fig.1A. Based on both the methylation levels in GOLDN and genetic locations (Fig.1B), three groups of CpG sites can be distinguished. Specifically, the first three CpG sites comprised a group (Group 1) that was both hypermethylated (all sites > 50% methylation) and located within the promoter region. The second group of CpG sites (Group 2, sites 4–9) was both hypomethylated (all sites < 50%) and located in the 5′ part of the gene. The third group (Group 3, sites 10–13) was both hypermethylated (all sites > 50%) and located at the 3′ end of the gene. This categorization of the 13 CpG sites into three groups was also suggested by the heat map of GOLDN (Figure S1).
Figure 1.

Gene structure and methylation pattern of APOE measured in blood T lymphocyte in GOLDN and other cell types in public datasets. Panel A shows the structure of APOE gene. The arrow represents the direction of the gene, and filled rectangles represent exons. Panels B and C show the mean of APOE methylation (%) for each of the 13 CpG sites measured in blood T lymphocytes in GOLDN and across different cell types in public datasets.
To explore the generalizability of the blood T lymphocyte used in GOLDN, we compared the APOE methylation patterns of these 13 CpG sites found in GOLDN (presented as the first bar in Fig.1C) with those measured across different cell types (presented as the bars starting from the second in Fig.1C), including primary cells from tissues of brain, saliva, fat, muscle, and liver, and 61 cell lines from tissues of brain, blood, breast, colon, epithelia, skin, muscle, heart, kidney, lung, ovary, pancreas, blood vessel, and prostate (Table S1). In general, APOE methylation patterns are similar across different cell types by consistently showing that the methylation levels of the CpG sites within Group 2 are lower than those of the sites located within Group 1 and Group 3. Consistently, across all the cell types, CpG sites within Group 3 have hypermethylation levels (all sites > 50%) and those sites in Group 2 have hypomethylation levels (almost all sites < 50%). Methylation levels of the CpG sites within Group 1 showed variation across cell types, which have hypermethylation (> 50%) in tissues of brain and saliva, but hypomethylation (< 50%) in tissues of fat, muscle, and skin. Despite these variations in Group 1, cell type-specific heat maps consistently suggested that these 13 CpG sites can be categorized into three distinct groups (Figures S2–S6).
APOE methylation patterns are correlated with APOE gene expression
We extended our analyses in ENCODE by evaluating the relationship between CpG methylation and gene expression across 17 cell types with data available for both gene expression and methylation. Methylation of four CpG sites, distributed across three methylation groups identified above, was negatively correlated with gene expression (Table2). Two CpG sites within Group 1, CpG 2 (cg04406254) and CpG 3 (cg01032398), showed the strongest correlation with gene expression, with Pearson's correlation coefficients of −0.66 (P = 0.004) and −0.62 (P = 0.008), respectively. In Group 2, CpG 7 (cg18768621) had a borderline significance (P = 0.05) with a coefficient of −0.48. In Group 3, CpG 12 (cg18799241) was negatively correlated with a coefficient of −0.51 (P = 0.04).
Table 2.
Correlations between APOE methylation and APOE gene expression in ENCODE
| CpG group* | CpG # | CpG name | Pearson's correlation coefficients | P |
|---|---|---|---|---|
| Group 1 | CpG 1 | cg14123992 | −0.45 | 0.07 |
| CpG 2 | cg04406254 | −0.66 | 0.004 | |
| CpG 3 | cg01032398 | −0.62 | 0.008 | |
| Group 2 | CpG 4 | cg26190885 | −0.17 | 0.52 |
| CpG 5 | cg12049787 | −0.33 | 0.20 | |
| CpG 6 | cg08955609 | −0.16 | 0.53 | |
| CpG 7 | cg18768621 | −0.48 | 0.05 | |
| CpG 8 | cg19514613 | −0.40 | 0.11 | |
| CpG 9 | cg06750524 | −0.28 | 0.28 | |
| Group 3 | CpG 10 | cg16471933 | 0.39 | 0.12 |
| CpG 11 | cg05501958 | 0.21 | 0.43 | |
| CpG 12 | cg18799241 | −0.51 | 0.04 | |
| CpG 13 | cg21879725 | 0.30 | 0.25 |
CpG groups were defined according to both the methylation level and region of the gene.
APOE methylation patterns are associated with age
We next evaluated relationships between age and APOE methylation by examining methylation of the 13 CpG sites occurring within the three distinct methylation groups (Group 1, Group 2, and Group 3), as described above. Age was significantly associated with methylation of at least one CpG site in each group (Table3). For example, age was significantly negatively associated with DNA methylation values for all three CpG sites in Group 1 including CpG 1 (cg14123992), CpG 2 (cg04406254), and CpG 3 (cg01032398) (P = 8.00E-05, 2.06E-08, and 1.16E-04, respectively). However, age was significantly positively associated with methylation of CpG 8 (cg19514613) (P = 0.004), one CpG site in Group 2. For Group 3, age was significantly negatively associated with methylation of CpG 10 (cg16471933) (P = 0.04). Significant relationships were not altered in the secondary analyses adjusted for smoking, drinking, total energy intake, physical activity, vitamin B12 intake, folate intake, hormone replacement therapy in women, history of taking antilipemic medications, and time of fasting blood drawn (data not shown).
Table 3.
APOE methylation patterns and plasma lipids by age quintiles in GOLDN*
| Age quintiles† |
|||||||||
|---|---|---|---|---|---|---|---|---|---|
| Q1 | Q2 | Q3 | Q4 | Q5 | |||||
| 24 (18–34) years | 40 (35–43) years | 47 (44–51) years | 57 (52–64) years | 71 (65–87) years | |||||
| Outcomes | CpG group | CpG # | CpG name | n = 200 | n = 185 | n = 204 | n = 209 | n = 195 | P ‡ |
| APOE methylation (%) | Group 1 | CpG 1 | cg14123992 | 88.13 (0.45) | 85.32 (0.83) | 86.07 (0.61) | 85.72 (0.42) | 84.46 (0.62) | 8.00E-05 |
| CpG 2 | cg04406254 | 72.36 (0.24) | 70.62 (0.35) | 70.75 (0.33) | 70.29 (0.34) | 69.90 (0.27) | 2.06E-08 | ||
| CpG 3 | cg01032398 | 82.80 (0.18) | 81.58 (0.45) | 82.22 (0.22) | 81.96 (0.23) | 81.39 (0.23) | 1.16E-04 | ||
| Group 2 | CpG 4 | cg26190885 | 9.17 (0.10) | 9.30 (0.09) | 9.32 (0.08) | 9.44 (0.08) | 9.33 (0.08) | 0.11 | |
| CpG 5 | cg12049787 | 6.63 (0.24) | 7.13 (0.42) | 6.94 (0.35) | 6.80 (0.19) | 7.02 (0.23) | 0.44 | ||
| CpG 6 | cg08955609 | 3.79 (0.11) | 5.38 (0.77) | 4.83 (0.59) | 4.69 (0.44) | 4.69 (0.42) | 0.19 | ||
| CpG 7 | cg18768621 | 11.39 (0.86) | 14.77 (1.23) | 11.98 (0.81) | 12.76 (1.12) | 13.70 (1.10) | 0.30 | ||
| CpG 8 | cg19514613 | 13.13 (0.15) | 13.21 (0.22) | 13.40 (0.15) | 13.92 (0.20) | 13.61 (0.18) | 0.004 | ||
| CpG 9 | cg06750524 | 24.78 (0.25) | 25.75 (0.51) | 25.51 (0.42) | 25.35 (0.35) | 24.66 (0.27) | 0.60 | ||
| Group 3 | CpG 10 | cg16471933 | 80.97 (0.35) | 79.51 (0.49) | 80.01 (0.50) | 80.28 (0.37) | 79.54 (0.39) | 0.04 | |
| CpG 11 | cg05501958 | 96.29 (0.11) | 95.17 (0.60) | 95.41 (0.50) | 95.65 (0.37) | 95.98 (0.09) | 0.62 | ||
| CpG 12 | cg18799241 | 87.27 (0.87) | 83.57 (1.27) | 86.23 (0.86) | 86.49 (1.08) | 85.62 (1.08) | 0.68 | ||
| CpG 13 | cg21879725 | 84.22 (1.15) | 80.46 (1.37) | 83.64 (1.02) | 83.74 (1.20) | 82.12 (1.24) | 0.62 | ||
| Plasma lipids | TC (mg dL−1) | 164.10 (2.81) | 186.92 (2.37) | 191.59 (2.21) | 198.47 (2.57) | 188.96 (2.87) | 1.04E-07 | ||
| LDL-c (mg dL−1) | 104.09 (2.57) | 120.23 (2.20) | 121.90 (1.91) | 127.20 (2.20) | 116.65 (2.32) | 2.00E-04 | |||
| HDL-c (mg dL−1) | 46.32 (0.90) | 48.58 (0.85) | 48.63 (0.90) | 48.74 (0.94) | 49.63 (0.95) | 0.01 | |||
| TG (mg dL−1) | 87.02 (1.05) | 105.94 (1.05) | 114.35 (1.05) | 132.17 (1.04) | 127.43 (1.05) | 1.94E-08 | |||
Data are the least square means (standard error of the means) of outcomes adjusted for the covariates below;
Median age (minimum age–maximum age) within each quintile were presented;
P:P-value for the association of age (quintile) with APOE methylation patterns and plasma lipids, adjusting for pedigree, sex, center, and the first principal component of cellular purity and population structure.
APOE methylation patterns may act as the intermediate factors of the effects of age on blood lipids
We confirmed the known effects of age on plasma lipids in GOLDN (Table3) by showing that those individuals in the older age quintiles tended to have higher total cholesterol (TC) (P = 1.04E-07), low-density lipoprotein cholesterol (LDL-c) (P = 2.00E-04), high-density lipoprotein cholesterol (HDL-c) (P = 0.01), and triglycerides (TG) (P = 1.94E-08).
We also found that APOE methylation patterns are associated with plasma lipids of TC and LDL-C, the main phenotypes of APOE (Table4). Methylations of six CpG sites from all three CpG groups were significantly associated with plasma TC. Specifically, methylations of CpG sites in Group 1 and Group 2, which were CpG 1 (cg14123992), CpG 2 (cg04406254), CpG 10 (cg16471933), CpG 12 (cg18799241), and CpG 13 (cg21879725), were negatively associated with TC (P < 0.05). Methylation of the CpG site in Group 2, CpG 7 (cg18768621), was positively associated with TC (P = 0.02). For LDL-c, methylation of CpG 9 (cg06750524) had a significantly positive association (P = 0.01).
Table 4.
Associations between APOE methylation patterns and plasma lipids in GOLDN
| TC |
LDL-c |
HDL-c |
TG (log) |
|||||||||||
|---|---|---|---|---|---|---|---|---|---|---|---|---|---|---|
| CpG group | CpG # | CpG name | Coefficient* | SEM* | P † | Coefficient* | SEM* | P † | Coefficient* | SEM* | P † | Coefficient‡ | SEM‡ | P † |
| Group 1 | CpG 1 | cg14123992 | −0.32 | 0.10 | 3.53E−03 | −0.20 | 0.11 | 0.07 | −0.10 | 0.05 | 0.08 | −0.001 | 0.002 | 0.53 |
| CpG 2 | cg04406254 | −0.56 | 0.20 | 0.02 | −0.34 | 0.18 | 0.10 | −0.08 | 0.08 | 0.38 | −0.01 | 0.005 | 0.09 | |
| CpG 3 | cg01032398 | −0.12 | 0.23 | 0.61 | 0.05 | 0.20 | 0.81 | −0.14 | 0.08 | 0.24 | 0.001 | 0.01 | 0.87 | |
| Group 2 | CpG 4 | cg26190885 | 0.37 | 0.89 | 0.67 | 0.25 | 0.75 | 0.74 | 0.29 | 0.31 | 0.35 | 0.01 | 0.01 | 0.72 |
| CpG 5 | cg12049787 | 0.36 | 0.20 | 0.06 | 0.24 | 0.21 | 0.25 | 0.15 | 0.12 | 0.24 | −0.002 | 0.004 | 0.63 | |
| CpG 6 | cg08955609 | 0.14 | 0.13 | 0.30 | 0.16 | 0.13 | 0.26 | 0.03 | 0.04 | 0.45 | −0.001 | 0.003 | 0.68 | |
| CpG 7 | cg18768621 | 0.20 | 0.08 | 0.02 | 0.13 | 0.07 | 0.07 | −0.01 | 0.03 | 0.63 | 0.003 | 0.001 | 0.06 | |
| CpG 8 | cg19514613 | −0.30 | 0.43 | 0.50 | 0.07 | 0.38 | 0.86 | −0.12 | 0.16 | 0.44 | −0.002 | 0.01 | 0.77 | |
| CpG 9 | cg06750524 | 0.35 | 0.17 | 0.06 | 0.45 | 0.15 | 0.01 | −0.02 | 0.06 | 0.70 | 0.001 | 0.00 | 0.74 | |
| Group 3 | CpG 10 | cg16471933 | −0.49 | 0.15 | 0.01 | −0.24 | 0.14 | 0.11 | −0.01 | 0.07 | 0.93 | −0.01 | 0.004 | 0.08 |
| CpG 11 | cg05501958 | −0.28 | 0.12 | 0.09 | −0.29 | 0.11 | 0.09 | −0.04 | 0.05 | 0.39 | −7.70E−05 | 0.003 | 0.98 | |
| CpG 12 | cg18799241 | −0.19 | 0.07 | 0.02 | −0.11 | 0.06 | 0.12 | −0.01 | 0.03 | 0.76 | −0.002 | 0.002 | 0.19 | |
| CpG 13 | cg21879725 | −0.19 | 0.06 | 0.008 | −0.11 | 0.06 | 0.06 | 0.004 | 0.02 | 0.86 | −0.002 | 0.001 | 0.06 | |
Coefficient and SEM represent changes in plasma lipids (mg dL−1) corresponding to 1% increase in DNA methylation adjusing for the covariates below.
P:P-value for the association between DNA methylation (%) and plasma lipids adjusting for pedigree, sex, center, and the first principal component of cellular purity and population structure.
Coefficient and SEM represent changes in log-transformed TG (mg dL−1) corresponding to 1% increase in DNA methylation adjusing for the covariates below.
Based on the observed mutual associations among APOE methylation patterns, age, and plasma lipids, we proposed that the effect of age on blood lipids may partially contributed by the changes in APOE methylation patterns. To test this hypothesis, we first conducted a qualitative analysis by plotting the regression coefficients representing the effects of age on methylation of each CpG site (Fig.2A) and the regression coefficients representing the effects of methylation of each CpG site on TC (Fig.2B). The pattern of the association between age and methylation is moderately parallel to that between methylation and TC, which showed the negative associations for CpG sites in both Group 1 and Group 3, both of which demonstrated hypermethylation, and a positive association for CpG sites in Group 2 which showed hypomethylation. Next, we performed a quantitative analysis to test whether APOE methylation patterns are the intermediate factor between age and TC. We found that regression coefficients of the effect of age on TC became smaller after the regression model included the adjustment for methylation levels of almost all the CpG sites except for site 3 (cg01032398). Also, the likelihood ratio test showed that three CpG sites play a statistically significant role as the intermediate factor between age and TC, which were CpG 4 (cg26190885) (P < 0.0001), CpG 10 (cg16471933) (P = 0.04), and CpG 13 (cg21879725) (P = 0.03).
Figure 2.
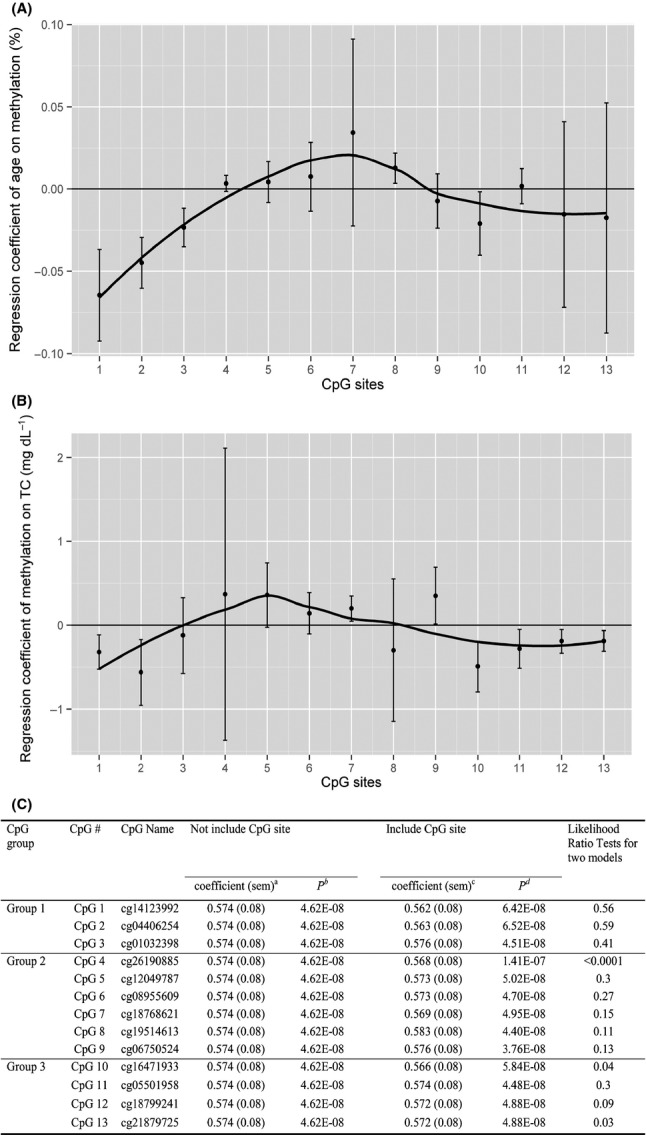
APOE methylation patterns may act as the intermediate factors of the effects of age on blood lipids. Panels A and B provided qualitative evidence by listing 13 CpG sites as x-axis and the y-axis are the regression coeffiecients of age for the outcome of methylation (%) (A) and the regression coefficients of methylation for the outcome of TC (mg dL−1) (B). Black dot represents point estimate of regression coefficient for each CpG site from generalized linear models adjusting for pedigree, gender, study center, and the first principal component of cellular purity and population structure. Lower and upper bars represent the lower and higher values of 95% confidence intervals for each coefficient. Black line is the fitted line for the pattern of all 13 CpG sites. Panel C provided quantitative evidence based on the likelihood ratio test of the differences in the regression coefficients of the effects of age on TC yielded by the model without and with the adjustment of APOE methylation. aCoefficient and SEM, and bP represent the magnitude and significance of the changes in blood total cholesterol (mg dL−1) corresponding to 1 year increase in age adjusting for pedigree, sex, center, and the first principal component of cellular purity and population structure; cCoefficient and SEM, and dP represent the magnitude and significance of the changes in blood total cholesterol (mg dL−1) corresponding to 1 year increase in age with further adjustment for the methylation levels of each CpG site at APOE locus in addition to pedigree, sex, center, and the first principal component of cellular purity and population structure.
APOE methylation patterns are associated with APOE genetic variants
We next explored relationships between APOE methylation and APOE sequence variants. Two CpG sites in Group 2 and Group 3 were significantly associated with APOE ε variants (Table5). For CpG 9 (cg06750524) and CpG 10 (cg16471933), the order for the methylation level is ε2 carriers < ε3/ε3 < ε4 carriers (P = 3.51E-05 and 0.03, respectively). Two other CpG sites had a borderline significance (P = 0.05), which were CpG 8 (cg19514613) and CpG 13 (cg21879725).
Table 5.
APOE methylation patterns by genetic variants in GOLDN*
|
APOE rs405509 |
APOE ε variants |
|||||||||
|---|---|---|---|---|---|---|---|---|---|---|
| CC | AC | AA | ε2 carriers | ε3/ ε3 | ε4 carriers | |||||
| CpG group | CpG # | CpG name | n = 256 | n = 500 | n = 236 | P † | n = 99 | n = 588 | n = 257 | P † |
| Group 1 | CpG 1 | cg14123992 | 85.87 (0.56) | 86.19 (0.35) | 85.52 (0.62) | 0.61 | 86.84 (0.32) | 85.70 (0.41) | 86.14 (0.49) | 0.84 |
| CpG 2 | cg04406254 | 69.96 (0.37) | 71.07 (0.18) | 71.10 (0.26) | 0.02 | 70.36 (0.34) | 70.84 (0.20) | 70.85 (0.30) | 0.42 | |
| CpG 3 | cg01032398 | 81.80 (0.19) | 81.98 (0.22) | 82.23 (0.21) | 0.19 | 82.07 (0.30) | 81.78 (0.19) | 82.43 (0.21) | 0.07 | |
| Group 2 | CpG 4 | cg26190885 | 9.22 (0.08) | 9.34 (0.05) | 9.35 (0.08) | 0.23 | 9.28 (0.11) | 9.38 (0.05) | 9.23 (0.07) | 0.29 |
| CpG 5 | cg12049787 | 6.97 (0.30) | 6.87 (0.18) | 6.89 (0.28) | 0.85 | 6.57 (0.12) | 7.01 (0.18) | 6.83 (0.28) | 0.87 | |
| CpG 6 | cg08955609 | 5.11 (0.57) | 4.61 (0.31) | 4.31 (0.38) | 0.26 | 4.00 (0.08) | 4.80 (0.32) | 4.69 (0.47) | 0.55 | |
| CpG 7 | cg18768621 | 13.45 (0.99) | 13.05 (0.60) | 11.93 (0.74) | 0.24 | 13.56 (1.87) | 13.37 (0.60) | 11.51 (0.59) | 0.11 | |
| CpG 8 | cg19514613 | 13.20 (0.17) | 13.52 (0.11) | 13.61 (0.14) | 0.06 | 13.17 (0.29) | 13.37 (0.11) | 13.72 (0.13) | 0.05 | |
| CpG 9 | cg06750524 | 24.41 (0.38) | 25.52 (0.21) | 25.44 (0.26) | 0.03 | 23.85 (0.29) | 25.05 (0.19) | 26.25 (0.33) | 3.51E-05 | |
| Group 3 | CpG 10 | cg16471933 | 79.53 (0.37) | 80.02 (0.28) | 80.78 (0.30) | 0.01 | 79.07 (0.57) | 80.07 (0.26) | 80.46 (0.29) | 0.03 |
| CpG 11 | cg05501958 | 95.28 (0.49) | 95.71 (0.24) | 96.15 (0.10) | 0.09 | 96.15 (0.11) | 95.67 (0.24) | 95.58 (0.38) | 0.41 | |
| CpG 12 | cg18799241 | 85.34 (0.99) | 85.69 (0.62) | 86.84 (0.74) | 0.24 | 85.15 (1.80) | 85.45 (0.61) | 87.06 (0.58) | 0.13 | |
| CpG 13 | cg21879725 | 82.35 (1.12) | 82.41 (0.72) | 84.45 (0.82) | 0.14 | 81.57 (2.16) | 82.21 (0.72) | 84.68 (0.66) | 0.05 | |
Data are the least square means (standard error of the means) of APOE methylation (%) adjusted for the covariates below.
P:P-value for the association between APOE methylation (%) and genetic variants adjusting for pedigree, sex, center, and the first principal components of cellular purity and population structure.
Promoter SNP rs405509 had significant associations with methylation of CpG 2 (cg04406254) in Group 1, CpG 9 (cg06750524) in Group 2, and CpG 10 in Group 3 (cg16471933) (P = 0.02, 0.03, and 0.01, respectively) (Table5). Homozygotes of the minor allele (AA) had the highest methylation levels for these three CpG sites, while the homozygotes of major allele (CC) had the lowest, with the values for the heterozygotes in the middle.
APOE methylation patterns are modulated by the interactions between age and APOE genetic variants
Finally, we examined genetic variants as potential modulators of the effect of age on APOE methylation. Promoter SNP rs405509 significantly interacted with age to modulate methylation of CpG 3 (cg01032398) (P for interaction = 0.03), a CpG site in Group 1 (Fig.3). For major allele carriers (CC and AC), older age was significantly associated with lower methylation of CpG 3 (P for trend = 0.01 and 0.004, respectively). However, there was no association between age and methylation of CpG 3 in homozygotes for the minor allele (AA) (P for trend = 0.97).
Figure 3.

Interaction between rs405509 and age for methylation of CpG 3 (cg01032398) in GOLDN. Predicted methylation levels of cg01032398 were calculated based on the regression coefficient of the exposure variable (age) for the outcome (methylation) with the adjustment for the covariates of pedigree, sex, center, and the first principle component of cellular purity and population structure. Predicted methylation levels of cg01032398 by genotype of rs405509 were plotted against age, adjusted for pedigree, gender, center, and the first principal component of cellular purity and population structure. P-values indicate the statistical significance of the adjusted interaction term and adjusted regression coefficients in the regression line corresponding to three genotype groups of rs405509 (diamond for CC, square for AC, and triangle for AA).
Discussion
In the current study, we described the methylation patterns of the APOE locus and their correlations with gene expression and observed associations between APOE methylation and age, blood lipids, and sequence variants, as well as an interaction between age and a methylation-associated promoter variant. This is the first study to explore APOE methylation at single nucleotide resolution in a population of almost a thousand individuals.
Our finding that age is associated with APOE methylation is consistent with a previous study by Wang et.al. (Wang et al., 2008), showing that the differences in APOE methylation between individuals with and without Alzheimer's disease increases with age. Other studies demonstrated that age affects global DNA methylation (Fraga et al., 2005). Compared to younger monozygous twins, older twins exhibited greater differences in DNA methylation. This may be a consequence of the fact that DNA methylation is modifiable by environmental factors (Cedar & Bergman, 2012), which accumulate gradually or change continuously with age. In our study, we expected APOE methylation to change with age because APOE is considered an age-related gene. This is based on the genetic associations between APOE variants and many age-related diseases, such as coronary heart disease (Ward et al., 2009), atherosclerosis (Davignon et al., 1988), age-related macular degeneration (AMD) (Klaver et al., 1998), and Alzheimer's disease (Saunders et al., 1996). We also observed that the direction of the age-associated differences in methylation levels appeared to be associated with the existing degree of methylation. Specifically, we observed that greater age was associated with less methylation in hypermethylated regions but with greater methylation in hypomethylated regions. Finally, we obtained both qualitative and quantitative evidence to support the potential biological connections between age, APOE methylation, and plasma lipids by indicating that the effects of age on plasma lipids may partially act through APOE methylation. However, the magnitude of the effect of APOE methylation is small, which may be related to the tiny contribution of the single APOE gene to the entire genome-wide effects of the age on DNA methylation.
Two hypothetical mechanisms for the observed differences in APOE methylation by APOE variants are differential allelic gene expression and changes in the DNA sequence that affect CpG site formation. With respect to the first mechanism, the minor A allele of the promoter SNP rs405509 has been reported to exhibit lower gene transcription compared to the major C allele (Artiga et al., 1998). For the APOE ε variants, mRNA expression for ε3 allele was shown to be greater than that of ε4 (Lambert et al., 1997). Based on the established relationship between DNA methylation and reduced gene expression (Lindahl, 1981), our findings of higher methylation levels for carriers of the rs405509 A allele and ε4 allele in GOLDN are consistent with the lower expression reported in previous studies. The second potential mechanism by which genotype may alter methylation is based on the creation and disruption of CpG sites by nucleotide changes that determine the APOE ε variants. The two SNPs that constitute APOE ε variants are both CpG-related SNPs. That means that individuals with ε3/ε3 genotype have 2 CpG sites created by the homozygous C alleles for rs7412, ε2 carriers have either 0 or 1 CpG site created by the heterozygous C allele for rs7412, and ε4 carriers have either 3 or 4 CpG sites created by the homozygous C alleles of rs7412 and the heterozygous or the homozygous C alleles of rs429358. Based on the recognition that most DNA methylation in the mammalian genome occurs on CpG sites (Lister et al., 2009), the density of CpG sites is likely to affect the local DNA methylation patterns. The fact that ε4 carriers have the greatest number of CpG sites while ε2 carriers have the smallest number with ε3/ε3 in the middle is consistent with our finding that methylation levels for most CpG sites are in the order of ε4 carriers > ε3/ε3 > ε2 carriers.
In light of our findings that both age and APOE genotype were related to methylation, a logical next step was to examine whether these two factors might act in combination to alter methylation. Our observation that promoter SNP rs405509 significantly modified the association between age and promoter methylation is novel and plausible. Greater age was associated with less promoter methylation in the carriers of the major allele (CC and AC) but not in the homozygotes of the minor allele (AA), such that methylation of those in the AA group remained high regardless of age. This age-related allelic difference in methylation level may provide mechanistic support for previous findings linking the A allele of rs405509 to greater risk of myocardial infarction (Lambert et al., 2000), premature coronary heart disease (Viitanen et al., 2001), and Alzheimer's disease (Lambert et al., 1998), but lower plasma concentration of ApoE (Lambert et al., 2000).
This study had a number of limitations. Based on the cross-sectional study design, we cannot establish causality. Further mechanistic studies are necessary. The measurement of APOE methylation in circulating CD4+ T lymphocytes may provide a limited perspective on a protein with multiple functions. However, the observed consistent methylation patterns across different cell types increases the generalizability of our findings. Also, measurements of APOE in circulating cells may not provide direct evidence for age-related diseases, but circulating APOE could provide indirect evidence through their demonstrated effects on plasma lipids. In addition, circulating APOE may act as a biomarker of the changes in the neuronal systems based on our findings of the highly similar methylation patterns between blood T lymphocytes and brain tissues. Finally, the selected 13 CpG sites may not represent the methylation pattern of the whole APOE, but the usual highly correlated methylation status of the nearby CpG sites (Shoemaker et al., 2010) and the consistent methylation patterns between our observation and previous publication with higher coverage may ameliorate this limitation to some extent.
In summary, we characterized thirteen CpG sites at the APOE locus into three groups based on their genetic locations and methylation status measured in both primary T cells in GOLDN and a wide array of other cell types obtained through ENCODE and previous publications and observed that most of these sites were negatively correlated with APOE gene expression based on ENCODE data. With a large population in GOLDN, we found that age was indeed associated with APOE methylation and linked those associations to changes in plasma lipid profile. Furthermore, we observed that methylation-associated genetic variants of APOE modified the aging effect on methylation. Our findings are novel and consistent with the previous evidence from genetic studies and may provide potential mechanistic explanations for aging-related functions of APOE.
Experimental procedures
Study population
The GOLDN study was designed to evaluate genetic factors that modulate plasma lipid responses to a diet intervention (consumption of a high-fat meal) and fenofibrate treatment. GOLDN participants are of European ancestry and were enrolled from the National Heart, Lung, and Blood Institute Family Heart Study (Higgins et al., 1996). This GOLDN analysis included 475 men and 518 women (age ranged from 18 to 87 years) who have baseline data for all required variables. The detailed design and methodology of GOLDN has been described (Corella et al., 2007). Of relevance for this analysis, GOLDN required all subjects with a history of antilipemic drug use to be off all antilipemic medications for at least 4 weeks prior to their study visit. The protocol for this study was approved by the Human Studies Committee of Institutional Review Board at the University of Minnesota, University of Utah, and Tufts University/New England Medical Center. Written informed consent was obtained from all participants. Fasting blood samples were collected to measure the lipid profile, and detailed methodology was described previously (Tsai et al., 2005). Dietary intake was estimated using the diet history questionnaire (Subar et al., 2001; Thompson et al., 2002). Physical activity was assessed by a questionnaire containing questions on the number of hours per day dedicated to different levels (heavy, slight, and sedentary) of activity (Corella et al., 2011).
Genotyping and methylation measurements
Genomic DNA for sequence genotyping was extracted from blood samples using Gentra Puregene Blood Kits (Gentra Systems, Inc., Minneapolis, MN, USA). Genotypes of 3 SNPs included in the current study, which were rs405509, rs429358, and rs7412, were obtained using TaqMan assays on a ABI 7900HT system (Applied Biosystems, Foster City, CA, USA). APOE genotypes were called on the basis of the guidelines of Hixson and Vernier (Hixson & Vernier, 1990) according to the genotypes of rs429358 and rs7412.
Detailed methodology to measure DNA methylation was described previously (Absher et al., 2013). CD4+ T cells for methylation measurement were extracted from baseline frozen buffy coat samples isolated from peripheral blood using positive selection (Invitrogen, Grand Island, NY, USA) followed by sorting of subsets by flow cytometry (FACSAriaII, BD Biosciences, San Jose, CA, USA). Cells were then lysed, and DNA was extracted using QIAGEN DNAeasy kits (QIAGEN, Germantown, MD, USA). DNA sample (500 ng) was treated with sodium bisulfite using Zymo EZ DNA methylation kit (Zymo Research Corporation, Irvine, CA, USA). DNA methylation was measured by the Infinium Human Methylation 450K BeadChip (Illumina, San Diego, CA, USA) through amplification, hybridization, and imaging steps. Intensity files were generated and analyzed with Illumina's GenomeStudio, through which beta scores and ‘detection P-values’ were generated. These beta scores represent the proportion of total signal from the methylation-specific probe or color channel. The ‘detection P-values’ were defined as the probability that the total intensity for a given probe falls within the background signal intensity. Those CpG probes with ‘detection P-values’ greater than 0.01 and with more than 10% of samples that failed to yield adequate intensity were eliminated from further analysis. Those samples with more than 1.5% missing data points across ∼470,000 autosomal CpGs were removed. After quality control, 13 CpG sites related to APOE remained. Starting from the 5′, the first four CpG sites (cg14123992, cg04406254, cg01032398, and cg26190885) were located within 1.5 kb before the transcription start site, the fifth CpG site (cg12049787) was within the first exon, the next three CpG sites (cg08955609, cg18768621, and cg19514613) were within the first intron, the ninth CpG site (cg06750524) was within the second intron, and the last four CpG sites (cg16471933, cg05501958, cg18799241, and cg21879725) were within the fourth exon.
DNA methylation datasets
Methylation levels of all 13 CpG sites for 61 cell lines and one primary liver cell in ENCODE were downloaded (September 20, 2013) from UCSC genome browser HAIB Methyl450 track (http://hgdownload.cse.ucsc.edu/goldenPath/hg19/encodeDCC/wgEncodeHaibMethyl450/) and represented by a heat map using R packages of ‘gplots’ (http://cran.r-project.org/web/packages/gplots/index.html) and ‘RColorBrewer’ (http://cran.r-project.org/web/packages/RColorBrewer/index.html). The score of the methylation value associated with each CpG site was defined as the beta value multiplied by 1000, with the beta value in turn defined as the proportion of the intensity value from the methylated bead type from the sum of the intensity values from both methylated and unmethylated bead type plus 100.
Published methylation data of primary cells from tissues of brain (Day et al., 2013; Kozlenkov et al., 2014; Wockner et al., 2014), muscle (Ribel-Madsen et al., 2012; Day et al., 2013; Zykovich et al., 2013), fat (Ribel-Madsen et al., 2012; Grundberg et al., 2013), and saliva (Liu et al., 2010; Bocklandt et al., 2011; Souren et al., 2013; Park et al., 2014) were obtained through Gene Expression Omnibus (GEO) (http://www.ncbi.nlm.nih.gov/geo/) (Edgar et al., 2002) and ArrayExpress (http://www.ebi.ac.uk/arrayexpress/) (Rustici et al., 2012).
Gene expression in ENCODE
Gene expression data for APOE in 17 cell lines, which also had methylation data available, in ENCODE were downloaded (11-08-2013) from UCSC genome browser Duke Affymetrix Exon Array track (http://hgdownload.cse.ucsc.edu/goldenPath/hg19/encodeDCC/wgEncodeDukeAffyExon/). This track displayed exon array data that had been aggregated to the gene level for those probes that had been linked to genes. The expression score for each cell line represented a linearly scaled value for that particular cell type multiplied by 100 and ranged from 0 to 1000.
Statistical methods
In ENCODE data, Pearson's correlation analysis was conducted to test the correlations between methylation of each CpG site and gene expression of APOE. In GOLDN, Mantel–Haenszel χ2 tests and ANOVA tests were used to examine the trend of significance in characteristics of the study population, as categorical and continuous variables, respectively, by age, categorized in quintiles. Generalized linear models were used to test the association of methylation of each CpG site with age (continuous variable), blood lipids, and APOE genotypes, and the interaction between age (continuous variable) and selected variants. Each CpG site was included into the model separately. APOE ε variants were coded into three categories, ε3/ε3, ε2 carriers (including ε2/ε2 and ε2/ε3), and ε4 carriers (including ε4/ε4 and ε3/ε4). Individuals with the ε2/ ε4 genotype (n = 46) were excluded from the analysis to distinguish the distinct role of each variant. The primary analysis was adjusted for pedigree, sex, study center, and the first principal component of both cellular purity (Frazier-Wood et al., 2014) and population structure. To test the effect of other potential confounders, the secondary analysis was adjusted for smoking (never smoker, past smoker, and current smoker), drinking (ever drink alcohol or not), total energy intake (kcal day−1), physical activity (hours of total physical activity day−1), vitamin B12 intake (μg day−1), folate intake (μg day−1), hormone replacement therapy in women, a history of taking antilipemic medication, and time of fasting blood drawn (am or pm) (Reddy & Reddy, 1990; Armstrong et al., 2013). Likelihood ratio tests were conducted to analyze whether the effects of age on plasma TC is partially through methylation of APOE. Each continuous variable was tested for normality, and log-transformations were performed for those variables not following a normal distribution. Correlation analysis with data from ENCODE consortium and all data analysis with GOLDN population were performed using sas (version 9.3 for Windows; SAS Institute, Inc. Cary, NC, USA). Considering the main hypothesis is the general pattern of APOE methylation rather than the specific CpG site, a two-tailed P-value of < 0.05 was considered statistically significant.
Acknowledgments
We thank all the investigators and participants of the ENCODE consortium, and the datasets used in the current study through the GEO and ArrayExpress, for their generosity to make their data publically available.
Author contributions
J.M.O. is the primary investigator for the genotyping of the GOLDN Study. D.K.A. is the primary investigator for phenotyping of GOLDN population. D.M.A. is the primary investigator for methylation measurements of GOLDN population. Y.M. contributed to study design, genotyping, data analysis, results interpretation, and manuscript writing. C.E.S. contributed to results interpretation and manuscript editing. C.Q.L., M.R.I., and Y.C.L. contributed to the genotyping and manuscript editing. L.D.P., L.P., S.A., S.A.C., M.Y.T., I.B.B., E.K.K., and S.B. contributed to critical manuscript review and editing.
Funding
This study is funded by National Heart Lung and Blood Institute Grant U01HL072524-04 and 5R01HL1043135-04, and the National Institute of Neurological Disorders and Stroke Grant T32NS054584. C. Smith is supported by K08 HL112845. Mention of trade names or commercial products in this publication is solely for the purpose of providing specific information and does not imply recommendation or endorsement by the US Department of Agriculture. The USDA is an equal opportunity provider and employer. This material is based upon work supported by the USDA, under agreement No. 58-1950-0-014. Any opinions, findings, conclusion, or recommendations expressed in this publication are those of the authors and do not necessarily reflect the view of the USDA.
Conflict of interests
The authors have no competing interests.
Supporting Information
Additional Supporting Information may be found in the online version of this article at the publisher's web-site.
Table S1 Cell types and tissues included in the current study.
Fig. S1 Heat map of APOE methylation patterns measured in the blood T lymphocyte in GOLDN. The pink represents hypermethylation (> 50%), the green represents hypomethylation (< 50%), and the gray represents missing value.
Fig. S2 Heat map of APOE methylation patterns measured in the primary brain tissue. The pink represents hypermethylation (> 50%), the green represents hypomethylation (< 50%), and the gray represents missing value.
Fig. S3 Heat map of APOE methylation patterns measured in the primary saliva tissue. The pink represents hypermethylation (> 50%), the green represents hypomethylation (< 50%), and the gray represents missing value.
Fig. S4 Heat map of APOE methylation patterns measured in the primary adipose tissue. The pink represents hypermethylation (> 50%), the green represents hypomethylation (< 50%), and the gray represents missing value.
Fig. S5 Heat map of APOE methylation patterns measured in the primary muscle. The pink represents hypermethylation (> 50%), the green represents hypomethylation (< 50%), and the gray represents missing value.
Fig. S6 Heat map of APOE methylation patterns measured in primary hepatocyte and 61 cell lines in ENCODE. The pink represents hypermethylation (> 50%), the green represents hypomethylation (< 50%), and the gray represents missing value.
References
- Absher DM, Li X, Waite LL, Gibson A, Roberts K, Edberg J, Chatham WW, Kimberly RP. Genome-wide DNA methylation analysis of systemic lupus erythematosus reveals persistent hypomethylation of interferon genes and compositional changes to CD4 + T-cell populations. PLoS Genet. 2013;9:e1003678. doi: 10.1371/journal.pgen.1003678. [DOI] [PMC free article] [PubMed] [Google Scholar]
- Ang LS, Cruz RP, Hendel A, Granville DJ. Apolipoprotein E, an important player in longevity and age-related diseases. Exp. Gerontol. 2008;43:615–622. doi: 10.1016/j.exger.2008.03.010. [DOI] [PubMed] [Google Scholar]
- Armstrong VL, Rakoczy S, Rojanathammanee L, Brown-Borg HM. Expression of DNA methyltransferases is influenced by growth hormone in the long-living Ames dwarf mouse in vivo and in vitro. J. Gerontol. A Biol. Sci. Med. Sci. 2013;69:923–933. doi: 10.1093/gerona/glt133. [DOI] [PMC free article] [PubMed] [Google Scholar]
- Artiga MJ, Bullido MJ, Sastre I, Recuero M, Garcia MA, Aldudo J, Vazquez J, Valdivieso F. Allelic polymorphisms in the transcriptional regulatory region of apolipoprotein E gene. FEBS Lett. 1998;421:105–108. doi: 10.1016/s0014-5793(97)01543-3. [DOI] [PubMed] [Google Scholar]
- Bocklandt S, Lin W, Sehl ME, Sanchez FJ, Sinsheimer JS, Horvath S, Vilain E. Epigenetic predictor of age. PLoS ONE. 2011;6:e14821. doi: 10.1371/journal.pone.0014821. [DOI] [PMC free article] [PubMed] [Google Scholar]
- Cedar H, Bergman Y. Programming of DNA methylation patterns. Annu. Rev. Biochem. 2012;81:97–117. doi: 10.1146/annurev-biochem-052610-091920. [DOI] [PubMed] [Google Scholar]
- Corella D, Arnett DK, Tsai MY, Kabagambe EK, Peacock JM, Hixson JE, Straka RJ, Province M, Lai CQ, Parnell LD, Borecki I, Ordovas JM. The -256T>C polymorphism in the apolipoprotein A-II gene promoter is associated with body mass index and food intake in the genetics of lipid lowering drugs and diet network study. Clin. Chem. 2007;53:1144–1152. doi: 10.1373/clinchem.2006.084863. [DOI] [PubMed] [Google Scholar]
- Corella D, Arnett DK, Tucker KL, Kabagambe EK, Tsai M, Parnell LD, Lai CQ, Lee YC, Warodomwichit D, Hopkins PN, Ordovas JM. A high intake of saturated fatty acids strengthens the association between the fat mass and obesity-associated gene and BMI. J. Nutr. 2011;141:2219–2225. doi: 10.3945/jn.111.143826. [DOI] [PMC free article] [PubMed] [Google Scholar]
- Davignon J, Gregg RE, Sing CF. Apolipoprotein E polymorphism and atherosclerosis. Arteriosclerosis. 1988;8:1–21. doi: 10.1161/01.atv.8.1.1. [DOI] [PubMed] [Google Scholar]
- Day K, Waite LL, Thalacker-Mercer A, West A, Bamman MM, Brooks JD, Myers RM, Absher D. Differential DNA methylation with age displays both common and dynamic features across human tissues that are influenced by CpG landscape. Genome Biol. 2013;14:R102. doi: 10.1186/gb-2013-14-9-r102. [DOI] [PMC free article] [PubMed] [Google Scholar]
- Edgar R, Domrachev M, Lash AE. Gene Expression Omnibus: NCBI gene expression and hybridization array data repository. Nucleic Acids Res. 2002;30:207–210. doi: 10.1093/nar/30.1.207. [DOI] [PMC free article] [PubMed] [Google Scholar]
- Fraga MF, Ballestar E, Paz MF, Ropero S, Setien F, Ballestar ML, Heine-Suner D, Cigudosa JC, Urioste M, Benitez J, Boix-Chornet M, Sanchez-Aguilera A, Ling C, Carlsson E, Poulsen P, Vaag A, Stephan Z, Spector TD, Wu YZ, Plass C, Esteller M. Epigenetic differences arise during the lifetime of monozygotic twins. Proc. Natl Acad. Sci. USA. 2005;102:10604–10609. doi: 10.1073/pnas.0500398102. [DOI] [PMC free article] [PubMed] [Google Scholar]
- Frazier-Wood AC, Aslibekyan S, Absher DM, Hopkins PH, Sha J, Tsai MY, Tiwari HK, Waite LL, Zhi D, Arnett DK. Methylation at CPT1A locus is associated with lipoprotein subfraction profiles. J. Lipid Res. 2014;55:1324–1330. doi: 10.1194/jlr.M048504. [DOI] [PMC free article] [PubMed] [Google Scholar]
- Glier MB, Green TJ, Devlin AM. Methyl nutrients, DNA methylation, and cardiovascular disease. Mol. Nutr. Food Res. 2014;58:172–182. doi: 10.1002/mnfr.201200636. [DOI] [PubMed] [Google Scholar]
- Grundberg E, Meduri E, Sandling JK, Hedman AK, Keildson S, Buil A, Busche S, Yuan W, Nisbet J, Sekowska M, Wilk A, Barrett A, Small KS, Ge B, Caron M, Shin SY, Lathrop M, Dermitzakis ET, McCarthy MI, Spector TD, Bell JT, Deloukas P. Global analysis of DNA methylation variation in adipose tissue from twins reveals links to disease-associated variants in distal regulatory elements. Am. J. Hum. Genet. 2013;93:876–890. doi: 10.1016/j.ajhg.2013.10.004. [DOI] [PMC free article] [PubMed] [Google Scholar]
- Higgins M, Province M, Heiss G, Eckfeldt J, Ellison RC, Folsom AR, Rao DC, Sprafka JM, Williams R. NHLBI Family Heart Study: objectives and design. Am. J. Epidemiol. 1996;143:1219–1228. doi: 10.1093/oxfordjournals.aje.a008709. [DOI] [PubMed] [Google Scholar]
- Hixson JE, Vernier DT. Restriction isotyping of human apolipoprotein E by gene amplification and cleavage with HhaI. J. Lipid Res. 1990;31:545–548. [PubMed] [Google Scholar]
- Johnson AA, Akman K, Calimport SR, Wuttke D, Stolzing A, de Magalhaes JP. The role of DNA methylation in aging, rejuvenation, and age-related disease. Rejuvenation Res. 2012;15:483–494. doi: 10.1089/rej.2012.1324. [DOI] [PMC free article] [PubMed] [Google Scholar]
- Klaver CC, Kliffen M, van Duijn CM, Hofman A, Cruts M, Grobbee DE, van Broeckhoven C, de Jong PT. Genetic association of apolipoprotein E with age-related macular degeneration. Am. J. Hum. Genet. 1998;63:200–206. doi: 10.1086/301901. [DOI] [PMC free article] [PubMed] [Google Scholar]
- Kozlenkov A, Roussos P, Timashpolsky A, Barbu M, Rudchenko S, Bibikova M, Klotzle B, Byne W, Lyddon R, Di Narzo AF, Hurd YL, Koonin EV, Dracheva S. Differences in DNA methylation between human neuronal and glial cells are concentrated in enhancers and non-CpG sites. Nucleic Acids Res. 2014;42:109–127. doi: 10.1093/nar/gkt838. [DOI] [PMC free article] [PubMed] [Google Scholar]
- Lambert JC, Perez-Tur J, Dupire MJ, Galasko D, Mann D, Amouyel P, Hardy J, Delacourte A, Chartier-Harlin MC. Distortion of allelic expression of apolipoprotein E in Alzheimer's disease. Hum. Mol. Genet. 1997;6:2151–2154. doi: 10.1093/hmg/6.12.2151. [DOI] [PubMed] [Google Scholar]
- Lambert JC, Pasquier F, Cottel D, Frigard B, Amouyel P, Chartier-Harlin MC. A new polymorphism in the APOE promoter associated with risk of developing Alzheimer's disease. Hum. Mol. Genet. 1998;7:533–540. doi: 10.1093/hmg/7.3.533. [DOI] [PubMed] [Google Scholar]
- Lambert JC, Brousseau T, Defosse V, Evans A, Arveiler D, Ruidavets JB, Haas B, Cambou JP, Luc G, Ducimetiere P, Cambien F, Chartier-Harlin MC, Amouyel P. Independent association of an APOE gene promoter polymorphism with increased risk of myocardial infarction and decreased APOE plasma concentrations-the ECTIM study. Hum. Mol. Genet. 2000;9:57–61. doi: 10.1093/hmg/9.1.57. [DOI] [PubMed] [Google Scholar]
- Lindahl T. DNA methylation and control of gene expression. Nature. 1981;290:363–364. doi: 10.1038/290363b0. [DOI] [PubMed] [Google Scholar]
- Lister R, Pelizzola M, Dowen RH, Hawkins RD, Hon G, Tonti-Filippini J, Nery JR, Lee L, Ye Z, Ngo QM, Edsall L, Antosiewicz-Bourget J, Stewart R, Ruotti V, Millar AH, Thomson JA, Ren B, Ecker JR. Human DNA methylomes at base resolution show widespread epigenomic differences. Nature. 2009;462:315–322. doi: 10.1038/nature08514. [DOI] [PMC free article] [PubMed] [Google Scholar]
- Liu J, Morgan M, Hutchison K, Calhoun VD. A study of the influence of sex on genome wide methylation. PLoS ONE. 2010;5:e10028. doi: 10.1371/journal.pone.0010028. [DOI] [PMC free article] [PubMed] [Google Scholar]
- Park JL, Kwon OH, Kim JH, Yoo HS, Lee HC, Woo KM, Kim SY, Lee SH, Kim YS. Identification of body fluid-specific DNA methylation markers for use in forensic science. Forensic Sci Int Genet. 2014;13:147–153. doi: 10.1016/j.fsigen.2014.07.011. [DOI] [PubMed] [Google Scholar]
- Reddy PM, Reddy PR. Effect of prolactin on DNA methylation in the liver and kidney of rat. Mol. Cell. Biochem. 1990;95:43–47. doi: 10.1007/BF00219528. [DOI] [PubMed] [Google Scholar]
- Ribel-Madsen R, Fraga MF, Jacobsen S, Bork-Jensen J, Lara E, Calvanese V, Fernandez AF, Friedrichsen M, Vind BF, Hojlund K, Beck-Nielsen H, Esteller M, Vaag A, Poulsen P. Genome-wide analysis of DNA methylation differences in muscle and fat from monozygotic twins discordant for type 2 diabetes. PLoS ONE. 2012;7:e51302. doi: 10.1371/journal.pone.0051302. [DOI] [PMC free article] [PubMed] [Google Scholar]
- Rustici G, Kolesnikov N, Brandizi M, Burdett T, Dylag M, Emam I, Farne A, Hastings E, Ison J, Keays M, Kurbatova N, Malone J, Mani R, Mupo A, Pedro Pereira R, Pilicheva E, Rung J, Sharma A, Tang YA, Ternent T, Tikhonov A, Welter D, Williams E, Brazma A, Parkinson H, Sarkans U. ArrayExpress update–trends in database growth and links to data analysis tools. Nucleic Acids Res. 2012;41:D987–D990. doi: 10.1093/nar/gks1174. [DOI] [PMC free article] [PubMed] [Google Scholar]
- Saunders AM, Hulette O, Welsh-Bohmer KA, Schmechel DE, Crain B, Burke JR, Alberts MJ, Strittmatter WJ, Breitner JC, Rosenberg C. Specificity, sensitivity, and predictive value of apolipoprotein-E genotyping for sporadic Alzheimer's disease. Lancet. 1996;348:90–93. doi: 10.1016/s0140-6736(96)01251-2. [DOI] [PubMed] [Google Scholar]
- Sharma P, Kumar J, Garg G, Kumar A, Patowary A, Karthikeyan G, Ramakrishnan L, Brahmachari V, Sengupta S. Detection of altered global DNA methylation in coronary artery disease patients. DNA Cell Biol. 2008;27:357–365. doi: 10.1089/dna.2007.0694. [DOI] [PubMed] [Google Scholar]
- Shoemaker R, Deng J, Wang W, Zhang K. Allele-specific methylation is prevalent and is contributed by CpG-SNPs in the human genome. Genome Res. 2010;20(7):883–889. doi: 10.1101/gr.104695.109. [DOI] [PMC free article] [PubMed] [Google Scholar]
- Souren NY, Lutsik P, Gasparoni G, Tierling S, Gries J, Riemenschneider M, Fryns JP, Derom C, Zeegers MP, Walter J. Adult monozygotic twins discordant for intra-uterine growth have indistinguishable genome-wide DNA methylation profiles. Genome Biol. 2013;14:R44. doi: 10.1186/gb-2013-14-5-r44. [DOI] [PMC free article] [PubMed] [Google Scholar]
- Subar AF, Thompson FE, Kipnis V, Midthune D, Hurwitz P, McNutt S, McIntosh A, Rosenfeld S. Comparative validation of the Block, Willett, and National Cancer Institute food frequency questionnaires: the Eating at America's Table Study. Am. J. Epidemiol. 2001;154:1089–1099. doi: 10.1093/aje/154.12.1089. [DOI] [PubMed] [Google Scholar]
- Thompson FE, Subar AF, Brown CC, Smith AF, Sharbaugh CO, Jobe JB, Mittl B, Gibson JT, Ziegler RG. Cognitive research enhances accuracy of food frequency questionnaire reports: results of an experimental validation study. J. Am. Diet. Assoc. 2002;102:212–225. doi: 10.1016/s0002-8223(02)90050-7. [DOI] [PubMed] [Google Scholar]
- Tsai MY, Hanson NQ, Straka RJ, Hoke TR, Ordovas JM, Peacock JM, Arends VL, Arnett DK. Effect of influenza vaccine on markers of inflammation and lipid profile. J. Lab. Clin. Med. 2005;145:323–327. doi: 10.1016/j.lab.2005.03.009. [DOI] [PubMed] [Google Scholar]
- Turan N, Ghalwash MF, Katari S, Coutifaris C, Obradovic Z, Sapienza C. DNA methylation differences at growth related genes correlate with birth weight: a molecular signature linked to developmental origins of adult disease? BMC Med. Genomics. 2012;5:10. doi: 10.1186/1755-8794-5-10. [DOI] [PMC free article] [PubMed] [Google Scholar]
- Viitanen L, Pihlajamaki J, Miettinen R, Karkkainen P, Vauhkonen I, Halonen P, Kareinen A, Lehto S, Laakso M. Apolipoprotein E gene promoter (-219G/T) polymorphism is associated with premature coronary heart disease. J. Mol. Med. 2001;79:732–737. doi: 10.1007/s001090100265. [DOI] [PubMed] [Google Scholar]
- Wang SC, Oelze B, Schumacher A. Age-specific epigenetic drift in late-onset Alzheimer's disease. PLoS ONE. 2008;3:e2698. doi: 10.1371/journal.pone.0002698. [DOI] [PMC free article] [PubMed] [Google Scholar]
- Ward H, Mitrou PN, Bowman R, Luben R, Wareham NJ, Khaw KT, Bingham S. APOE genotype, lipids, and coronary heart disease risk: a prospective population study. Arch. Intern. Med. 2009;169:1424–1429. doi: 10.1001/archinternmed.2009.234. [DOI] [PubMed] [Google Scholar]
- Wockner LF, Noble EP, Lawford BR, Young RM, Morris CP, Whitehall VL, Voisey J. Genome-wide DNA methylation analysis of human brain tissue from schizophrenia patients. Transl Psychiatry. 2014;4:e339. doi: 10.1038/tp.2013.111. [DOI] [PMC free article] [PubMed] [Google Scholar]
- Yi-Deng J, Tao S, Hui-Ping Z, Jian-Tuan X, Jun C, Gui-Zhong L, Shu-Ren W. Folate and ApoE DNA methylation induced by homocysteine in human monocytes. DNA Cell Biol. 2007;26:737–744. doi: 10.1089/dna.2007.0619. [DOI] [PubMed] [Google Scholar]
- Zhi D, Aslibekyan S, Irvin MR, Claas SA, Borecki IB, Ordovas JM, Absher DM, Arnett DK. SNPs located at CpG sites modulate genome-epigenome interaction. Epigenetics. 2013;8:802–806. doi: 10.4161/epi.25501. [DOI] [PMC free article] [PubMed] [Google Scholar]
- Zykovich A, Hubbard A, Flynn JM, Tarnopolsky M, Fraga MF, Kerksick C, Ogborn D, MacNeil L, Mooney SD, Melov S. Genome-wide DNA methylation changes with age in disease-free human skeletal muscle. Aging Cell. 2013;13:360–366. doi: 10.1111/acel.12180. [DOI] [PMC free article] [PubMed] [Google Scholar]
Associated Data
This section collects any data citations, data availability statements, or supplementary materials included in this article.
Supplementary Materials
Table S1 Cell types and tissues included in the current study.
Fig. S1 Heat map of APOE methylation patterns measured in the blood T lymphocyte in GOLDN. The pink represents hypermethylation (> 50%), the green represents hypomethylation (< 50%), and the gray represents missing value.
Fig. S2 Heat map of APOE methylation patterns measured in the primary brain tissue. The pink represents hypermethylation (> 50%), the green represents hypomethylation (< 50%), and the gray represents missing value.
Fig. S3 Heat map of APOE methylation patterns measured in the primary saliva tissue. The pink represents hypermethylation (> 50%), the green represents hypomethylation (< 50%), and the gray represents missing value.
Fig. S4 Heat map of APOE methylation patterns measured in the primary adipose tissue. The pink represents hypermethylation (> 50%), the green represents hypomethylation (< 50%), and the gray represents missing value.
Fig. S5 Heat map of APOE methylation patterns measured in the primary muscle. The pink represents hypermethylation (> 50%), the green represents hypomethylation (< 50%), and the gray represents missing value.
Fig. S6 Heat map of APOE methylation patterns measured in primary hepatocyte and 61 cell lines in ENCODE. The pink represents hypermethylation (> 50%), the green represents hypomethylation (< 50%), and the gray represents missing value.