

Abstract
Image sequences of live proliferating cells often contain visual ambiguities that are difficult even for human domain experts to resolve. Here we present a new approach to analyzing image sequences that capture the development of clones of hematopoietic stem cells (HSCs) from live cell time lapse microscopy. The HSCs cannot survive long term imaging unless they are cultured together with a secondary cell type, OP9 stromal cells. The HSCs frequently disappear under the OP9 cell layer, making segmentation difficult or impossible from a single image frame, even for a human domain expert. We have developed a new approach to the segmentation of HSCs that captures these occluded cells. Starting with an a priori segmentation that uses a Monte Carlo technique to estimate the number of cells in a clump of touching cells, we proceed to track and lineage the image data. Following user validation of the lineage information, an a posteriori resegmentation step utilizing tracking results delineates the HSCs occluded by the OP9 layer. Resegmentation has been applied to 3031 occluded segmentations from 77 tracks, correctly recovering over 84% of the occluded segmentations.
Keywords: stem cell lineaging, hematopoietic stem cell segmentation, dendritic cell precursor, segmentation from tracking
I. Introduction
Studying the developmental properties of clones, or family trees, of proliferating cells has wide application in cancer biology and regenerative medicine. These developmental properties include features specific to the lineage tree such as cell cycle time or population growth, as well as features including patterns of motion, morphology and association. In order to extract these developmental properties, segmentation is first used to delineate the individual cells in each image frame. Our goal is to have a consistent delineation of cells in each frame that is not necessarily pixel-accurate, but rather captures cellular shape and location. Temporal associations between segmentation results are established using multi-target tracking. Finally, the relationship between a parent and its daughter cells is established via lineaging.
Using microscopes with integrated incubation systems, it has become possible to acquire long-term time lapse imaging following the development of a clone of cells from a single progenitor through multiple cell cycles or mitoses. Hundreds of image sequences can be captured simultaneously using a microscope with an automated stage. In addition to the vast quantities of data generated by such techniques, there is inherent visual ambiguity in the analysis of these proliferating cell image sequences. Cells can be adherent, making it difficult or impossible even for human domain experts to establish from a single frame the correct segmentation or delineation of the individual cells. This will inevitably lead to errors in the subsequent tracking and lineaging analyses. We have shown previously that while it is possible to be robust to segmentation errors in the analysis of cell dynamics from time lapse image sequence data, errors in tracking or lineaging will quickly corrupt any subsequent analysis [1]. Previously we have developed a system for segmenting, tracking and lineaging neural stem cells. This program, called LEVER for Lineage Editing and Validation [2], allows a human observer to validate the results of automated image analysis for the segmentation, tracking and lineaging of proliferating neural stem cells. LEVER is designed so that errors in the automated processing are easily identified and quickly corrected.
Fig. 1 shows a single image frame together with a lineage tree generated by LEVER for one clone. Each branch in the lineage tree represents a cell division, and the distance between branches shows the time between divisions. In the present work we have extended the LEVER program to work with hematopoietic, or immune system, stem cells (HSCs). These hematopoietic stem cells are cultured in combination with a “feeder layer” of OP9 (stromal) cells, and the HSCs have a propensity to disappear under the feeder layer of cells, causing their appearance to change drastically. We refer to these cells as “occluded”. Here we describe a new segmentation approach for these occluded cells that directly incorporates tracking information, enabling long sequences of missed segmentations to be recovered accurately and reliably. We first apply a new a priori segmentation designed for the non-occluded HSCs. Following this, the same MAT tracking algorithm originally developed for tracking axonal organelle transport [3] and used along with lineage tree generation in the previous neural stem cell version of LEVER is applied. The lineage tree is then corrected as part of the validation. Tracking information from the corrected lineage tree is then used for an a posteriori resegmentation of the occluded HSCs. This idea of using the higher-level contextual information from the lineage tree is a key aspect of our method, and while the ability to track occluded HSCs is important and valuable, we feel that our technique may be broadly applicable to many cell segmentation problems. In the following, we detail the cell culture method and the newly developed a priori segmentation algorithm. For details on the tracking and lineaging approach the reader is referred to [2]. Finally, we detail the new a posteriori resegmentation algorithm and present results.
Fig. 1.
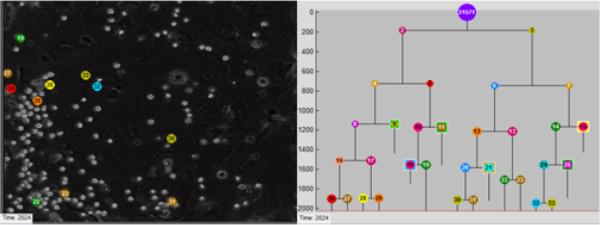
Image data and lineage tree. Segmentation results for the last frame of the image sequence (left). Lineage tree for one clone of HSCs (right). Tracking results (colored numbers) are shown for cells belonging to the clone. Segmented cells outlined in white are associated with other clones and not with the currently displayed lineage tree. Supplementary Video 1.
II. Materials and Methods
A. Preparation of cells
Picovitro slides (Picovitro) were first coated with Collagen type I, followed by culture of OP9 stromal cells, previously irradiated with 30 Gy, at a number of 102 per well in dendritic cell conditioned medium [4]. Cultures were left overnight for OP9 adherence. The following day, HSCs were prepared from c-kit (CD117)-enriched BM from either C57BL/6, UBC-GFP mice using anti-CD117 beads (Miltenyi), followed by staining with antibodies against Sca-1, ckit and IL-7R. Progenitors were sorted as Sca-1+c-kithiIL7R-progenitors [5]. PDMS membranes were layered on top, and slides fixed to a custom-bracket to fully encapsulate slides in order to prevent dehydration but allow gas exchange. The slide and bracket were mounted in a Zeiss Live Cell Observer, with 5% CO2-in-air, and at 37° C. Phase contrast images of multiple positions in the slide were taken with a 10x Plan-Neofluar phase contrast objective with a 1.6x Optovar every 2 minutes. GFP images were captured every hour, with each clone being GFP+ or GFP- throughout the image sequence. The GFP information was used for a separate validation experiment, although it was helpful during validation here for resolving tracking ambiguities.
B. A priori segmentation
Each image was captured as a 1344 × 1024 8-bit TIFF file. There were 2024 consecutively numbered frames for each experiment. Each image had a black border artifact related to the microscope well. As a preprocessing step, we computed a gray threshold using Otsu's adaptive thresholding technique [6], found the largest connected component in the thresholded pixels, and used those to automatically crop the artifact from the image.
We next apply a newly developed a priori segmentation algorithm to identify non-occluded HSCs. This a priori algorithm considers only a single image frame, in contrast to the a posteriori resegmentation described in Sec. II C. We begin by computing a gray threshold using Otsu's method, and use the threshold to separate the image into foreground and background pixels. We morphologically close the foreground pixels [7] and fill in any holes with a binary hole filler. Following the approach developed in [8], the morphological image gradient [7] is computed and subtracted, separating regions with high local gray-level variation from the foreground pixels to help with the subsequent separation of touching cells.
The technique just described separates regions with HSCs from the background OP9 stromal cells. However, the HSCs in this experiment can be adherent, so a single region often contains a clump of touching cells without a strong gradient between them. To complete the separation of cells that are touching we use an approach called the gap statistic [9] that was designed to estimate the number of clusters in an arbitrary data set. In practice we have found this approach more reliable than the watershed transform that has been widely used for separating touching objects [7]. Here we use the number of clusters as a way to identify the number of spherical HSCs in a clump of touching cells (see Fig. 2). The gap statistic is computed by comparing the intra-cluster dispersion of the pixel data from connected components of foreground pixels with that of uniformly distributed randomly generated data on the same spatial range. For each value k, the number of clusters in the data, we apply a k-means clustering algorithm to separate the data into individual cells, and then compute Dr, the sum of the distances between elements in each cluster Cr,
| (1) |
The average intra-cluster dispersion is calculated as
| (2) |
where nr is the number of points in cluster Cr. The gap statistic is then computed as the difference between the intra-cluster distances of our data and the intra-cluster distances of B randomly generated uniformly distributed data sets of the same dimension as our data,
| (3) |
where Wkb is the average intra-cluster dispersion obtained by running our clustering algorithm on each of the B randomly generated uniformly-distributed datasets. Following [1] we set B to 100. We compute the standard deviation of the gap value sk from σk, the standard deviation of the B uniformly distributed randomly generated data sets, adjusted to account for simulation error, as
| (4) |
Finally, we choose the smallest value of k for which
| (5) |
Fig. 2.

Segmentation of touching cells using the gap statistic in conjunction with the k-means algorithm in the a priori segmentation. This segmentation was used as the input to the tracking algorithm. The area marked by the arrow not a cell, it is an artifact of the HSC's interaction with the OP9 stromal cells.
Once we calculate the the number of clusters using the gap statistic, we use k-means clustering to divide each clump of touching cells into k individual cells. We next track the cells between frames using multitemporal association tracking (MAT) [3]. MAT is a graph-based tracking algorithm which, for each frame, evaluates a multi-temporal cost that approximates the Bayesian a posteriori association probability between the current set of tracks and the set of all feasible track associations out to a fixed window size, and computes the least cost association. After tracking is completed, the resulting movies are loaded into LEVER [2].
The HSCs are imaged together with OP9 stromal cells that are necessary for the long-term survival of the HSCs. These HSCs are often occluded by the OP9 stromal cells, disappearing under the stromal layer and losing the characteristic phase contrast halo artifact that identifies the cell in our segmentation approach. When this occurs, the HSCs appear as dark circular regions in the phase contrast images as shown in Fig. 3. The durations of the occlusions varied from as short as a single frame to well over 100 frames. Since the images contain many dark regions that are not cells, detecting only the dark regions that contain cells is difficult to impossible to accomplish by examining a single image frame. These occluded HSCs make up approximately 10% of the total segmentations. For the sample image sequence shown in Fig. 1, there are 10,374 total HSC segmentations on the clone, of which 1,327 (12.8%) were occluded by the OP9 stromal cells.
Fig. 3.

HSCs occluded by OP9 stromal layer, indicated by arrows (left). Naïve segmentation of dark circular regions (right) with desired HSC locations marked by arrows.
C. Segmentation from tracking
We developed a new segmentation approach for these occluded HSCs. The segmentation approach uses the tracking results to identify cells on the lineage tree that do not have segmentations, and then attempts the following steps frame by frame to establish segmentations for each missing cell. The procedure begins with a correct lineage tree up to frame t confirmed by the human user and proceeds as follows:
-
1)
An existing track on the lineage tree confirms the existence of a particular cell track on frame t that is missing the segmentation result on frame t + 1.
-
2)
The algorithm resegments frame t + 1. We use the empirically estimated maximum cell velocity to restrict our segmentation region to a region of interest (ROI) centered on the cell's center of mass at time t, then try several segmentation methods as described below. For this experiment we used an ROI of 100 × 100 pixels.
-
3)
We match the resegmented ROI at time t + 1 to the cell being tracked. If more than one possible matching region is found, they are scored based on similarity to and distance from the previous cell, using the original tracking algorithm.
-
4)
The best matching region is selected. We add that segmentation and extend the track to frame t + 1. We then continue to step 2 for frame t+2, using the newly segmented cell as the basis. If no likely region is found, the user may pause the process during validation, add the cell manually, and continue.
We utilize a variety of methods in Step 2 to detect occluded HSCs in the ROI. First, the occlusions often exhibited a characteristic halo in the phase contrast images, but with diminished intensities. We resegmented the pixels in these halos, scaling the adaptive threshold down progressively until a cell is detected or we hit a predetermined limit for the thresholding. However, in many cases the cells were completely occluded by the stromal layer and did not exhibit any of the halo artifact used by the a priori HSC segmentation. Here the HSCs typically appear as dark circular regions within the stromal layer. To detect these circular regions we used Michel's technique to enhance the contrast in the image region [10], segmented the image into foreground and background using Otsu thresholding, and then looked for pixels on the edges of circles using the Circle Hough Transform (CHT) [11].
Because our tracking results establish the existence of a cell at a particular position at time t, we can employ more aggressive segmentation strategies to identify a missing segmentation for that cell at time t+1. For example, Fig. 3a shows a frame with 3 occluded HSCs (marked with arrows). If we run the CHT on the entire frame, it finds those 3 occlusions, but it also finds over 40 other possible occluded regions (Fig. 3b). This is an unacceptably high false positive rate for our initial segmentation. However, once we know the lineage up to time t, we can run the CHT on small regions at time t + 1 and have much higher confidence that CHT resegmentation results will correspond correctly to occluded HSCs. Fig. 4 shows the results of resegmentation for one track segment of occluded HSCs. On our initial pass we were unable to segment these cells, causing the track to be dropped between frames 1 and 9. We manually added a segmentation for the occluded cell on frame 1 (shown in red on the right). Our algorithm was then able to automatically segment and track the occluded cells on frames 2–8, and merge them with the existing track on frame 9. Frames 3, 5 and 7 were segmented using thresholded morphological gradients; the remaining frames used the CHT. Because the resegmentation is applied only in an area constrained by the empirically estimated maximum cell velocity, we can use a lower sensitivity factor without being impacted by false positives such as those in Fig. 3b. We note that our goal was not pixel-accurate segmentation, but rather to capture enough of the location of the occluded cell to be able to track it until it reappeared. The region in frame 2, for instance, was found by the CHT despite being roughly semicircular in shape.
Fig. 4.

Example results for the segmentation from tracking a posteriori resegmentation algorithm for 9 image frames. Each frame shows the original (missed) segmentation (left), together with the results of the resegmentation (right). Dark circular objects are occluded HSCs. See also Supplemental Video 2.
III. EXPERIMENTAL RESULTS
To test our method of automatically resegmenting occluded HSCs from tracking, we ran the algorithm on 77 occluded sequences in 3 different movies. For each sequence, the HSC in question was occluded for at least 10 frames, and none of the cells was correctly segmented by the a priori segmentation algorithm described in Sec. II-B. The cells were occluded for a total of 3,031 frames, an average of 39.4 frames per sequence. We automatically added 2,559 segmentations. Our average success rate was 84.4% and our median success rate across the 77 sequences was 88.9%. On 10 of the sequences, our algorithm automatically segmented and tracked all of the occluded cells; the longest of these was 62 frames.
For the clone of cells shown in Fig. 1 and Supplementary video 1, there were 10,374 segmentations in the fully corrected data. The a priori segmentation algorithm incorrectly segmented 3,424 of these, an error rate of 33%. Using the tracking information, the a posteriori algorithm automatically corrected 2,699 segmentation errors, or 78.8% of the errors. Of these 2,699 automatically corrected segmentation errors, 520 (39%) were resegmented using the CHT while the remainder were resegmented by adaptive threshold reduction. During validation with the LEVER program, the user manually corrected 725 errors, or 7% of the total segmentations in the fully corrected image data.
IV. CONCLUSION
We have presented a new approach to analyzing image sequences of hematopoietic stem cells captured during live cell time lapse microscopy. Current methods of imaging HSCs require them to be cultured together with OP9 stromal cells. However, the HSCs frequently disappear beneath the OP9 layer, making segmentation difficult from a single frame image. There are two main contributions of our work. First, we have described a new a priori segmentation method for groups of touching HSCs using the gap statistic. This method may be used instead of or in concert with previous existing techniques such as the watershed transform. Second, we have presented an a posteriori resegmentation algorithm which uses tracking information from the corrected lineage tree to automatically segment and track occluded HSCs. We believe this approach will be widely applicable for any cell segmentation problem where it is possible to incorporate temporal context.
Supplementary Material
Footnotes
acohen at coe.drexel.edu
This work was supported in part by Human Frontier Science Program grant RGP0060/2012 and by NIH NINDS R01NS076709.
REFERENCES
- 1.Cohen AR, Bjornsson CS, Temple S, Banker G, Roysam B. Automatic summarization of changes in biological image sequences using algorithmic information theory. IEEE Trans Pattern Anal Mach Intel. 2009;31(8):1386–1403. doi: 10.1109/TPAMI.2008.162. [DOI] [PubMed] [Google Scholar]
- 2.Winter MR, Wait E, Roysam B, Goderie SK, Ali RAN, Kokovay E, Temple S, Cohen AR. Vertebrate neural stem cell segmentation, tracking and lineaging with validation and editing. Nature Protocols. 2011;6(12):1942–1952. doi: 10.1038/nprot.2011.422. [DOI] [PMC free article] [PubMed] [Google Scholar]
- 3.Winter MR, Fang C, Banker G, Roysam B, Cohen AR. Axonal transport analysis using multitemporal association tracking. Int J Comput Biol Drug Des. 2012;5(1):35–48. doi: 10.1504/IJCBDD.2012.045950. [DOI] [PMC free article] [PubMed] [Google Scholar]
- 4.Naik SH, Sathe P, Park H-Y, Metcalf D, Proietto AI, Dakic A, Carotta S, O'Keeffe M, Bahlo M, Papenfuss A. Development of plasmacytoid and conventional dendritic cell subtypes from single precursor cells derived in vitro and in vivo. Nature Immunology. 2007;8(11):1217–1226. doi: 10.1038/ni1522. [DOI] [PubMed] [Google Scholar]
- 5.Naik SH, Perie L, Swart E, Gerlach C, van Rooij N, de Boer RJ, Schumacher TN. Diverse and heritable lineage imprinting of early haematopoietic progenitors. Nature. 2013;496(7444):229–232. doi: 10.1038/nature12013. [DOI] [PubMed] [Google Scholar]
- 6.Otsu N. A threshold selection method from gray-level histograms. IEEE Trans Syst Man, Cybern. 1979;9(1):62–66. [Google Scholar]
- 7.Gonzalez RC, Woods RE, Eddins SL. Digital Image processing using MATLAB. 2nd edition Gatesmark; 2009. [Google Scholar]
- 8.Cohen AR, Gomes FL, Roysam B, Cayouette M. Computational prediction of neural progenitor cell fates. Nat Methods. 2010;7(3):213–8. doi: 10.1038/nmeth.1424. [DOI] [PubMed] [Google Scholar]
- 9.Tibshirani R, Walther G, Hastie T. Estimating the number of clusters in a data set via the gap statistic. J R Stat Soc: Series B. 2001;63(2):411–423. [Google Scholar]
- 10.Michel R, Steinmeyer R, Falk M, Harms GS. A new detection algorithm for image analysis of single, fluorescence-labeled proteins in living cells. Microsc Res Tech. 2007;70(9):763–70. doi: 10.1002/jemt.20485. [DOI] [PubMed] [Google Scholar]
- 11.Atherton TJ, Kerbyson DJ. Size invariant circle detection. Image and Vision Computing. 1999;17(11):795–803. [Google Scholar]
Associated Data
This section collects any data citations, data availability statements, or supplementary materials included in this article.