Abstract
Pulse electron paramagnetic resonance imaging (Pulse EPRI) is a robust method for noninvasively measuring local oxygen concentrations in vivo. For 3D tomographic EPRI, the most commonly used reconstruction algorithm is filtered back projection (FBP), in which the parabolic filtration process strongly influences image quality. In this work, we designed and compared 7 parabolic filtration methods to reconstruct both simulated and real phantoms. To evaluate these methods, we designed 3 error criteria and 1 spatial resolution criterion. It was determined that the 2 point derivative filtration method and the two-ramp-filter method have unavoidable negative effects resulting in diminished spatial resolution and increased artifacts respectively. For the noiseless phantom the rectangular-window parabolic filtration method and sinc-window parabolic filtration method were found to be optimal, providing high spatial resolution and small errors. In the presence of noise, the 3 point derivative method and Hamming-window parabolic filtration method resulted in the best compromise between low image noise and high spatial resolution. The 3 point derivative method is faster than Hamming-window parabolic filtration method, so we conclude that the 3 point derivative method is optimal for 3D FBP.
Keywords: Parabolic filter, 3D FBP, EPRI, Noise, Spatial Resolution
1. Introduction
Electron Paramagnetic Resonance Imaging (EPRI) is a technique that can measure, in vivo, the spatial distribution of paramagnetic spin probes [1]. EPRI spectroscopic or relaxation images of these water soluble probes in vivo have demonstrated a high sensitivity to various physiologic parameters [2]. Different spin probes have been designed to report on specific physiology [3]. EPRI can measure the distribution of endogenous or introduced exogenous paramagnetic species, tissue redox status, pH, and microviscosity, as well as oxygen concentration (pO2) [4]. Local pO2 has been found to have a number of important prognostic implications for the treatment of cancer and is therefore a very important physiologic parameter to measure. Low pO2 (hypoxia) has been found to increase cancer cell resistance to radiation therapy. The ability to provide images of local pO2 distributions therefore can aid in the determination of appropriate radiation doses to different regions of a tumor, based on the spatial pO2 distribution provided by EPRI [5].
Two main methods are used for ERPI: pulsed EPRI and continuous wave (CW) EPRI [6]. If the relaxation time of the electron spin system for a given spin probe is long enough to collect the EPR signal (e.g., for trityl spin probes), pulsed EPRI is the preferred method [7]. However, if the relaxation time is restrictively short (e.g., for nitroxide spin probes), it becomes very difficult to collect the EPR signal due to sampling speed limitations for the A/D (analogue to digital) converter. In this case, CW EPRI is the preferred method [8]. For CW EPRI, the EPR signal is an absorption signal varying according to the swept magnetic field strength, thereby alleviating the sampling speed limitations by utilizing a comparatively slow magnetic field sweep rate [9]. For future biomedical applications, more rapid imaging or even real time imaging may be necessary. Pulse pO2 images are acquired as a set of 3D amplitude images, each of them with different pulse sequence parameters [6]. For 3D EPRI, the classical image reconstruction algorithm is the 3D filtered back projection (FBP) algorithm [10][11][12][13], in which a parabolic filter is used to eliminate the wedge effect [14]. This filter is analogous to the ramp filter that plays an important role in the 2D FBP algorithm [14] widely used in X-ray parallel beam Computed Tomography (CT).
Different parabolic filtration methods provide different levels of image precision and spatial resolution. In addition, each filtration method has a different sensitivity to noise. If a high spatial resolution image is necessary, the high frequency information of the object must be retained. However, noise is tends to be mostly concentrated in the high frequency range so that the high frequency information content of the object and the high frequency noise overlap. It is essentially impossible to completely extract the useful signal from noise-contaminated spatial projections. Clearly, a compromise between low noise and high spatial resolution is unavoidable. Similarly, there is no perfect parabolic filtration method. Our main goal is to determine an optimal parabolic filtration method that provides an acceptable compromise between spatial resolution and noise level under certain conditions.
In this paper, we analyze the characteristics of the parabolic filter in section 2, design three categories of parabolic filtration approaches and seven specific methods in section 3, compare these seven filtration methods using simulation and real experiments in section 4, and draw conclusions from our results in section 5.
2. The Parabolic Filter in the 3D FBP Algorithm
2.1 3D FBP Algorithm
The 3D FBP formula is based on the 3D inverse Radon transform [15]. Without derivation, the 3D FBP algorithm is shown in Eq. (1)–(5) as described in [15].
| (1) |
where,
| (2) |
| (3) |
| (4) |
| (5) |
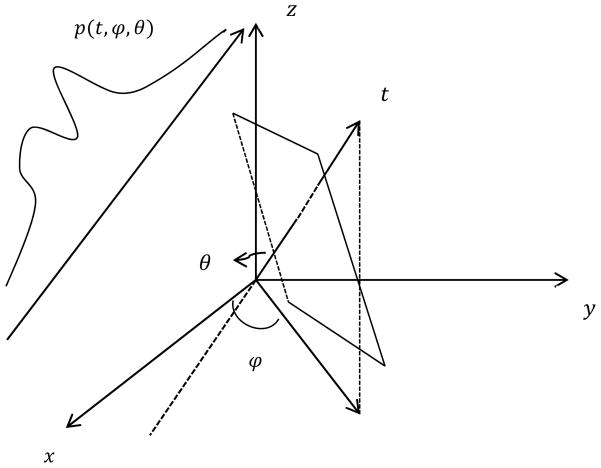
In Eq. (1)–(5), f(x, y, z) represents a 3D object, p(t,φ,θ) is a 1D spatial projection of the object at the angle (φ,θ), g(t,φ,θ) is the filtered projection, * denotes convolution, and h(t) is the unit impulse response of the parabolic filter. In Eq. (2), t is the projecting address of a point (x,y,z) for a particular projection at the angle(φ, θ). In Eq. (4),
 {·} represents the inverse Fourier transform (FT). A graphical representation of a spatial projection as defined above is shown in Fig. 1.
Fig. 1.
The spatial projection diagram of 3-D FBP algorithm
2.2 The Parabola Filter
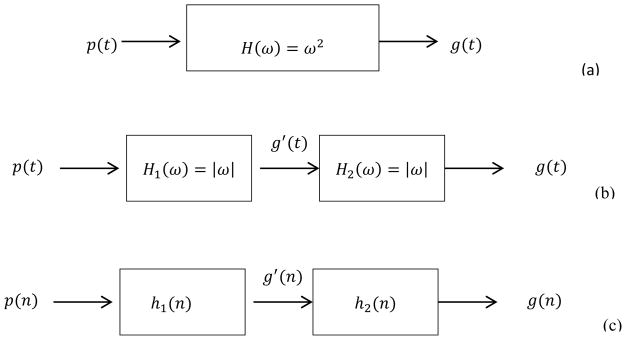
From the view of signal processing, every projection signal input to the reconstruction process can be considered to individually pass through a parabolic filter, whose frequency response is shown in Eq. (6). The system block diagram is shown in Fig. 2(a).
Fig. 2.
Three system block diagrams of parabolic filtration process. (a) describes the continuous parabolic filter, which can be implemented using two ramp filters, shown in (b), which has a discrete form, shown in (c).
| (6) |
| (7) |
According to the FT theory, the FT and its inversion exist only when the signal and its frequency spectrum are absolutely integrable. However, from Eq. (7), we can see that the frequency response of the parabolic filter is not absolutely integrable, and the parabolic filter therefore cannot be implemented physically.
A real projection is always band-limited, so we can add a window onto the frequency response of the parabolic filter to get a unit impulse response (UIR).
If the sampling interval for the spatial projection signal is d, the highest frequency contained in the signal is . The simplest method for adding a window then is adding a rectangular window whose bandwidth is on the parabola. The rectangular window function is shown in Eq. (8).
| (8) |
From the inverse FT, we obtain the UIR:
| (9) |
Letting t = nd, we obtain the discrete UIR shown in Eq. (10).
| (10) |
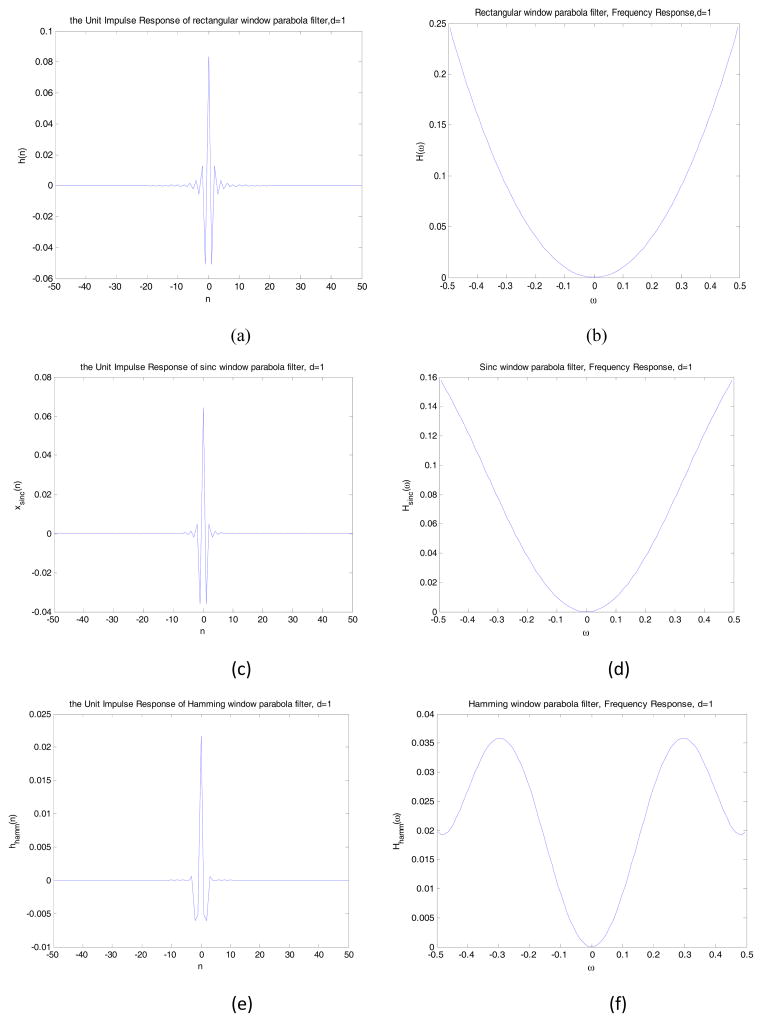
If we let d = 1, we obtain a specific h(n) and can calculate its frequency response using Discrete Fourier Transform (DFT), shown in Fig. 3(a) and (b).
Fig. 3.
The unit impulse response of the rectangular-window parabolic filter (a) and its frequency response (b), d=1. (c) and (d) are the corresponding figures for sinc-window parabolic filter and (e) and (f) are for Hamming window parabolic filter.
From Fig. 3(a) and (b), we can summarize some characteristics of the parabolic filter:
The parabolic filter is a special case of a high-pass filter. The frequency response increases from low frequency to high frequency proportional to ω2. This means that the high frequency noise will be highly amplified, causing 3D FBP to be a noise-sensitive algorithm. For image reconstruction, it is desirable to reduce the noise as much as possible.
The phase response of the parabola filter is zero, i.e. the filter is a zero-phase filter. This means that the support of the filtered projection and the support of the projection should be the same.
The UIR of the parabolic filter is real and symmetric, while its frequency response is positive, real, and symmetric.
The UIR of the parabolic filter consists of a main lobe and infinite symmetric side lobes of decreasing amplitude. The three central points of the UIR are crucially important, so no window should be added to them so as to avoid lowering the values of the three central points unreasonably.
The UIR exhibits an oscillatory Gibbs effect. To reduce this effect, a smoother window can be used to cover the frequency response as opposed to the rectangular window. For example, a sinc window or Hamming window can be used to reduce this effect [14].
3. Three Types of Filtration
Using different techniques to add a window, physically feasible filters can be constructed. Therefore, the first type of filtration approach is to use different window-adding techniques.
The relation between parabolic filtration and the second derivative suggests that a second derivative is another approach to filtration.
In the CT field, many well-developed implementation techniques exist for the ramp filter |ω| [14]. Noting that there is a relation between the ramp filter and the parabolic filter, specifically ω2 = |ω |·|ω|, parabolic filtration can be implemented by applying a ramp filtration twice. This is the third approach to filtration.
3.1 Direct Parabolic Filtration
As discussed above, adding a window will allow obtaining UIR of the parabolic filter. The implementation process then becomes a linear convolution process. One implementation method is to calculate the linear convolution directly. The other option is to implement linear convolution by using Fast Fourier Transform (FFT) [16].
Now, if the discrete spatial projection signal is p(n), n ∈ [0, N − 1], assuming that we have obtained a UIR, h(n), the output signal, g(n), can be calculated using Eq. (11).
| (11) |
The parabolic filer is a zero-phase filter and therefore the domain of the output signal should be [0, N − 1] as well.
Expanding Eq. (11), gives Eq. (12).
| (12) |
From Eq. (12), we can see that the definition domain of the UIR, h(n), should be [−(N − 1),(N − 1)]. This formulates the important length selection theorem for parabolic filtration.
Theorem 1
If the length of the spatial projection is N points, the length of the UIR of the parabolic filter will be 2N −1 and the definition domain of the UIR will be [−(N − 1),(N − 1)].
In summary, the design and implementation steps of the direct parabolic filtration are:
design a window in order to band-limit the parabolic filter. For example, by defining a rectangular window using Eq. (8),
add the window to the frequency response of the parabolic filter,
calculate the continuous UIR of the filter using an inverse FT, e.g., Eq. (9),
find the discrete UIR of the filter by sampling the continuous UIR using the defined sampling interval, e.g., Eq. (10),
select the definition domain for the UIR according to Theorem 1, thus providing a finite impulse response (FIR) filter, and
convolve the spatial projection signal and the UIR to obtain the filtered projection (the convolution process can also be implemented using the FFT algorithm).
3.2 Second Derivative Approach
According to the properties of the Fourier Transform, one obtains
| (13) |
where,
 {·} means the Fourier transform and P(ω) is the frequency spectrum of the signal p(t). Thus, one obtains
| (14) |
Therefore, the second parabolic filtration approach can be defined:
| (15) |
Eq. (15) implies that parabolic filtration can be implemented by using a weighted second derivative.
In numerical analysis theory, there are many numerical differentiation methods [17]. The second derivative can be calculated by applying the first derivative twice. Here, we present three first derivative calculation methods, which are shown in Eq. (16), (17) and (18) respectively.
| (16) |
In Eq. (16), d is the sampling interval of the spatial projection. This method is referred to as the 2 point method.
| (17) |
Eq. (17) is referred to as the 3 point method or the midpoint method. Finally we refer Eq. (18) as the 5 point method.
| (18) |
3.3 Two-Ramp-Filter Approach
The two-ramp-filter system block diagram is shown in Fig. 2(b), from which, we can see that the parabolic filter can be divided into two ramp filters. In X-ray CT fields, the ramp filter is very widely used in FBP type algorithms. Many practical ramp filters have been designed by CT researchers. The three most common filters are the Ram-Lak (R-L) filter, Shepp-Logan (S-L) filter, and Hamming window ramp filter [14]. For the implementation of these filters a very important property of convolution has to be taken into account. In Fig. 2(b), p(t) is the spatial projection signal, g′(t) is the intermediate result and g(t) is the final output signal. Suppose that we sample p(t) to be a discrete signal, p(n), having N points. The final output signal should also have N points. However, this does not define the necessary length of the intermediate result. The discrete system block diagram is shown in Fig. 2(c). In Fig. 2(c), h1(n) is the UIR of the first ramp filter and h2(n) is the UIR of the second ramp filter. According to convolution theory, if the input signal has N1 points and the UIR has N2 points, the output signal will have N1 + N2 − 1 points. Therefore, if p(n) has N points and h1(n) is an infinite long signal, g′(n) will have infinite points. If one only selects N points, the non-zero points outside of these N points will be lost. These non-zero points carry useful information and discarding these points will induce artifacts in the final reconstructed image. Clearly, the two-ramp-filter method has an inherent defect, i.e. in practice, the method cannot be ideally implemented. However these deleterious effects can become negligible if an appropriate finite window is used for g′(n) that includes most of the relevant information in the signal. It should be noted that the acceptable length may be several times of the initial N points.
3.4 Seven Specific Filtration Methods
According to the three approaches, we can design seven specific filtration methods, which are shown in Table 1.
Table 1.
Illumination of 7 filtration methods
| Method Name | Approach | |
|---|---|---|
| Method 1 | 2 points derivative | Second derivative approach |
| Method 2 | 3 points derivative | Second derivative approach |
| Method 3 | 5 points derivative | Second derivative approach |
| Method 4 | Rectangular-window parabolic filtration | Direct parabolic filtration approach |
| Method 5 | Sinc-window parabolic filtration | Direct parabolic filtration approach |
| Method 6 | Hamming window parabolic filtration | Direct parabolic filtration approach |
| Method 7 | Two SL ramp filters filtration | Two-ramp-filter approach |
The UIR for method 4 is shown in Eq. (10), which will be called hrec(n) to avoid confusion. The wave forms of the UIR and the frequency response are shown in Fig. 3(a) and (b) respectively.
The UIR for method 5 is shown in Eq. (19) (the derivation method is the same with that of the rectangular window parabola filter). The wave forms of the UIR and the frequency response are shown in Fig. 3(c) and (d) respectively.
The UIR of method 6 is shown in Eq. (20) (the derivation method is the same with that of the rectangular window parabola filter). The wave forms of the UIR and the frequency response are shown in Fig. 3(e) and (f) respectively.
| (19.1) (19.2) |
| (20) |
In Eq. (20), the function is undefined for n = −1 and n = 1. By inverse Fourier transform though, we can determine
| (21) |
For method 7, there are many different ramp filter options, e.g., Ram-Lak filter, Shepp-Logan filter, Hamming window ramp filter, and Hanning window ramp filter. Here, we choose to use two Shepp-Logan filters to demonstrate method 7.
4 Results and Discussion
Four experiments are performed to compare the effect of different filtration methods on image quality. Experiment 1 is to give a validation that the two-ramp-filter approach has inherent inaccuracies and that zero-padding can remedy them and improve image quality. Experiment 2 compares the 3 groups of filtration approaches by using 3 error criteria and 1 spatial resolution criterion. Experiment 3 compares the 3 groups of filtration approaches with 1% Gaussian noise added to the spatial projections. Experiment 4 evaluates these filtration approaches on real data from a physical bottle phantom.
4.1 The Simulated Model
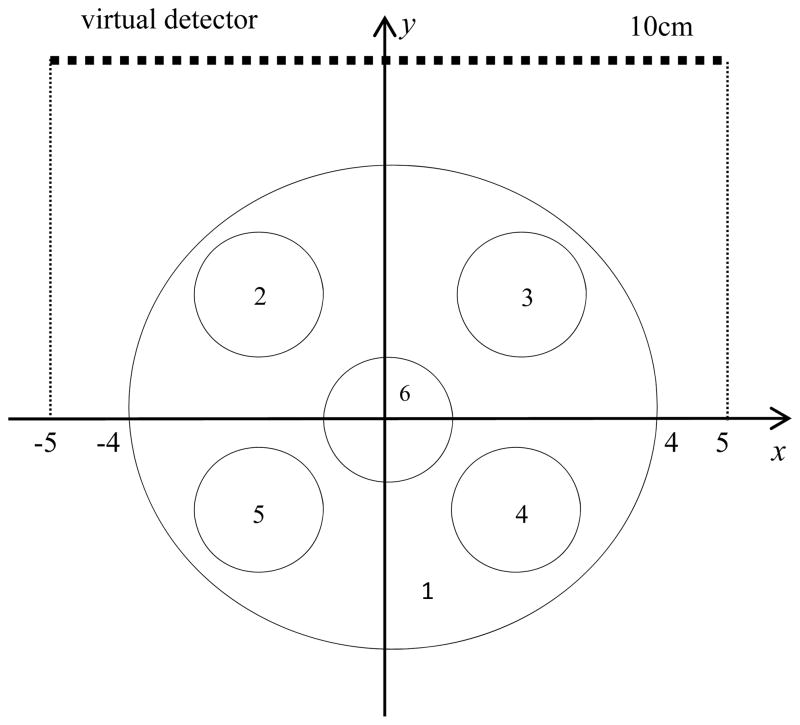
To evaluate the image precision quantitatively, we designed a phantom. The object used in this model consists of six spheres. Five non-overlapping small spheres are embedded into a larger sphere. Each sphere has a density in the range of [0,1]. The parameters of the model are shown in Table 2 and the diagram of the model and the virtual detector is shown in Fig. 4. The dynamic range of the model is from 0 to 1, which is the brightness range of gray image. The simulated phantom used here contains both high and low contrast, making it a suitable model for both qualitative and quantitative evaluation of image precision and spatial resolution.
Table 2.
The Parameters of the simulated model
| Sphere 1 | Sphere 2 | Sphere 3 | Sphere 4 | Sphere 5 | Sphere 6 | |
|---|---|---|---|---|---|---|
| Density | 0.5 | 0.6 | 0.7 | 0.8 | 0.9 | 1 |
| Coordinate of center of Sphere | [0,0,0] | [−2, 2,0] | [2,2,0] | [2,−2,0] | [−2,−2,0] | [0, 0,0] |
| Radius | 4cm | 1cm | 1cm | 1cm | 1cm | 1cm |
Fig. 4.
The diagram of the z = 0 slice of the simulated model which consists of 6 spheres. The length of the virtual detector is 10cm.
4.2 Reconstruction Error Criteria
To evaluate image reconstruction quality, different error criteria can be used. In this paper, we use the following 3 error criteria.
1) Mean absolute error (mae)
We will use the mean absolute error (emae) as our first error criterion. Note that the largest value and the amplitude of the dynamic range for the model are both 1. In this case, mean absolute error is essentially equivalent to mean relative error. For example, if emae is 0.00835, the mean relative error is 0.835%. This error criterion can be applied on a voxel-by-voxel basis as shown in Eq. (22).
| (22) |
Here, we assume that the 3D object has M voxels and f(m) is a voxel in the ideal model image and r(m) is the corresponding voxel in the reconstructed image.
2) Signal-to-noise ratio (snr)
If we consider the error in the reconstructed image to be noise, we can apply the notion of SNR as a metric of the error. SNR is a normalization criterion, i.e. it has nothing to do with the energy of the signal. This error criterion (esnr) can also be applied on a voxel-by-voxel basis as is shown in Eq. (23).
| (23) |
3) Normalized mean squared error (nms)
The normalized mean square error (enms) is another error metric, which is applied on a voxel by-voxel basis as shown in Eq. (24).
| (24) |
Here, f̄ is the average value of all voxels in the ideal model image.
4.3 Spatial Resolution Criterion: Edge Spread Function Method
The edge spread function (ESF) is used here to measure the spatial resolution. First, a set of 1D profiles, orthogonal to an edge in the image, are selected from the reconstructed image. These discrete profiles are then fit to a Gaussian error function. A set of FWHM (full width at half maximum) values are obtained according to the parameters of the error function fits. Finally, the spatial resolution is obtained by averaging the FWHM values. The measured deviation from the ideal step function, as determined from the FWHM, is a measure of spatial resolution. [6]
4.4 Simulation Experiments of the Two-Ramp-Filter Approach (Exp. 1)
To test the two-ramp-filter approach, a simulation experiment was performed. The experimental parameters are shown in Table 3. To observe the effect of zero-padding on this filtration method, various degrees of zero-padding resulting in intermediate signals of lengths 1, 1.1, 1.2, 1.3, 1.4, 1.6 and 2 times the length of the spatial projections are implemented.
Table 3.
The parameters of Exp. 1
| Algorithm | 3-D FBP | Filtration method | Two-ramp-filters method |
|---|---|---|---|
| Interpolation method | Linear | Ramp filter type | Shepp-logan filter |
| Length of projection | 10cm | Sampling interval of projection | 0.1cm |
| Angle sampling model | Uniform solid angle | Number of polar angle | 100 |
| Number of azimuthal angle | 100 | Sampling interval of the reconstructed image | 0.1cm |
| Matrix size of the reconstructed image | 100*100*100 |
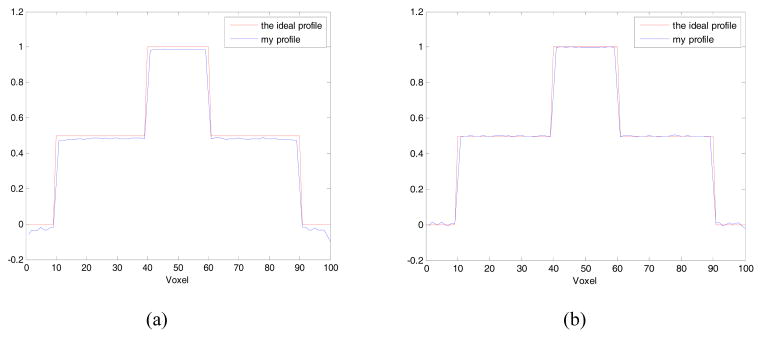
The reconstructed images are shown in Fig. 5, the error images are shown in Fig. 6, the error criteria and spatial resolution criterion for each zero-padding case are shown in Table 4. The central profiles of the reconstructed object without zero-padding and with zero-padding to double the length are shown in Fig. 7(a) and (b) respectively.
Fig. 5.
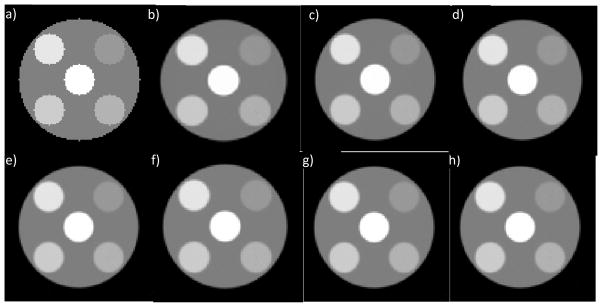
The central slices of the reconstructed objects using the two-ramp-filters filtration method. To improve the image quality, zero padding technique is used, with different zero padding multiple applied to compare the effects. a) is the standard model image. b) to h) are the reconstructed images with the spatial projections are zero-padded to 1, 1.1, 1.2, 1.3, 1.4, 1.6, 2 times length respectively. (Exp. 1)
Fig. 6.
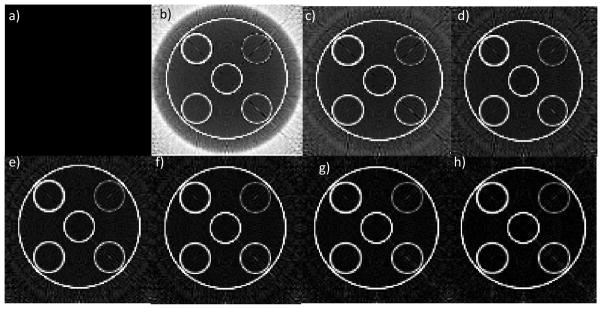
The error images of Exp. 1 with a display window [0, 0.1]. a) is the standard model error image. b) to h) are the reconstructed error images with the spatial projections are zero-padded to 1, 1.1, 1.2, 1.3, 1.4, 1.6, 2 times length respectively.
Table 4.
The error criteria and spatial resolution criterion of Exp. 1
| Zero padding times | 1 | 1.1 | 1.2 | 1.3 | 1.4 | 1.6 | 2 |
|---|---|---|---|---|---|---|---|
| emae | 0.0576 | 0.0231 | 0.0158 | 0.0118 | 0.0100 | 0.0082 | 0.0072 |
| esnr | 17.34 | 75.10 | 100.86 | 114.12 | 119.02 | 122.93 | 124.68 |
| enms | 0.2792 | 0.1342 | 0.1158 | 0.1088 | 0.1066 | 0.1049 | 0.1041 |
| Spatial resolution(mm) | 1.5111 | 1.5100 | 1.5094 | 1.5090 | 1.5067 | 1.5065 | 1.5064 |
Fig. 7.
The profile of the central row of the central slice of the reconstructed object. No zero padding is used for (a) and 2 times zero padding is used for (b). (Exp. 1)
From Fig. 5, differences between reconstructed images are essentially visually indistinguishable. However, a constant offset is present in the object reconstructed without zero-padding. From Fig. 7(a), we can see that the reconstructed voxel values are less than the standard object values. This constant offset is an artifact, which can be seen in Fig. 6. This indicates that the two-ramp-filter method has an inherent drawback in that it results in a constant offset artifact.
According to the theoretical analysis in Section 3.3, zero-padding can improve this inherent drawback and reduce such artifacts. From Fig. 6, it can be seen that the artifact becomes less prominent with longer, more zero-padded spatial projections. From Table 4, we find that the error determined from the 3 different error criteria become smaller with higher degrees of zero-padding used, while the spatial resolution is almost the same.
In Fig. 7(b), we can see that the constant shift phenomenon has disappeared, which indicates that the zero-padding technique solves the inherent defect of the two-ramp-filter approach.
4.5 Simulation experiments comparing these 7 filtration methods without Noise (Exp. 2)
As discussed in Section 3.4, seven filtration methods have been designed. An experiment with the same experimental parameters as those used in Exp. 1 (aside from the filtration parameters) is used to compare these 7 filtration methods.
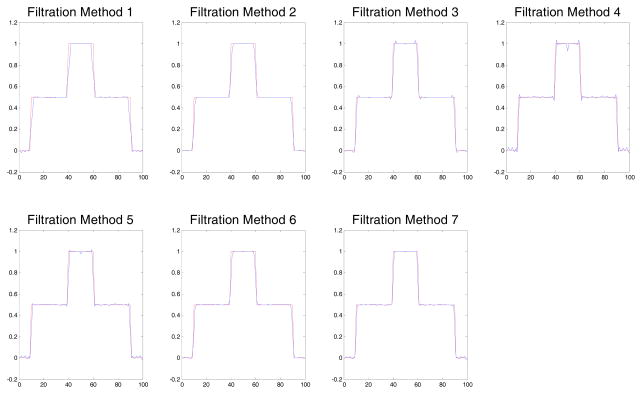
The reconstructed images using different filtration methods are shown in Fig. 8, the error criteria and spatial resolution criterion for these filtration methods are shown in Table 5, and the central profiles of the reconstructed objects are shown in Fig. 9.
Fig. 8.
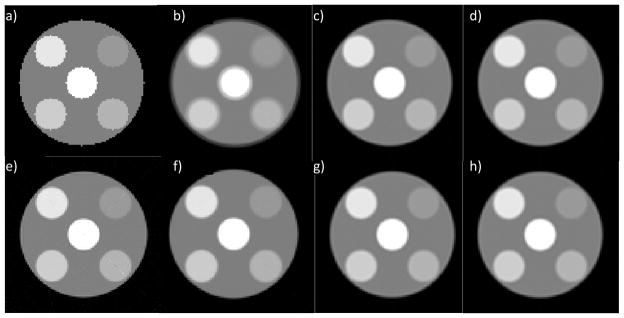
The central slices of the reconstructed object of Exp. 2. a) is the standard model image. b) to h) are the reconstructed images using Method 1 to 7 respectively. Clearly, the image reconstructed by Method 1 is blurry.
Table 5.
The error criteria and spatial resolution criterion of Exp. 2
| Index of filtration method | 1 | 2 | 3 | 4 | 5 | 6 | 7 |
|---|---|---|---|---|---|---|---|
| emae | 0.0219 | 0.0088 | 0.0079 | 0.0089 | 0.0074 | 0.0079 | 0.0072 |
| esnr | 17.64 | 65.61 | 89.55 | 149.89 | 142.08 | 79.81 | 124.68 |
| enms | 0.2768 | 0.1435 | 0.1229 | 0.0950 | 0.0975 | 0.1301 | 0.1041 |
| Spatial resolution(mm) | 1.9640 | 2.3920 | 1.7116 | 1.1268 | 1.3131 | 2.0496 | 1.5064 |
Fig. 9.
The central profiles of the central slices of the reconstructed objects of Exp. 2.
From Fig. 8, it can be seen that the image of method 1 is more blurry than the others. Furthermore, Fig. 9 shows that the profile using method 1 is not sharp enough. These two figures indicate that the 2 point method results in lower spatial resolution.
Upon analysis of the data in Table 5, it can be seen that Method 4 (rectangular-window parabolic filtration) and Method 5 (sinc-window parabolic filtration) are two of the best methods, which simultaneously provide relatively small errors and high spatial resolution.
4.6 Simulation experiments comparing the 7 filtration methods with Gaussian noise (Exp. 3)
To test the efficacy and applicability of the 7 filtration methods in the presence of Gaussian noise, Exp. 2 is repeated with Gaussian noise added to the spatial projections. The SNR used is 40 dB, which means that the energy of the projection signal is 10000 times that of the Gaussian noise.
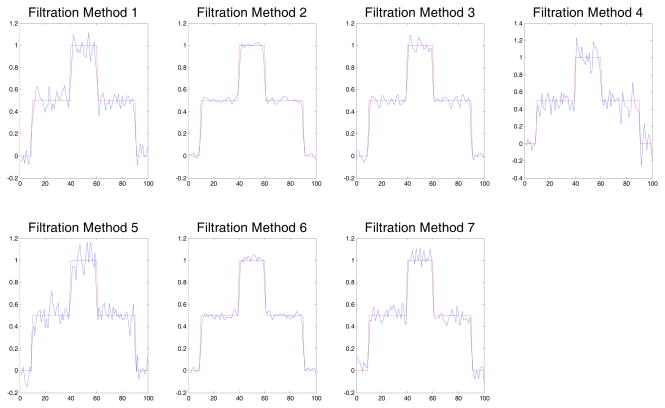
Reconstructed images using different filtration methods are shown in Fig. 10, the error criteria and spatial resolution criterion of these filtration methods are shown in Table 6, and the central profiles of the reconstructed objects are shown in Fig. 11.
Fig. 10.
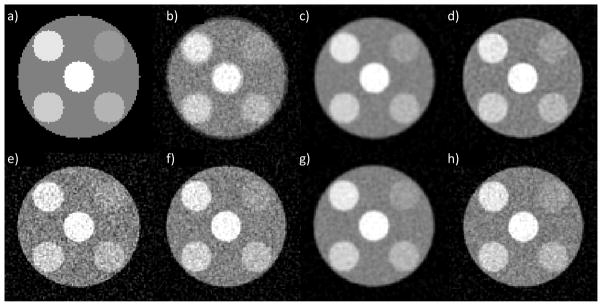
The central slices of the reconstructed objects with Gaussian noise added to the projections. a) is the standard model image. b) to h) are the reconstructed images using Method 1 to 7 respectively. Clearly, Method 2 and 6 are better. (Exp. 3).
Table 6.
The error criteria and spatial resolution criterion of Exp. 3
| Index of filtration method | 1 | 2 | 3 | 4 | 5 | 6 | 7 |
|---|---|---|---|---|---|---|---|
| emae | 0.0543 | 0.0211 | 0.0276 | 0.0754 | 0.0577 | 0.0247 | 0.0457 |
| esnr | 10.52 | 51.31 | 45.21 | 8.33 | 13.97 | 49.40 | 21.46 |
| enms | 0.3584 | 0.1623 | 0.1729 | 0.4026 | 0.3110 | 0.1654 | 0.2509 |
| Spatial resolution(mm) | 2.1579 | 2.4502 | 1.7838 | 1.2174 | 1.3963 | 2.0808 | 1.7644 |
Fig. 11.
The central profiles of the central slices with Gauss noise added to the projections. (Exp. 3)
From Fig. 10 and 11, Method 2 and 6 can be seen to result in relatively high reconstruction precision for they have lower noise. However, Table 6 shows that Method 2 and Method 6 have relatively worse spatial resolution. This tradeoff between spatial resolution and SNR is as expected. No filtration method can reconstruct an image with the highest spatial resolution and the highest SNR and a compromise is therefore unavoidable. Method 2 and 6 produce images with spatial resolution of 2.45mm and 2.08mm respectively, which are both acceptable compared to the best resolution 1.22mm, making these methods the best options. Method 4 provides very good spatial resolution (1.22mm) but its reconstruction error is too large, making it a less acceptable option.
From Fig. 3(f), the frequency response of Hamming window parabolic filter can be seen to decrease between 60% and 100% of the Nyquist frequency. Clearly, the Hamming window parabolic filter can help to decrease high frequency noise. The frequency range of white Gaussian noise is from 0 to the Nyquist frequency, so we can conclude that Method 6 (Hamming window parabolic filtration method) results in smaller error and smaller noise by reducing the high frequency Gaussian noise components. In fact, 3 point filtration method is roughly equivalent to using a Hamming-like window to filter the spatial projection. This can explain why 3 point derivative method is always similar to Hamming window parabolic filtration method.
In summary, the 3 point filtration method and Hamming window parabolic filtration method are both good options for filtration of projections contaminated by Gaussian noise. Clearly, 3 point filtration is preferred because of its simple computation process.
4.7 Phantom experiments for comparing the 7 filtration methods (Exp. 4)
A phantom experiment, whose experimental parameters are shown in Table 7, is used to compare the 7 filtration methods. A photo of the bottle phantom used is shown in Fig. 17 (a).
Table 7.
The parameters of Exp. 4
| Algorithm | 3-D FBP | Filtration method | Method 1–Method 7 | ||
|---|---|---|---|---|---|
| Interpolation method | Linear | Points number of projection signal | 147 | ||
| Length of projection |
|
Length of bin of the reconstructed image |
|
||
| Angle sampling model | Uniform solid angle | Matrix size of the reconstructed image | 128*128*128 | ||
| Number of azimuthal angle | 18 | Number of polar angle | 18 |
There is noise in the acquired spatial projections, so a low pass filter must be used to reduce the noise before parabolic filtration process. However, the high frequency information of the object and the high frequency noise overlap, which implies that the high frequency information will inevitably be reduced by the low pass filter. Thus, a compromise must be made between low noise and high spatial resolution.
After the low pass filtration, the parabolic filtration is applied to the projections. Each parabolic filtration method has different properties. The aim of this section is to determine which method offers the best compromise between low noise and high spatial resolution.
The reconstructed object with reduced noise by a low pass filter whose bandwidth is 0.23 Nyquist frequency is shown in Fig. 12(b–d). It can be seen from the figure that, while the SNR is high, the spatial resolution is not very good, i.e. the edges in the image are not as sharp as they should be.
Fig. 12.

(a) is the photo of the real bottle phantom, in which there is spin probe liquid. (b) is the slice at x=39, (c) is the slice at y=64 and (d) is the slice at z=68. The display window is [0.001, maximum value of the object]. The bandwidth of the low pass filter is 0.23. (Exp. 4)
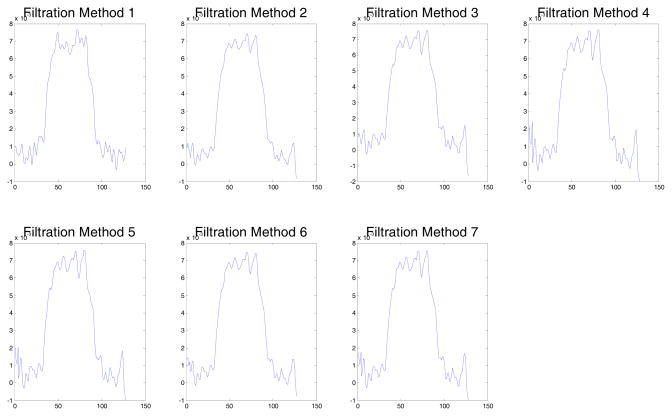
To improve spatial resolution, we determined that the use of a low pass filter with bandwidth 0.4 Nyquist frequency is an acceptable compromise. Slices through the reconstructed 3D objects are shown in Fig. 13 and the profiles along the white line shown in the images of Fig. 13 are shown in Fig. 14.
Fig. 13.

The reconstructed slices at x = 39 with a display window [0.0015, maximum value of the object]. The bandwidth of low pass filter is 0.4. a)–(g) are the images reconstructed using Method 1 to 7 respectively. (Exp. 4)
Fig. 14.
The profiles on the white lines of the images of Fig. 13. (Exp. 4)
From Fig. 13 and 14, we can see that images reconstructed using Methods 2 and 6 have lower noise, however they have lower spatial resolution: 1.48mm and 1.45mm, respectively. The best spatial resolution provided from Method 4 is 1.34mm which is just a little better than the resolutions of Method 2 and 6. Clearly, the 3 point filtration method (Method 2) and Hamming window parabolic filtration method (Method 6) offer good compromises between low noise and high spatial resolution.
We can also consider the case in which a low pass filter is not applied to the spatial projections so that all of the high frequency information of the object as well as the noise in the projection is maintained. Similar conclusion can be obtained that the 3 point filtration method and Hamming window parabola filtration method both provide good compromises between low noise and high spatial resolution in the reconstructed images.
5 Conclusion
In this work, we designed and implemented 7 parabolic filtration methods which can be divided into 3 groups: direct parabolic filtration, second derivative, and two-ramp-filter approaches.
To test and compare these 7 different filtration methods, 3 error criteria and 1 spatial resolution criterion were used to quantitatively evaluate the reconstructed objects. Four experiments, including simulated and real experiments, were used to compare the 7 filtration methods.
The 2 point method resulted in low spatial resolution and low precision, so it less attractive for EPRI image reconstruction applications discussed here. The two-ramp-filter method consistently creates an offset artifact in the reconstructed images. Although we found that zero-padding was a reasonable method for reducing this artifact, the results suggest that this method is not ideal for the EPRI applications discussed here.
In the noiseless case, the rectangular window parabolic filtration method and sinc window parabolic filtration method were found to be the best filtration methods, simultaneously providing relatively small errors and higher spatial resolution.
In the presence of Gaussian noise, the 3 point filtration method and Hamming window parabolic filtration method both offer good compromises between low noise and high spatial resolution. The implementation process of the 3 point filtration method mainly involves subtraction, whereas the implementation of the Hamming window parabolic filtration method mainly involves convolution. Since convolution requires multiplication and addition, the 3 point filtration method is faster.
For real experimental spatial projections, noise is necessarily present, but one must be cautious not to select too narrow a bandwidth for the low pass filter in order to retain the high frequency content of the reconstructed object. In this case, 3 point method can provide a good compromise, so we conclude that the 3 point filtration method is the optimal option for real EPR imaging.
Acknowledgments
This work is supported by NIH grants (EB002034 and CA98575)
References
- 1.Halpern Howard J, Spencer David P, vanPolen Jerry, Bowman Michael K, Nelson Alan C, Dowey Elizabeth M, Teicher Beverly A. Imaging radio frequency electron-spin-resonance spectrometer with high resolution and sensitivity for in vivo measurements. Review of Scientific Instruments. 1989;60(6):1040–1050. [Google Scholar]
- 2.Epel Boris, Haney Chad R, Hleihel Danielle, Wardrip Craig, Barth Eugene D, Halpern Howard J. Electron paramagnetic resonance oxygen imaging of a rabbit tumor using localized spin probe delivery. Medical physics. 2010;37:2553. doi: 10.1118/1.3425787. [DOI] [PMC free article] [PubMed] [Google Scholar]
- 3.Epel Boris, Sundramoorthy Subramanian V, Barth Eugene D, Mailer Colin, Halpern Howard J. Comparison of 250 MHz electron spin echo and continuous wave oxygen EPR imaging methods for in vivo applications. Medical Physics. 2011;38:2045. doi: 10.1118/1.3555297. [DOI] [PMC free article] [PubMed] [Google Scholar]
- 4.Som Subhojit, Potter Lee C, Ahmad Rizwan, Kuppusamy Periannan. A parametric approach to spectral–spatial EPR imaging. Journal of Magnetic Resonance. 2007;186(1):1–10. doi: 10.1016/j.jmr.2006.12.018. [DOI] [PMC free article] [PubMed] [Google Scholar]
- 5.Redler Gage, Epel Boris, Halpern Howard J. Principal component analysis enhances SNR for dynamic electron paramagnetic resonance oxygen imaging of cycling hypoxia in vivo. Magnetic Resonance in Medicine. 2013 doi: 10.1002/mrm.24631. 00-00. [DOI] [PMC free article] [PubMed] [Google Scholar]
- 6.Ahn Kang-Hyun, Halpern Howard J. Spatially uniform sampling in 4-D EPR spectral-spatial imaging. Journal of Magnetic Resonance. 2007;185(1):152–158. doi: 10.1016/j.jmr.2006.12.007. [DOI] [PMC free article] [PubMed] [Google Scholar]
- 7.Ahn Kang-Hyun, Halpern Howard J. Simulation of 4D spectral-spatial EPR images. Journal of Magnetic Resonance. 2007;187(1):1–9. doi: 10.1016/j.jmr.2007.02.013. [DOI] [PMC free article] [PubMed] [Google Scholar]
- 8.Ahn Kang-Hyun, Halpern Howard J. Comparison of local and global angular interpolation applied to spectral-spatial EPR image reconstruction. “. Medical physics. 2007;34:1047. doi: 10.1118/1.2514090. [DOI] [PubMed] [Google Scholar]
- 9.Ahn Kang-Hyun, Halpern Howard J. Object dependent sweep width reduction with spectral–spatial EPR imaging. Journal of Magnetic Resonance. 2007;186(1):105–111. doi: 10.1016/j.jmr.2007.01.021. [DOI] [PMC free article] [PubMed] [Google Scholar]
- 10.Ahmad Rizwan, Clymer Bradley, Vikram Deepti S, Deng Yuanmu, Hirata Hiroshi, Zweier Jay L, Kuppusamy Periannan. Enhanced resolution for EPR imaging by two-step deblurring. Journal of Magnetic Resonance. 2007;184(2):246–257. doi: 10.1016/j.jmr.2006.10.007. [DOI] [PMC free article] [PubMed] [Google Scholar]
- 11.Som Subhojit, Potter Lee C, Ahmad Rizwan, Vikram Deepti S, Kuppusamy Periannan. EPR oximetry in three spatial dimensions using sparse spin distribution. Journal of Magnetic Resonance. 2008;193(2):210–217. doi: 10.1016/j.jmr.2008.05.004. [DOI] [PMC free article] [PubMed] [Google Scholar]
- 12.Mailer Colin, Sundramoorthy Subramanian V, Pelizzari Charles A, Halpern Howard J. Spin echo spectroscopic electron paramagnetic resonance imaging. Magnetic resonance in medicine. 2006;55(4):904–912. doi: 10.1002/mrm.20849. [DOI] [PubMed] [Google Scholar]
- 13.Tseitlin Mark, Dhami Amarjot, Eaton Sandra S, Eaton Gareth R. Comparison of maximum entropy and filtered back-projection methods to reconstruct rapid-scan EPR images. Journal of Magnetic Resonance. 2007;184(1):157–168. doi: 10.1016/j.jmr.2006.09.027. [DOI] [PMC free article] [PubMed] [Google Scholar]
- 14.Hsieh Jiang. SPIE. 2009. Computed tomography: principles, design, artifacts, and recent advances. [Google Scholar]
- 15.Deans Stanley Roderick. The Radon transform and some of its applications. Dover Publications. Com; 2007. [Google Scholar]
- 16.Mitra Sanjit KK. Digital signal processing: a computer-based approach. McGraw-Hill Higher Education; 2000. [Google Scholar]
- 17.Gerald Curtis F, Wheatley Patrick O. Numerical analysis. Addison-Wesley; 2003. [Google Scholar]


