Abstract
The search for effective treatments for obesity and its comorbidities is of prime importance. We previously identified IKK-ε and TBK1 as promising therapeutic targets for the treatment of obesity and associated insulin resistance. Here we show that acute inhibition of IKK-ε and TBK1 with amlexanox treatment increases cAMP levels in subcutaneous adipose depots of obese mice, promoting the synthesis and secretion of the cytokine IL-6 from adipocytes and preadipocytes, but not from macrophages. IL-6, in turn, stimulates the phosphorylation of hepatic Stat3 to suppress expression of genes involved in gluconeogenesis, in the process improving glucose handling in obese mice. Preliminary data in a small cohort of obese patients show a similar association. These data support an important role for a subcutaneous adipose tissue–liver axis in mediating the acute metabolic benefits of amlexanox on glucose metabolism, and point to a new therapeutic pathway for type 2 diabetes.
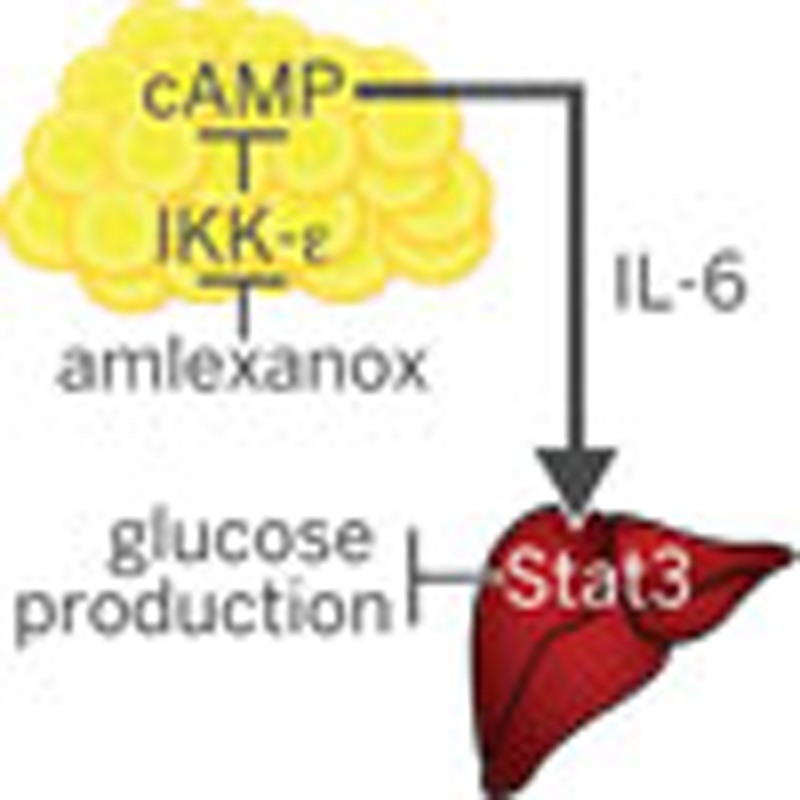 The drug amlexanox is known to improve obesity-related metabolic dysfunction in mice. Here the authors show that this effect is mediated by interleukin-6 secreted from subcutaneous adipocytes, which then inhibits gluconeogenesis in the liver by phosphorylating the hepatic transcription factor Stat3.
Accumulating evidence indicates that the chronic low-grade inflammation associated with obesity plays an important role in the development of metabolic disease. Obesity induces an increase in the NF-κB pathway1,2,3, which leads to induction of the non-canonical IKKs, IKK-ε and TBK1 in adipose tissue and liver4,5,6,7. Once induced, these kinases can initiate a counter-inflammatory programme by phosphorylating and activating phosphodiesterase 3B (PDE-3B) in adipocytes, thus producing reduced levels of cAMP and resistance to stimulation by catecholamines such as epinephrine and norepinephrine8. This resulting catecholamine resistance reduces energy expenditure and thermogenesis, and contributes to the development of obesity in humans and mice8,9,10,11,12. Our previous studies demonstrated that inhibition of IKK-ε/TBK1 with the dual-specificity inhibitor amlexanox improved catecholamine and insulin resistance, and resulted in significant weight loss and reversal of metabolic disease in obese mice, but had no effect on normal-chow fed mice in which the kinases are not elevated8,13.
While improved catecholamine sensitivity may account for the dramatic weight loss observed after IKK-ε and TBK1 inhibition in obese mice, the mechanism of improved insulin sensitivity and glucose handling remains uncertain. A euglycemic–hyperinsulinemic clamp revealed that the insulin-sensitizing effects of amlexanox were mainly attributed to suppression of hepatic glucose production13. Moreover, insulin sensitization was observed prior to significant weight loss in obese mice. However, it was not clear whether the effects of amlexanox in the liver were mediated through direct inhibition of hepatic IKK-ε/TBK1 or another indirect mechanism. Here we describe one indirect pathway by which inhibition of IKK-ε and TBK1 in the subcutaneous adipose tissue affects reduced hepatic glucose production. Specifically, inhibition of IKK-ε and TBK1 by amlexanox stimulates the secretion of interleukin-6 (IL-6) from adipocytes as well as preadipocytes in the subcutaneous adipose tissue via a cAMP/p38-dependent pathway. The resulting increase in serum IL-6 is responsible for the activation of hepatic Stat3, which suppresses expression of G6pc to reduce hepatic glucose output.
Results
Direct versus indirect effects of amlexanox in the liver
To determine the mechanism by which amlexanox improves hepatic insulin sensitivity, we performed RNA sequencing analysis of hepatic gene expression a few hours after in vivo amlexanox treatment, and identified over 1,700 differentially expressed genes (GEO accession code GSE57054). Pathway analysis of these differentially regulated genes revealed that the top two most enriched pathways were the adipocytokine signalling pathway and the Jak/Stat signalling pathway, presumably activated by a tissue-derived ligand (Supplementary Table 1).
Amlexanox treatment induces IL-6 signalling
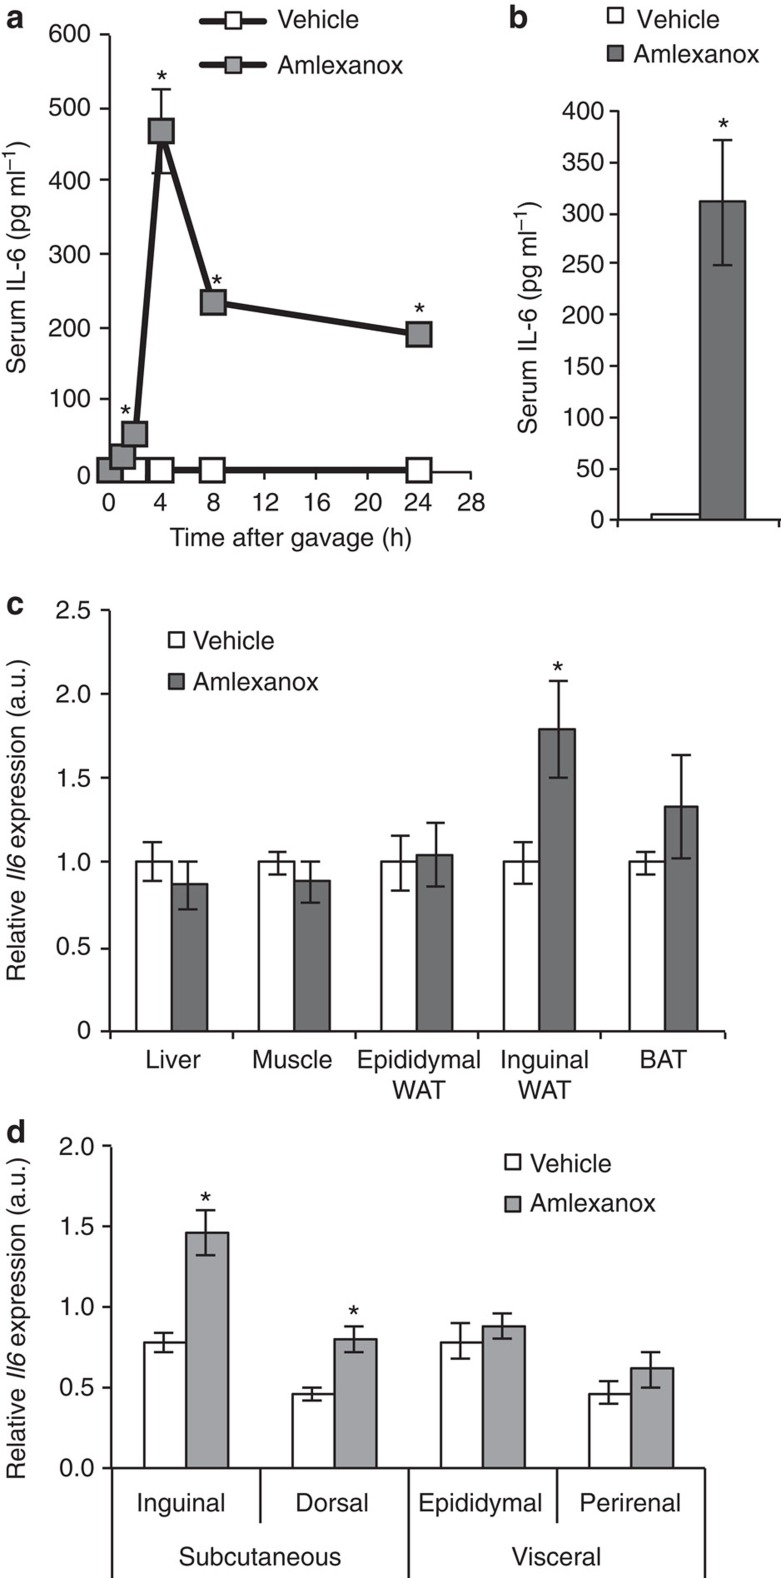
The preponderance of Jak/Stat responsive genes in the RNA sequencing analysis led us to hypothesize that early effects of amlexanox in the liver might, at least partially, be due to the increased appearance of cytokines in the circulation. We thus screened serum from amlexanox-treated obese mice for a series of cytokines known to be upstream of the Jak/Stat pathway, and identified one, IL-6. Time course studies revealed that serum IL-6 levels were significantly elevated soon after amlexanox treatment, peaking 4 h after gavage with the drug (Fig. 1a,b). Increased serum levels of leukemia-inducible factor were also observed with amlexanox treatment; this IL-6 family ligand may also contribute to the effects of amlexanox on Jak/Stat signalling (Supplementary Fig. 1). No changes in other IL-6 family ligands, including leptin, were observed. To identify the source of IL-6, we performed gene expression analysis in various tissues from mice treated for 4 h with amlexanox. No difference was observed in muscle, liver or epididymal fat Il6 messenger RNA (mRNA) levels (Fig. 1c). However, there was a significant increase in Il6 expression in the inguinal adipose tissue. Consistent with preferential induction of Il6 expression in subcutaneous fat, we also observed increased expression in the dorsal subcutaneous depot, but not in the perirenal visceral fat (Fig. 1d). The precise mechanism regulating the depot specificity of Il6 expression is unclear, as similar differences are not observed when the tissues are treated ex vivo8.
Figure 1. Inhibition of IKK-ε/TBK1 by amlexanox results in IL-6 secretion from subcutaneous adipose tissue.
(a) Time course of IL-6 secretion after amlexanox administration (n=4 mice per time point). (b) Serum IL-6 levels 4 h after amlexanox treatment (n=8 mice per treatment). (c) Il6 gene expression across tissues. BAT, brown adipose tissue (n=8 mice per treatment); WAT, white adipose tissue. (d) Relative Il6 expression in different fat pads (n=8 mice per treatment). * indicates a P value<0.05 (heteroscedastic t-test (a,b), students t-test (c,d)) amlexanox versus vehicle. Error bars presented as s.e.m.
Amlexanox induces Il6 expression specifically in adipocytes
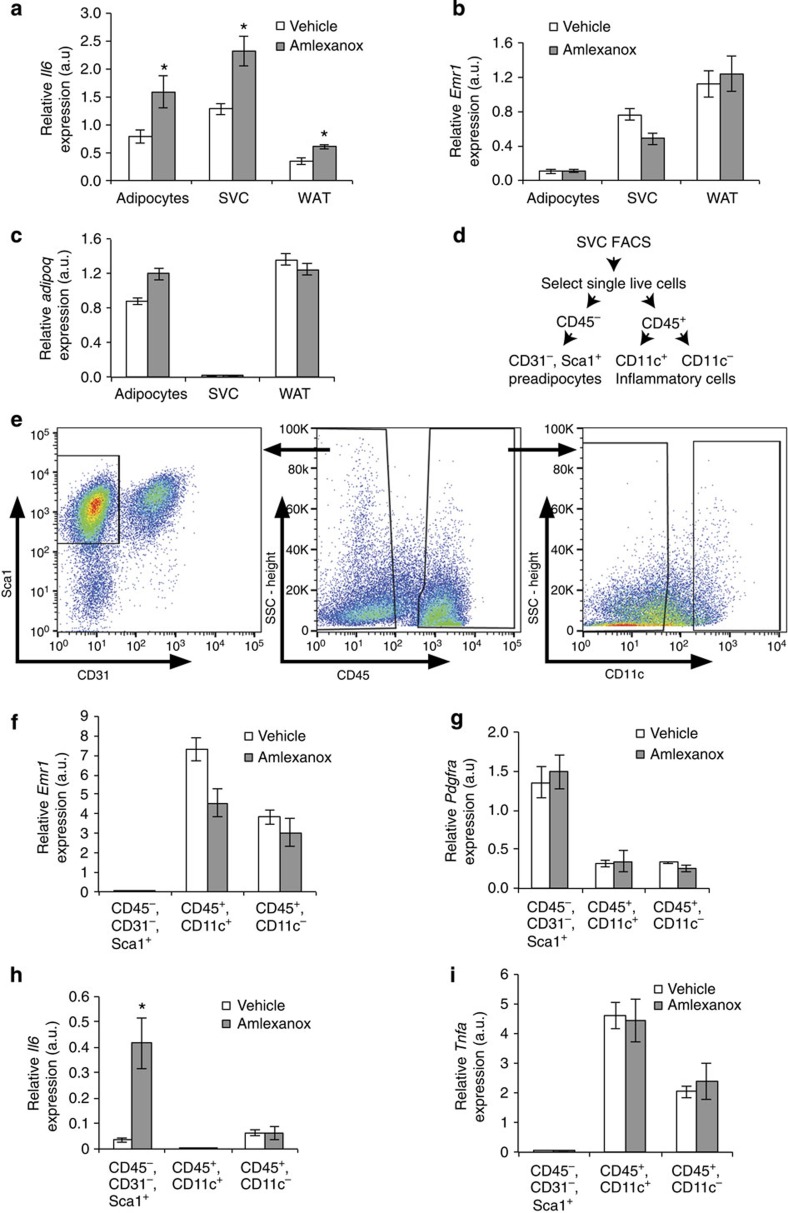
To determine which cell type within the subcutaneous fat was responsible for amlexanox-stimulated IL-6 secretion, we fractionated the tissue and measured Il6 expression levels in the various cell types. Increased Il6 expression was observed both in mature adipocytes and the stromal vascular cells (SVC) (Fig. 2a). Emr1 expression was restricted to the SVC, indicating that there was negligible macrophage contamination of the mature adipocyte fraction from the inguinal white adipose tissue (Fig. 2b). As expected, Adipoq expression was exclusive to the mature adipocytes (Fig. 2c). We further sorted the SVC to evaluate the amlexanox-induced Il6 expression in preadipocytes versus immune cells (Fig. 2d,e). Emr1 expression was exclusive to the CD45+ cells, confirming the sorting of macrophages into this population (Fig. 2f). In addition, enriched expression of Pdgfra confirmed the identity of the preadipocyte population (Fig. 2g). Amlexanox induced Il6 expression specifically in the preadipocyte population but not in CD45+ cells (Fig. 2h). Importantly other cytokines such as Tnfa were specifically expressed in the CD45+ immune cells (Fig. 2i). These data indicate that amlexanox specifically directs Il6 expression in adipocytes as well as preadipocytes, but interestingly not in immune cells such as macrophages.
Figure 2. Cellular specificity of amlexanox induced Il6 expression within fat.
(a) Il6 expression in mature adipocytes, SVC and whole inguinal adipose tissue (n=8 mice fractionated individually per treatment). (b) Relative Emr1 (F4/80, a macrophage marker) and (c) Adipoq (a mature adipocyte marker) expression in the different inguinal adipose tissue fractions (n=8 mice per treatment). (d,e) Gating strategy for fluorescence-activated cell sorting (FACS) of SVC. (f) Relative Emr1 and (g) Pdgfra (a preadipocyte marker) expression in different inguinal stromal cell fractions (n=4 groups of 2). (h) Il6 and (i) Tnfa expression in preadipocytes (CD45−, CD31−, Sca1+) and immune cells (CD45+ cells, both CD11c+ and CD11c− populations) (n=4 separations per treatment each consisting of pooled inguinal fat from 2 mice). * indicates a P value<0.05 (heteroscedastic t-test) amlexanox versus vehicle. Error bars presented as s.e.m.
Induction of Il6 expression in adipocytes via cAMP signalling
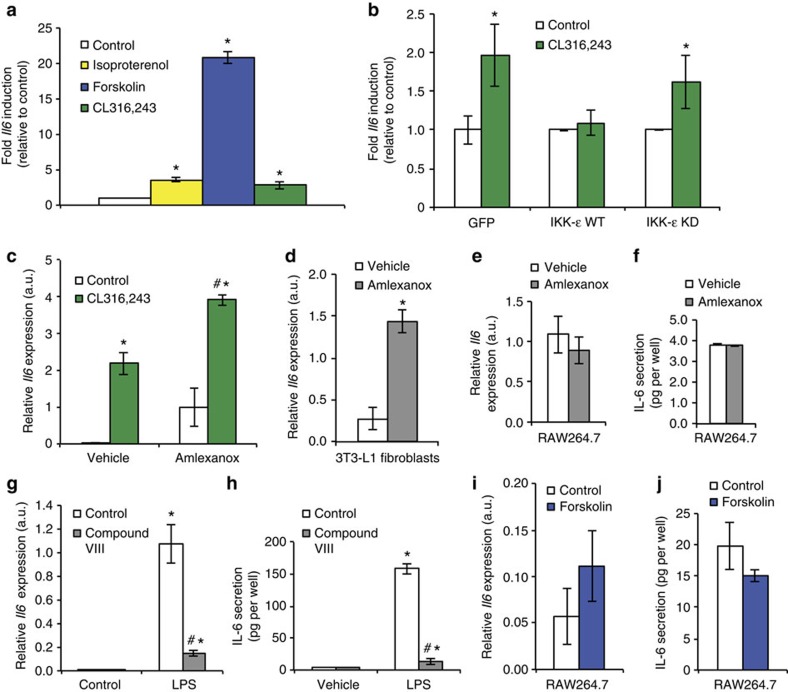
In adipocytes, IKK-ε and TBK1 phosphorylate and activate PDE-3B, thereby reducing intracellular cAMP levels and contributing to catecholamine resistance8, which has been well-described in obese rodents and patients9,10,12. Inhibition of IKK-ε/TBK1 by amlexanox in vivo and in vitro relieves this inhibition and restores catecholamine sensitivity8. Downstream of cAMP, p38 activation leads to increased expression of Ucp1 (refs 14, 15, 16), which likely contributes to increased energy expenditure in amlexanox-treated mice. Interestingly, the Il6 gene is also reported to be a downstream target of cAMP signalling17,18. Consistently, treatment of 3T3-L1 adipocytes with the β-adrenergic agonists isoproterenol and CL316,243, as well as the adenylyl cyclase activator, forskolin, significantly increased Il6 expression (Fig. 3a).
Figure 3. Induction of Il6 by β-adrenergic signalling in adipocytes.
(a) Relative induction of Il6 expression after pharmaceutical activation of β-adrenergic signalling (10 μM isoproterenol and CL316,243) or adenylyl cyclase (50 μM forskolin). (b) Relative induction of Il6 by 10 μM CL316,243 after overexpression of green fluorescent protein control, IKK-ε wild type (WT) or IKK-ε kinase dead mutant (KD). (c) Expression of Il6 in cells treated with 10 μM CL316,243 after 1 h pretreatment with 100 μM amlexanox or vehicle control. (d) Relative Il6 expression in 3T3-L1 fibroblasts after 2 h amlexanox treatment. (e) Relative Il6 expression and (f) IL-6 secretion in RAW264.7 cells after 2 h of amlexanox treatment. (g) Relative Il6 expression and (h) IL-6 secretion in RAW264.7 cells after 2 h of 0.5 μg ml−1 lipopolysaccharide (LPS) treatment, with 1 h pretreatment with 2 μM Compound VIII. (i) Relative Il6 expression and (j) IL-6 secretion in RAW264.7 cells after 2 h of 50 μM forskolin treatment. * indicates P value<0.05 (student’s t-test (a,b,d) or two-way ANOVA plus Tukey–Krammer post-hoc analysis; c,g,h) versus control. # indicates P value<0.05 (two-way ANOVA plus Tukey–Krammer post-hoc analysis) vehicle versus anmelxanox (c) or Compound VIII versus control (g,h). Error bars presented as s.e.m.
To recapitulate the obese state, we overexpressed wild-type IKK-ε in 3T3-L1 adipocytes, which was sufficient to cause catecholamine resistance and block the upregulation of Il6 in response to CL316,243 (Fig. 3b). Importantly, the kinase dead mutant of IKK-ε was without effect. Furthermore, consistent with an inhibitory effect of IKK-ε and TBK1 on cAMP signalling, pretreatment of cells with amlexanox significantly potentiated the effect of CL316,243 on Il6 expression (Fig. 3c). Amlexanox also increased Il6 expression in undifferentiated 3T3-L1 fibroblasts (Fig. 3d), but failed to induce Il6 expression in the RAW264.7 macrophage cell line (Fig. 3e,f), consistent with the expression pattern described above for SVC in vivo. As a positive control, we further investigated Il6 expression in RAW264.7 macrophages. As expected RAW264.7 cells robustly produce IL-6 in response to lipopolysaccharide, via the NF-κB pathway (Fig. 3g,h). However, unlike adipocytes, RAW264.7 macrophages do not produce IL-6 in response to forskolin, indicating that IL-6 production in macrophages occurs through a pathway different from that used in adipocytes (Fig. 3i,j).
Amlexanox-induced IL-6 expression is cAMP/p38 dependent
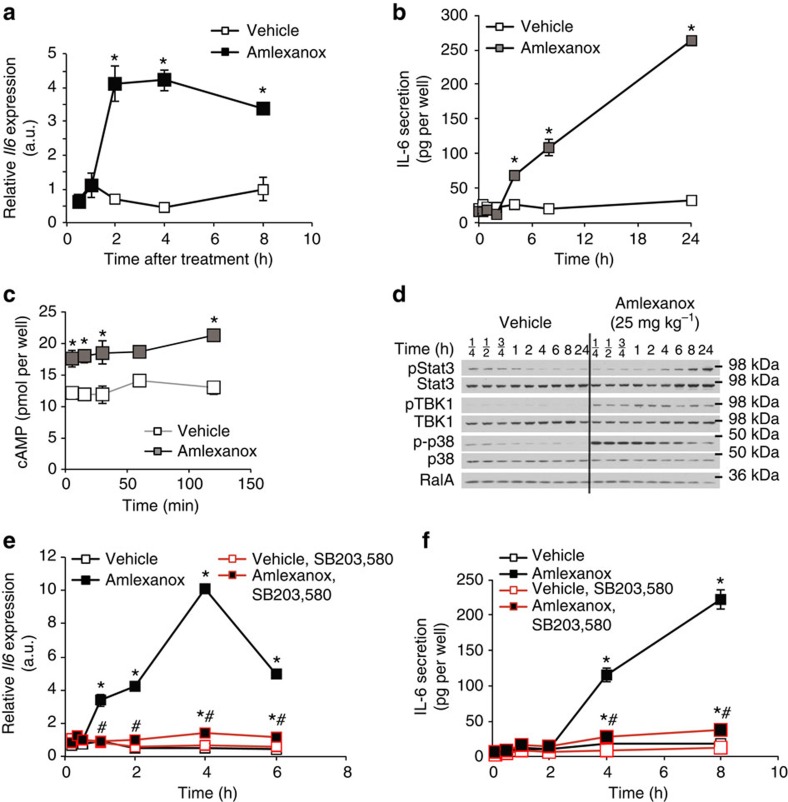
Treatment of 3T3-L1 adipocytes with amlexanox alone for 2 h significantly increased Il6 expression (Fig. 4a). The amlexanox-induced increase in Il6 expression correlated with secretion of IL-6 from 3T3-L1 adipocytes into the cell culture media 4 h after treatment (Fig. 4b). As predicted by the proposed mechanism involving reduced PDE-3B activity, amlexanox induced a significant increase in cellular cAMP levels in adipocytes (Fig. 4c), confirming that the drug increases IL-6 secretion from adipocytes via increased cAMP signalling.
Figure 4. IL-6 secretion from adipocytes by a cAMP/p38-dependent pathway in vitro.
(a) Il6 expression in 3T3-L1 adipocytes after amlexanox treatment (n=3 wells per treatment per time point). (b) IL-6 secretion from 3T3-L1 adipocytes after amlexanox treatment (n=3 wells per treatment per time point). (c) cAMP in 3T3-L1 adipocytes treated with amlexanox for 5, 15, 30, 60 and 120 min (n=3 wells per treatment per time point). (d) Immunoblot analysis of Stat3, TBK1 and p38 phosphorylation in 3T3-L1 adipocytes treated with amlexanox for indicated times. RalA serves as loading control. (e) Il6 expression in 3T3-L1 adipocytes after amlexanox treatment with and without pre-treatment with SB203,580 (n=3 wells per treatment per time point). (f) IL-6 secretion from 3T3-L1 adipocytes after amlexanox treatment with and without pre-treatment with SB203,580 (n=3 wells per treatment per time point). * indicates P value<0.05 (student’s t-test a–c or two-way ANOVA plus Tukey–Krammer post-hoc analysis e,f) amlexanox treated versus vehicle control. # indicates P value<0.05 (two-way ANOVA plus Tukey–Krammer post-hoc analysis) amlexanox, SB203,580 treated versus amlexanox only. Error bars presented as s.e.m.
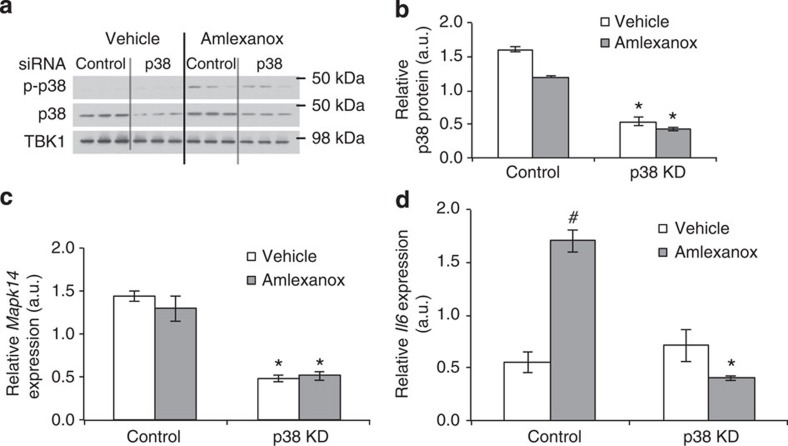
Induction of Il6 by cAMP has been previously shown to be dependent on p38 (refs 18, 19, 20). Consistent with this notion, p38 phosphorylation increased after amlexanox treatment (Fig. 4d and Supplementary Fig. 2). Notably, the stimulation of p38 phosphorylation by amlexanox was rapid, occurring over a time course similar to its ability to relieve the feedback inhibition of TBK1 phosphorylation8. The induction of Stat3 phosphorylation in these adipocytes was not observed until after 4 h of treatment, a lag consistent with the time course of secretion of IL-6 into the media. Further supporting that Il6 induction by amlexanox is mediated by a p38-dependent pathway downstream of cAMP, pretreatment of adipocytes with the p38 inhibitor SB203,580 completely blocked the effect of amlexanox to increase both Il6 expression and IL-6 secretion (Fig. 4e,f). The dependency of amlexanox-induced IL-6 secretion in adipocytes on p38 was confirmed by short interfering RNA-mediated knockdown of p38 (Mapk14) prior to amlexanox treatment (Fig. 5 and Supplementary Fig. 3). To verify that these effects of amlexanox were mediated by its inhibition of IKK-ε/TBK1, we utilized another structurally unrelated inhibitor of these kinases CAY-10576. Treatment of 3T3-L1 adipocytes with CAY-10576 also increased the expression and secretion of IL-6 in a p38-dependent manner (Supplementary Fig. 4), confirming that this effect is due to inhibition of IKK-ε/TBK1, and not a non-specific effect of amlexanox.
Figure 5. Knockdown of p38 blocks amlexanox-stimulated Il6 expression in adipocytes.
Validated stealth RNAi to Mapk14 (1320001) and control (12935300) from Life Technologies was electroporated into 3T3-L1 adipocytes on day 1 of 10% FBS only media, and then 4 days after electroporation, vehicle and amlexanox treatments were administered after a 3-h serum starve. (a) Immunoblots for total and phosphorylated p38 protein. (b) quantification of immunoblots in a. (c) Further validation of p38 knockdown using Q-PCR to measure Mapk14 mRNA levels. (d) mRNA levels of Il6 after 4 h of amlexanox treatment in control and p38 knockdown cells (n=3 wells per condition). * indicates P value<0.05 p38 KD versus control, # indicates P value<0.05 amlexanox versus vehicle (two-way ANOVA plus Tukey–Krammer post-hoc analysis). Error bars represent s.e.m.
Amlexanox-induced IL-6 signalling is p38-dependent in vivo
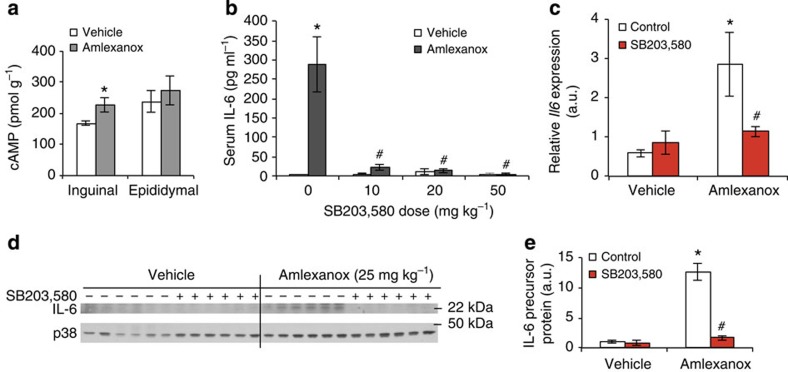
We also explored the role of the cAMP/p38 pathway in vivo. Similar to the induction of Il6 expression, amlexanox treatment specifically increased cAMP levels in inguinal adipose tissue (Fig. 6a). To demonstrate that the stimulatory effect of amlexanox on IL-6 secretion was downstream of this pathway, we pretreated mice by oral gavage with SB203,580. The stimulatory effect of amlexanox on serum IL-6 levels was inhibited by p38 blockade (Fig. 6b). Consistent with p38-dependent induction of IL-6 in inguinal adipose tissue by amlexanox, we observed a significant increase in Il6 mRNA levels as well as IL-6 precursor protein levels, both of which were completely blocked by administration of SB203,580 (Fig. 6c–e and Supplementary Fig. 5).
Figure 6. IL-6 secretion from adipocytes by a cAMP/p38-dependent pathway in vivo.
(a) cAMP levels in adipose tissue 4 h after amlexanox treatment in vivo (n=8 mice per treatment). (b) Serum IL-6 levels 4 h after amlexanox treatment following SB203,580 pre-treatment (n=6 amlexanox-treated and 5 vehicle control mice per SB203,580 dose). (c) Il6 expression and (d) IL-6 precursor protein levels in inguinal adipose tissue 4 h after amlexanox treatment following SB203,580 pre-treatment, quantification in left panel (n=6 mice per treatment). (e) quantification of immunoblots in d. * indicates P value<0.05 (student’s t-test a or two-way ANOVA plus Tukey–Krammer post-hoc analysis b–e) amlexanox treated versus vehicle control. # indicates P value<0.05 (two-way ANOVA plus Tukey–Krammer post-hoc analysis) amlexanox, SB203,580 treated versus amlexanox only. Error bars represent s.e.m.
Hepatic Stat3 activation is observed with amlexanox treatment
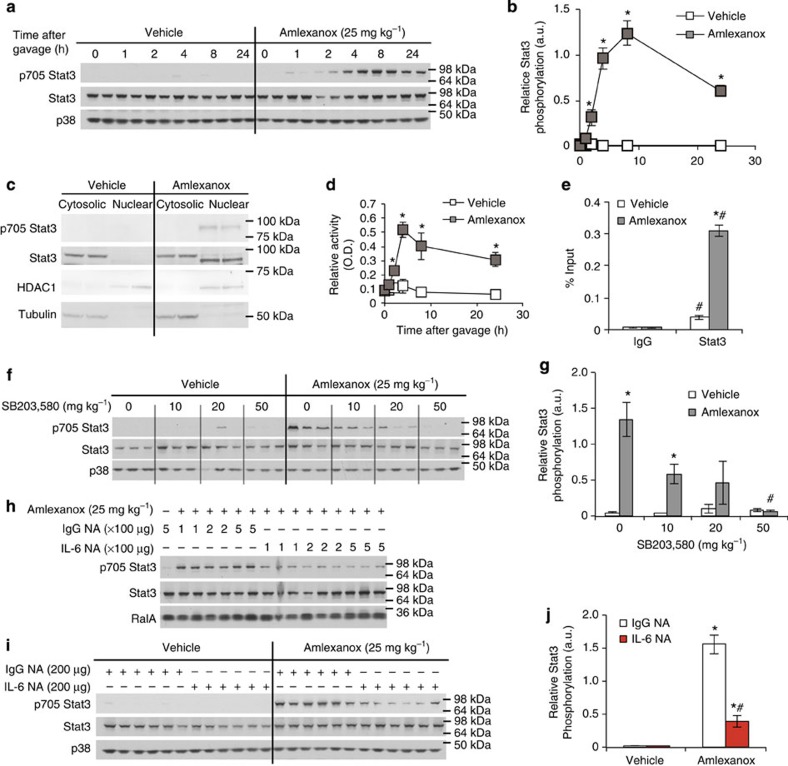
Next, we investigated whether the increase in serum IL-6 after amlexanox treatment was associated with increased Stat3 activity in the liver. Following administration of amlexanox to obese mice, we assayed phosphorylation of Stat3 at tyrosine 705, which mediates dimerization and subsequent nuclear localization and transcriptional regulation. Hepatic Stat3 phosphorylation was increased 4 h after amlexanox treatment, coincident with the increase in serum IL-6 levels (Figs 7a,b and 1a, respectively, Supplementary Fig. 6). As expected, Stat3 phosphorylation was specifically associated with nuclear localization and DNA binding in livers from the amlexanox-treated mice (Fig. 7c,d, respectively, Supplementary Fig. 7). Furthermore, amlexanox treatment significantly enriched Stat3 occupancy at the promoter of Socs3, a well-known Stat3 target gene (Fig. 7e).
Figure 7. IL-6 induced hepatic Stat3 activation.
(a) Time course of the effects of amlexanox treatment on hepatic Stat3 phosphorylation. (b) quantification of immunoblots in a. (c) Immunoblot analysis of STAT3 and phosphorylated STAT3 in nuclear and cytosolic fractions after 8 h treatment with amlexanox or vehicle control. HDAC1 and Tubulin are positive controls for the nuclear and cytosolic fractions, respectively. (d) Stat3 and IgG control ChIP at Stat3 binding site in the Socs3 promoter (n=3). (e) Stat3 DNA binding activity after amlexanox treatment in vivo (n=4 mice per time point). (f) Hepatic Stat3 phosphorylation in amlexanox-treated and vehicle control mice with varying doses of pretreatment with SB203,580. (g) quantification of immunoblots in f. (h,i) Hepatic Stat3 phosphorylation in amlexanox-treated and vehicle control mice after pretreatment with either IL-6 neutralizing antibody or sera-type matched IgG control antibody; (h) 4 h after amlexanox gavage and (i) 8 h after amlexanox gavage. (j) quantification of immunoblots in i. * indicates P value<0.05 (student’s t-test b,e and two-way ANOVA plus Tukey–Krammer post-hoc analysis d,g,j) amlexanox treated versus vehicle control. # indicates P value<0.05 (ANOVA plus Tukey–Krammer post-hoc analysis) Stat3 versus IgG in d, amlexanox, SB203,580 treated versus amlexanox only in g and IL-6 NA versus IgG NA in f. Error bars represent s.e.m.
Activation of hepatic Stat3 is dependent on IL-6 signalling
Pre-treatment with SB203,580 dose dependently decreased amlexanox-stimulated hepatic Stat3 phosphorylation, coordinating well with decreases in serum IL-6 levels (Figs 7f,g and 6b, respectively, Supplementary Fig. 8). To causally link serum IL-6 to hepatic Stat3 phosphorylation, we utilized an IL-6 neutralizing antibody. We tested a range of neutralizing antibody doses, all of which efficiently blocked amlexanox-stimulated hepatic Stat3 phosphorylation (Fig. 7h and Supplementary Fig. 9). While the IgG control antibody had no effect on the amlexanox or vehicle control-treated mice, the IL-6 neutralizing antibody blocked the stimulation of Stat3 phosphorylation in the amlexanox-treated mice, but had no effect in the vehicle-treated mice (Fig. 7i,j and Supplementary Fig. 10). We opted to use neutralizing antibodies instead of genetic knockout of Il6 in these acute studies, thus avoiding confounding effects of IL-6 deficiency throughout development and on responses to diet.
Suppression of G6pc expression by Stat3
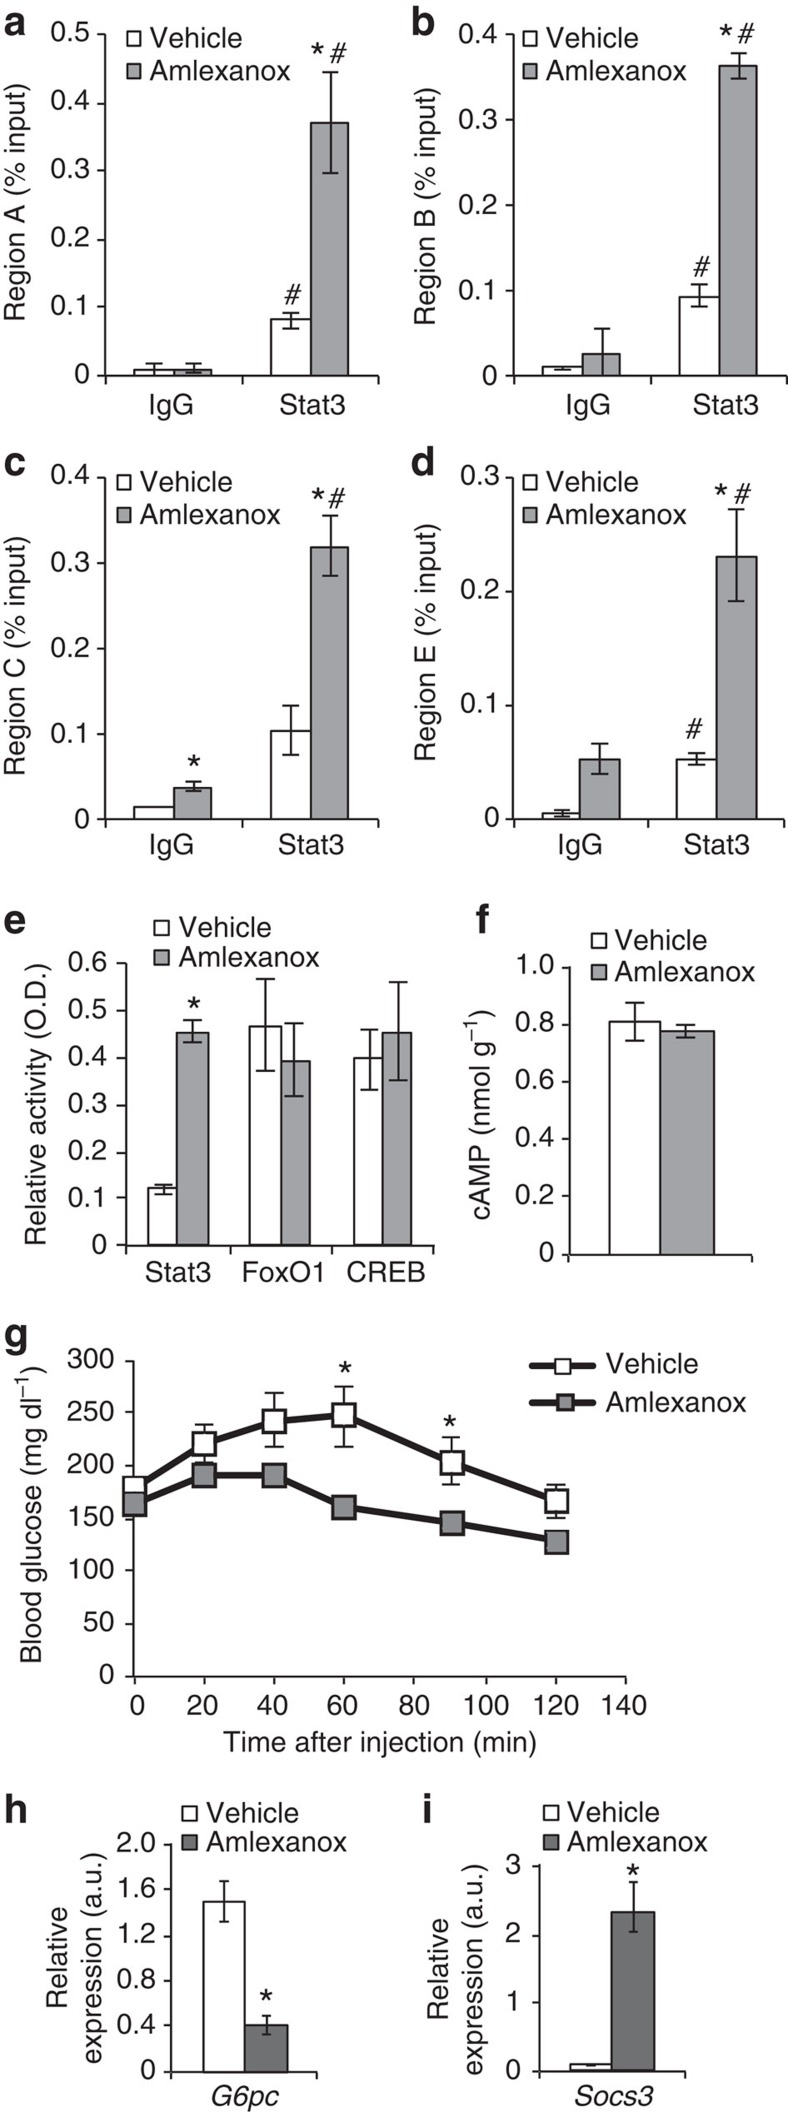
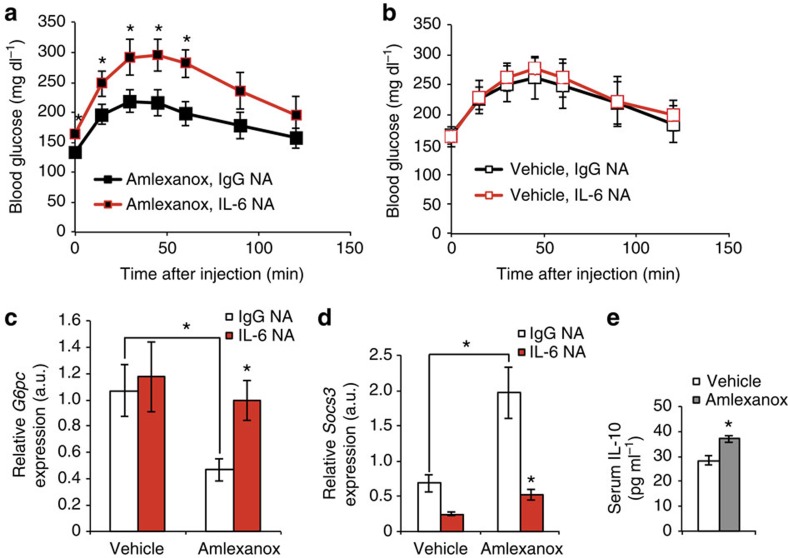
In the liver, Stat3 activity is associated with suppression of gluconeogenic gene expression, specifically G6pc (refs 21, 22, 23). Increased binding of Stat3 to the G6pc promoter at all four previously characterized binding regions was observed in liver derived from amlexanox-treated mice (Fig. 8a–d). Amlexanox treatment specifically increased DNA binding by Stat3, but not FoxO1 or CREB, indicating that the latter transcription factors are likely not involved in the regulation of G6pc expression by the drug (Fig. 8e). Consistent with the indirect effects of amlexanox in the liver and lack of effect on CREB, amlexanox did not increase cAMP levels in liver (Fig. 8f). We verified that treatment with amlexanox results in reduced gluconeogenesis in obese mice after only 3 days of treatment, by performing a pyruvate tolerance test (Fig. 8g). Consistent with Stat3 activation by IL-6, the reduction in hepatic glucose production was associated with reduced expression of G6pc, and increased expression of Socs3 (Fig. 8h,i). Furthermore, treatment with an IL-6 neutralizing antibody completely blocked the anti-gluconeogenic effects of amlexanox treatment, as determined by a pyruvate tolerance test (Fig. 9a,b). The IL-6 neutralizing antibody also blocked the suppression of gluconeogenic gene expression by amlexanox, as well as the induction of Socs3 expression (Fig. 9c,d).
Figure 8. Amlexanox reduces hepatic glucose production via suppression of G6pc.
(a–d) Stat3 and IgG control ChIP of regions A–C and E of the G6pc promoter (n=3). (e) DNA binding activity of transcription factors known to regulate G6pc expression (liver nuclear lysates from eight mice per condition). (f) Liver cAMP levels 4 h after amlexanox treatment (n=8 mice per treatment). (g) Pyruvate tolerance test in amlexanox and vehicle control-treated mice (n=6 mice per treatment). Hepatic expression of (h) G6pc and (i) Socs3 in amlexanox and vehicle control-treated mice, respectively, (n=8 mice per treatment). * indicates P value<0.05 amlexanox treated versus vehicle control. # indicates P value<0.05 Stat3 versus IgG (two-way ANOVA plus Tukey–Krammer post-hoc analysis a–d and student’s t-test e–i). Error bars represent s.e.m.
Figure 9. Amlexanox reduces hepatic glucose production in an IL-6-dependent manner.
Pyruvate tolerance test in mice pretreated with either IL-6 neutralizing antibody (NA) or serotype-matched IgG control antibody (n=6 mice per treatment) before either (a) amlexanox or (b) vehicle control treatment. Hepatic expression of (c) G6pc and (d) Socs3 in amlexanox-treated and vehicle control mice after pretreatment with either IL-6 NA or sera-type matched IgG control antibody (n=6 mice per treatment). (h) Serum IL-10 levels 4 h after amlexanox or vehicle control treatment. * indicates P value<0.05 (student’s t-test a,b,e and ANOVA plus Tukey–Krammer post-hoc analysis c,d) IL-6 neutralizing antibody versus IgG control and amlexanox treated versus vehicle control (e and as indicated in c,d) or error bars represent s.e.m.
Long-term benefits could be mediated by reduced inflammation
The exact role of IL-6-mediated suppression of gluconeogenesis in the long-term insulin-sensitizing effects of amlexanox remains to be fully elucidated. IL-6 signalling has previously been shown to have anti-inflammatory effects in liver as well as inflammatory cells24,25. Therefore, it is possible that IL-6 stimulates the resolution of chronic low-grade inflammation, as seen with long-term amlexanox treatment13. Interestingly, serum IL-10 levels increase after both short and long-term amlexanox treatment (Fig. 9e)13.
Potential relevance to human disease
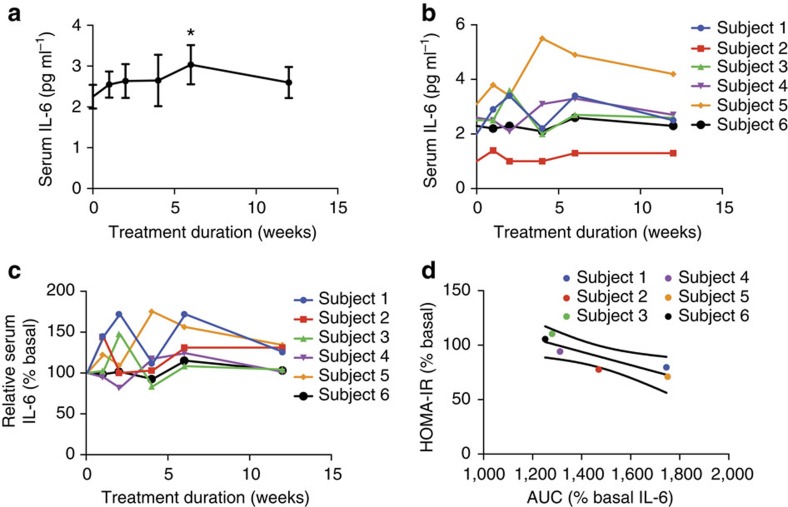
To explore whether a similar crosstalk occurs in humans, we investigated the relationship between circulating IL-6 levels and measures of insulin sensitivity in a small cohort of obese-diabetic patients treated with amlexanox in a 12-week open-label clinical trial. In the mice, we observed the most robust effects on IL-6 signalling over the first 24 h of drug treatment. However, the earliest serum withdrawal in this clinical trial was 1 week after initiation of treatment. In addition, differences in the dosage of amlexanox in this clinical trial further obfuscate direct comparison with the IL-6 response in the animal studies. Nevertheless, a relatively small but statistically significant increase in serum IL-6 levels was observed after the sixth week of treatment, in these patients (Fig. 10a). Increased serum IL-6 levels were also observed during the first 2 weeks of treatment in four of the six patients (Fig. 10b). The relative increase in serum IL-6 in response to amlexanox treatment varied from patient to patient, with some patients showing a more pronounced response than others, even after baseline normalization (Fig. 10c).
Figure 10. Improved HOMA-IR correlates with IL-6 response in human subjects treated with amlexanox.
(a) Average serum IL-6 levels in human subjects over the course of 12 weeks of amlexanox treatment (n=6). * indicates P value<0.05 (paired t-test) indicated time point versus baseline. Error bars represent s.e.m. (b) Individual serum IL-6 levels in human subjects over the course of 12 weeks of amlexanox treatment (n=6). (c) Individual baseline normalized IL-6 levels over the course of 12 weeks of amlexanox treatment (n=6). (d) Linear regression of change in HOMA-IR score with baseline normalized IL-6 area under curve (AUC). Y-axis: % basal HOMA-IR=(HOMA-IR after 12 weeks of treatment)/(HOMA-IR at baseline) × 100%. X-axis: AUC (% basal serum IL-6 over the 12 weeks of treatment—such that a value of 1,200 indicates no response and a value of 1,800 corresponds with an average 1.5-fold increase in serum IL-6 levels over the 12 weeks of treatment).
Although fasting blood glucose levels and the homeostasis model assessment-estimated insulin resistance (HOMA-IR) score tended to be lower after amlexanox treatment, these results did not reach statistical significance in this small cohort (Supplementary Fig. 11). Hypothesizing that the insulin-sensitizing effect of amlexanox treatment in humans is associated with the relative IL-6 response, we performed a linear regression analysis to determine whether the IL-6 response correlated with improvements in the HOMA-IR score, as a measure of insulin sensitivity26,27,28. To quantify the IL-6 responsiveness for each patient, we calculated the area under the curve for serum IL-6 levels after normalization to baseline for each patient. We calculated the HOMA-IR score at the end of the 12-week study as a per cent of baseline HOMA-IR for each individual patient. There was a significant correlation (P value=0.02, R2 value=0.8) between the IL-6 response and improvements in the HOMA-IR score (Fig. 10d). Although we have limited power in a cohort of this size, these data are consistent with the subcutaneous adipose tissue–liver communication axis that we observed in mice treated with amlexanox. The complete results of this clinical study will be reported elsewhere.
Discussion
The role of IL-6 in regulation of glucose homoeostasis has been controversial29. IL-6 levels are chronically increased in obesity and correlate with insulin resistance30,31,32,33, and reports suggest that the cytokine might contribute to insulin resistance through induction of Socs3 in hepatocytes34,35. However, other studies have suggested a beneficial effect of the cytokine36,37,38. Differences in the chronic versus acute metabolic effects of IL-6 may explain why contradictory results have been observed in genetic mouse models of disrupted IL-6 signalling. It is acutely secreted from skeletal muscle in response to exercise, and studies have indicated that it is produced from brown or white fat depots in response to sympathetic activation17,18,39,40,41,42. Adding further complexity to the metabolic effects of IL-6, our results indicate that IL-6 may also represent a crucial player in a subcutaneous adipose tissue–liver axis.
Taken together, these data indicate a new, previously unappreciated crosstalk between subcutaneous adipose tissue and liver in the control of glucose homoeostasis. These findings suggest that activation of the inflammatory programme in obesity induces expression of IKK-ε/TBK1 in both adipocytes and preadipocytes of subcutaneous fat, initiating a process of catecholamine resistance that reduces energy expenditure, but also suppresses the catecholamine-induced increase in adipose IL-6 expression, thereby contributing to elevated hepatic glucose production in obesity. Acute inhibition of IKK-ε/TBK1 by amlexanox reverses this catecholamine resistance, raising cAMP levels in subcutaneous adipose tissue, and in the process dramatically increasing IL-6 expression and subsequent activation of Stat3 in the liver to suppress gluconeogenesis. These studies reinforce the notion of IKK-ε/TBK1 inhibition as a promising therapeutic strategy for the treatment of insulin resistance in obese patients.
Methods
Reagents
All chemicals were obtained from Sigma-Aldrich unless otherwise stated. TBK1 (3013), phosphorylated TBK1 (Ser172-5483) diluted 1:500, Stat3 (9139), phosphorylated Stat3 (Tyr705-9131), p38 (9212), phosphorylated p38 (Thr180/Tyr182-9211), tubulin (2128)-specific antibodies were purchased from Cell Signaling. HDAC1 (H-51) and Stat3 (C-20)-specific antibodies were purchased from Santa Cruz. RalA (610222)-specific antibody was obtained from BD Bioscience and used at a dilution of 1:3,000. IL-6 antibody was obtained from Abcam (ab6672). All antibodies were diluted 1:1,000 unless otherwise noted. EDTA-free protease inhibitor tablet was purchased from Roche Diagnostics. For in vitro experiments InSolution SB203,580 (1 mg ml−1) was purchased from Calbiochem-EMD. For in vivo experiments SB203,580 powder was purchased from Selleck Chemicals.
Animals
We fed wild-type male C57Bl/6 mice a high fat diet consisting of 45% of calories from fat (D12451 Research Diets Inc.) starting at 8 weeks of age. Amlexanox was administered by daily oral gavage at a dose of 25 mg kg−1. SB203,580 was administered by oral gavage at the indicated doses 30–60 min prior to amlexanox administration. Mice were preconditioned to the oral gavage for a minimum of 1-week daily gavage with an equivalent volume of saline. Neutralizing antibodies (R&D AB-406-NA and AB-108-C) were administered by intraperitoneal injection just prior to oral gavage. During metabolic studies, such as pyruvate tolerance tests, ear tag numbers were used to identify individual animals and the researcher performing the test was blinded to the treatment group assignment during data collection. Cohorts of 20–44 mice were produced in up to 20 in-house breeding cages, and constructed to minimize the birthdate range. Mice were assigned to treatment groups, such that prior to treatment the mean body weight, as well as the s.d. of the body weight, was equal across treatment groups, using a method similar to block randomization. Additional consideration was given to housing, such that each cage contained multiple treatment groups, to avoid confounding by cage effects. Sample size was determined based on the available cohorts and the number of treatment groups required. Mice were housed in a specific pathogen-free facility with a 12-h light, 12-h dark cycle and given free access to food and water, except when food was restricted during fasting. All animal use was in compliance with the Institute of Laboratory Animal Research Guide for the Care and Use of Laboratory Animals and approved by the University Committee on Use and Care of Animals at the University of Michigan.
Pyruvate tolerance test
Fasting blood glucose levels from tail blood were measured after a 16-h fast, using the OneTouch Ultra glucometer (Lifescan). Mice were then given an intraperitoneal injection of sodium pyruvate (P2256) at a dose of 1.5 g kg−1 body weight. Blood glucose levels were measured again at 15, 30, 45, 60, 90 and 120 min post injection.
3T3-L1 differentiation
3T3-L1 fibroblasts (American Type Culture Collection) were cultured in DMEM containing 10% FBS. Once grown to confluence, adipocyte differentiation was initiated using a three component cocktail containing 500 μM 3-Isobutyl-1-methylxanthine, 250 nM dexamethasone and 1 μg ml−1 insulin for the first 3 days, followed by an additional 3 days of media containing insulin and finally differentiation was completed in the culture media. Only cultures in which >90% of cells displayed adipocyte morphology were used. Fully differentiated adipocytes, which had been cultured in the FBS only media for 1 week, were serum starved for 3 h in media containing 0.5% FBS, then treated with 100 μM amlexanox or vehicle control. Where applicable, cells were pretreated for 30 min with 5 mM SB203,580 or vehicle control.
IL-6 measurement
Mouse IL-6 levels were quantified using Mouse IL-6 Quantikine ELISA from R&D (SM6000B), with 50 μl of serum or cell culture media. Human IL-6 serum levels were quantified using the Human IL-6 Quantikine ELISA Kit (D6050) with 100 μl serum.
cAMP measurement in cells and tissues
Tissue cAMP levels were determined using the cAMP enzyme immunoassay kit (Sigma CA201) according to the manufacturer’s instructions. Cellular cAMP levels were determined using the cAMP enzyme immunoassay kit (Sigma CA200) according to the manufacturer’s instructions.
Western blot analysis
We homogenized tissues in lysis buffer (50 mM Tris pH 7.5, 150 mM NaCl, 2 mM EDTA, 10% glycerol, 1% Triton X-100, 1 mM dithiothreitol, 1 mM Na3VO4, 5 mM NaF, 1 mM phenylmethanesulfonylfluoride, 25 mM glycerol 2-phosphate and freshly added protease inhibitor tablet) and then incubated them for 1 h at 4 °C. Cell lysates were produced in an SDS lysis buffer (100 mM Tris pH 7.5, 130 mM NaCl, 1% NP-40, 0.1% SDS, 0.2% sodium deoxycholate, 1 mM Na3VO4, 1 mM NaF, 100 mM Na4P2O7, 1 mM phenylmethanesulfonylfluoride, 25 mM glycerol 2-phosphate and freshly added protease inhibitor tablet) and sonicated for three 5 s pulses at an output power of 6. We centrifuged crude lysates at 14,000 g for 15 min twice and determined the protein concentration using Bio-Rad Protein Assay Dye Reagent. Samples were diluted in SDS sample buffer. Bound proteins were resolved by SDS–PAGE and transferred to nitrocellulose membranes (Bio-Rad). Individual proteins were detected with specific antibodies and visualized on film using horseradish peroxidase-conjugated secondary antibodies (Bio-Rad) and Western Lightning Enhanced Chemiluminescence (Perkin Elmer Life Sciences).
SVC isolation and fluorescence-activated cell sorting
The stromal vascular fraction was separated from adipocytes by centrifugation after digestion. Excised white adipose tissue was digested in RPMI with 0.5% BSA and 1 mg ml−1 type II collagenase for 30 min at 37 °C with gentle agitation. Then the cell suspension was filtered through a 100 μm filter and centrifuged at 700 g for 5 min to separate floating adipocytes from SVC pellet, and RPMI with 0.5% BSA was used to wash cells. The following antibodies were used for staining: anti-CD45(30-F11), anti-CD31(390), anti-CD11c(N418) and anti-Sca-1(D7), all from eBioscience. Stained SVC were sorted by flow cytometry on a MoFlo Astrios cell sorter (Beckman Coulter) with the help of the University of Michigan’s Flow Cytometry Core.
Gene expression analysis
RNA extractions from tissues were performed using the RNeasy Lipid Tissue Kit (Qiagen) While RNA extraction from cells utilized the RNeasy Kit, we used the Superscript First-Strand Synthesis System for reverse transcription–PCR (Invitrogen) with a 3:1 mixture of random hexamers/oligo dT primers for reverse transcription. Real-time PCR amplification was performed on samples in triplicate with Power SYBR Green PCR Master Mix (Applied Biosystems) using the Applied Biosystems 7900HT Fast real-time PCR System and quantified using an internal standard curve and Arbp as the control gene. The sequences of all primers used in this study are listed in Supplementary Table 2.
RNA sequencing
Total RNA from mouse livers was isolated using Trizol (Invitrogen) and the RNeasy mini kit according to the manufacturer’s instructions. Biological triplicates of amlexanox-treated and non-treated tissues were used to prepare sequencing libraries from 100–500 ng total RNA using the TruSeq RNA Sample Preparation Kit v2 (Illumina) according to the manufacturer’s protocol.
Sample preparation. Briefly, mRNA was purified, fragmented and used for first- and second-strand complementary DNA synthesis followed by adenylation of 3′ ends. Samples were ligated to unique adapters and subjected to PCR amplification. Libraries were then validated using the 2100 BioAnalyzer (Agilent), normalized and pooled for sequencing on the Illumina HiSeq 2000 using bar-coded multiplexing and a 100 bp read length.
Data analysis. Read alignment and junction mapping was accomplished using TopHat2 v2.0.4 using a 25 bp 5′ segment seed for initial mapping followed by differential gene expression analysis using Cuffdiff v2.0.2 to map reads to the reference genome annotation, NCBI mouse build 37.2 (ref. 43). Median sequencing read yield per replicate sample was 24.2 M. Data were expressed as fragments per kilobase of exon per million fragments mapped . Volcano plots were generated from Cuffdiff output using CummeRbund v2.0.0 (ref. 43).
RNA-seq library construction. Single-cell complementary DNA size distribution and concentration were assessed on a capillary electrophoresis-based fragment analyser (Advanced Analytical). Illumina libraries were constructed in 96-well plates using the Illumina Nextera XT DNA Sample Preparation kit as described previously using the protocol supplied by Fluidigm. For each C1 experiment, a bulk RNA control (about 200 cells) and a no-cell negative control were processed in parallel in PCR tubes, using the same reagent mixes as used on chip. Libraries were quantified by Bioanalyzer, using High Sensitivity DNA analysis kit, and also fluorometrically using Qubit dsDNA HS Assay kits and a Qubit 2.0 Fluorometer (Invitrogen, Life Technologies).
DNA sequencing. Single-cell Nextera XT (Illumina) libraries of one experiment were pooled and 100 bp) paired-end were sequenced on Illumina HiSeq 2000 to a depth of (2–6) × 106 reads (three replicate experiments of distal mouse lung epithelial cells at E18.5, one experiment at E14.5 and one experiment on adult AT2 cells) or 150 bp paired-end on Illumina MiSeq (one experiment at E16.5) to a depth of 100,000–550,000 reads with v3 chemistry. CASAVA 1.8.2 was used to separate out the data for each single cell by using unique barcode combinations from the Nextera XT preparation and to generate *.fastq files.
KEGG pathway analysis
Normalized relative fold expression levels from RNA-Seq were calculated for selected genes and differentially expressed genes were determined. Pathway analysis was performed with DAVID Bioinformatics Resources 6.7 ( http://david.abcc.ncifcrf.gov/)44,45.
Chromatin immunoprecipitation
Flash-frozen vehicle or 8 h amlexanox-treated liver samples (~400 mg per chromatin immunoprecipitation (ChIP)) were thawed on ice and homogenized in 10 volumes 2 mM DSG (ProteoChem), incubated for 10 min at room temperature and then passed through a 70 μM mesh to remove extracellular debris. The homogenized cells were centrifuged, and pellets were resuspended in 1% formaldehyde in PBS and incubated at room temperature for 10 min. Formaldehyde crosslinking was quenched by the addition of glycine to a final concentration of 125 mM, and then incubated at room temperature for 5 min. The crosslinked cells were centrifuged and cell pellets were resuspended in ice cold Cell Lysis Buffer to isolate nuclei. The nuclei were collected by centrifugation, and then sonicated and chromatin was immunoprecipitated with 5 μg of Stat3 antibody (C-20) or normal rabbit IgG (Cell Signaling, 2729) overnight. Immunoprecipitated complexes were captured with protein A dynabeads (novex) for 90 min at 4 °C, washed and eluted from beads. Complexes were then decrosslinked, DNA was purified and real-time PCR was performed. Primer sequences used for ChIP can be found in Supplementary Table 3.
Transcription factor DNA binding assays
Nuclear extracts from liver were prepared using a nuclear extraction kit (Active Motif 40010). Ten nanograms of nuclear extract were used to assay specific transcription factor DNA binding activity using TransAM kits (Active Motif 45196, 46396 and 42092). These kits utilize response element DNA affixed to the plate and specific primary antibodies to quantify the relative DNA binding activity of specific transcription factors.
Clinical trial
Six obese type-2 diabetic patients (body mass index range 31 to 39 kg m−2, two males and four females, ages 24 to 68 years) were enroled in clinical trial NCT01842282. After patients gave informed consent, they were instructed to take amlexanox tablets (Takeda) in an open-label manner at a dosage of 25 mg three times daily. After 2 weeks, the dosage was increased to 50 mg tablets three times daily. Blood collection was performed at baseline and 1, 2, 4, 6 and 12 weeks of treatment, serum samples were frozen at −80 °C for future combined analysis. Patients were provided instructions for a standardized meal (600 kcal, 55% carbohydrates, 30% fat and 15% protein) and then instructed to fast overnight after 2200 hours prior to the baseline and 12-week visits, such that HOMA-IR could be calculated from measurements of fasted blood glucose and serum insulin. The study was reviewed and approved by the University of Michigan Medical School Institutional Review Board (IRBMED; HUM00065177).
Statistics
Averaged values are presented as the mean±s.e.m. Equality of variance was determined using an f-test. Data were determined to be normally distributed as the maximum and minimum values in each data set were <3 s.d. from the mean. When comparing the two groups, statistical significance was determined using the student’s t-test; except when the f-test indicated statistically different variances (P value<0.05), then a heteroscedastic t-test was used. When more than two groups were investigated, we first performed an analysis of variance (ANOVA) to establish that not all groups were equal. Following a statistically significant ANOVA, we performed between group comparisons using the Tukey–Krammer post-hoc analysis. Linear regression was used to determine correlation significance, and displayed as the best fit line with a 95% confidence band. Linear regression, ANOVA and Tukey–Krammer tests were performed using Prism version 6.0 (ref. 46).
Author contributions
A.R.S. and S.M.R. wrote the manuscript. S.M.R. created figures. S.M.R. performed experiments in Figures 1; 2a–c; 3c,d; 4; 5; 6; 7a,b,e–j; 8e–i; 9; 10d and Supplementary Figs 1–6 and 8–11. M.A. performed experiments in Figures 7c,d; 8a–d and Supplementary Figs 7. B.F.Z. and C.N.L. performed experiments in Figure 2d–i. L.C. performed experiments in Fig. 3e–j. M.U. performed experiments in Figure 3a,b. B.P. performed SVC isolation, RNA isolation and Q-PCR, as well as editing. X.P. maintained mouse colonies and performed oral gavage. D.M.K. performed RNA isolation for RNA sequencing. M.D., R.T.Y., C.L. and R.M.E. performed RNA sequencing and data analysis for Supplementary Tables 1 and 2. E.K., A.N., A.R.S. and E.A.O. designed and carried out the clinical trial and provided samples to S.M.R. for IL-6 measurement and correlation analysis in Fig. 10.
Additional information
How to cite this article: Reilly, S. M. et al. A subcutaneous adipose tissue–liver signalling axis controls hepatic gluconeogenesis. Nat. Commun. 6:6047 doi: 10.1038/ncomms7047 (2015).
Accession codes: The RNA sequencing data have been deposited in NCBI’s Gene Expression Omnibus under accession code GSE57054.
Supplementary Material
Supplementary Figures 1-11 and Supplementary Tables 1-3
Acknowledgments
We thank members of the Saltiel laboratory for helpful discussions. This work was supported by US National Institutes of Health grants DK60597 and 60591 to A.R.S., F32DK09685101 to S.M.R., R24DK090962 to A.R.S. and R.M.E. and DK98776 to E.A.O. and A.R.S. R.M.E., M.D. and R.T.Y. are supported by the Leona M. and Harry B. Helmsley Charitable Trust.
Footnotes
Alan Saltiel is a named inventor on patents pertaining to the therapeutic use of amlexanox. The other authors declare no competing financial interests.
References
- Baker R. G., Hayden M. S. & Ghosh S. NF-kappaB, inflammation, and metabolic disease. Cell Metab. 13, 11–22 (2011). [DOI] [PMC free article] [PubMed] [Google Scholar]
- Cai D. et al. Local and systemic insulin resistance resulting from hepatic activation of IKK-beta and NF-kappaB. Nat. Med. 11, 183–190 (2005). [DOI] [PMC free article] [PubMed] [Google Scholar]
- Arkan M. C. et al. IKK-beta links inflammation to obesity-induced insulin resistance. Nat. Med. 11, 191–198 (2005). [DOI] [PubMed] [Google Scholar]
- Kravchenko V. V., Mathison J. C., Schwamborn K., Mercurio F. & Ulevitch R. J. IKKi/IKKepsilon plays a key role in integrating signals induced by pro-inflammatory stimuli. J. Biol. Chem. 278, 26612–26619 (2003). [DOI] [PubMed] [Google Scholar]
- Saltiel A. R. Insulin resistance in the defense against obesity. Cell Metab. 15, 798–804 (2012). [DOI] [PubMed] [Google Scholar]
- Chiang S. H. et al. The protein kinase IKKepsilon regulates energy balance in obese mice. Cell 138, 961–975 (2009). [DOI] [PMC free article] [PubMed] [Google Scholar]
- Perkins N. D. Integrating cell-signalling pathways with NF-kappaB and IKK function. Nat. Rev. Mol. Cell Biol. 8, 49–62 (2007). [DOI] [PubMed] [Google Scholar]
- Mowers J. et al. Inflammation produces catecholamine resistance in obesity via activation of PDE3B by the protein kinases IKK{varepsilon} and TBK1. Elife 2, e01119 (2013). [DOI] [PMC free article] [PubMed] [Google Scholar]
- Bougneres P. et al. In vivo resistance of lipolysis to epinephrine. A new feature of childhood onset obesity. J. Clin. Invest. 99, 2568–2573 (1997). [DOI] [PMC free article] [PubMed] [Google Scholar]
- Collins S., Daniel K. W., Petro A. E. & Surwit R. S. Strain-specific response to beta 3-adrenergic receptor agonist treatment of diet-induced obesity in mice. Endocrinology 138, 405–413 (1997). [DOI] [PubMed] [Google Scholar]
- Surwit R. S., Dixon T. M., Petro A. E., Daniel K. W. & Collins S. Diazoxide restores beta3-adrenergic receptor function in diet-induced obesity and diabetes. Endocrinology 141, 3630–3637 (2000). [DOI] [PubMed] [Google Scholar]
- Kush R. D. et al. Effect of diet on energy expenditure and plasma norepinephrine in lean and obese Pima Indians. Metabolism 35, 1110–1120 (1986). [DOI] [PubMed] [Google Scholar]
- Reilly S. M. et al. An inhibitor of the protein kinases TBK1 and IKK-varepsilon improves obesity-related metabolic dysfunctions in mice. Nat. Med. 19, 313–321 (2013). [DOI] [PMC free article] [PubMed] [Google Scholar]
- Cao W. et al. p38 mitogen-activated protein kinase is the central regulator of cyclic AMP-dependent transcription of the brown fat uncoupling protein 1 gene. Mol. Cell Biol. 24, 3057–3067 (2004). [DOI] [PMC free article] [PubMed] [Google Scholar]
- Robidoux J. et al. Selective activation of mitogen-activated protein (MAP) kinase kinase 3 and p38alpha MAP kinase is essential for cyclic AMP-dependent UCP1 expression in adipocytes. Mol. Cell Biol. 25, 5466–5479 (2005). [DOI] [PMC free article] [PubMed] [Google Scholar]
- Cao W., Medvedev A. V., Daniel K. W. & Collins S. beta-Adrenergic activation of p38 MAP kinase in adipocytes: cAMP induction of the uncoupling protein 1 (UCP1) gene requires p38 MAP kinase. J. Biol. Chem. 276, 27077–27082 (2001). [DOI] [PubMed] [Google Scholar]
- Mohamed-Ali V. et al. beta-Adrenergic regulation of IL-6 release from adipose tissue: in vivo and in vitro studies. J. Clin. Endocrinol. Metab. 86, 5864–5869 (2001). [DOI] [PubMed] [Google Scholar]
- Tchivileva I. E. et al. Signaling pathways mediating beta3-adrenergic receptor-induced production of interleukin-6 in adipocytes. Mol. Immunol. 46, 2256–2266 (2009). [DOI] [PMC free article] [PubMed] [Google Scholar]
- Yin F. et al. Noncanonical cAMP pathway and p38 MAPK mediate beta2-adrenergic receptor-induced IL-6 production in neonatal mouse cardiac fibroblasts. J. Mol. Cell. Cardiol. 40, 384–393 (2006). [DOI] [PubMed] [Google Scholar]
- Tan K. S. et al. Beta2 adrenergic receptor activation stimulates pro-inflammatory cytokine production in macrophages via PKA- and NF-kappaB-independent mechanisms. Cell Signal 19, 251–260 (2007). [DOI] [PubMed] [Google Scholar]
- Ramadoss P., Unger-Smith N. E., Lam F. S. & Hollenberg A. N. STAT3 targets the regulatory regions of gluconeogenic genes in vivo. Mol. Endocrinol. 23, 827–837 (2009). [DOI] [PMC free article] [PubMed] [Google Scholar]
- Inoue H. et al. Role of STAT-3 in regulation of hepatic gluconeogenic genes and carbohydrate metabolism in vivo. Nat. Med. 10, 168–174 (2004). [DOI] [PubMed] [Google Scholar]
- Inoue H. et al. Role of hepatic STAT3 in brain-insulin action on hepatic glucose production. Cell Metab. 3, 267–275 (2006). [DOI] [PubMed] [Google Scholar]
- Mauer J. et al. Signaling by IL-6 promotes alternative activation of macrophages to limit endotoxemia and obesity-associated resistance to insulin. Nat. Immunol. 15, 423–430 (2014). [DOI] [PMC free article] [PubMed] [Google Scholar]
- Wunderlich F. T. et al. Interleukin-6 signaling in liver-parenchymal cells suppresses hepatic inflammation and improves systemic insulin action. Cell Metab. 12, 237–249 (2010). [DOI] [PubMed] [Google Scholar]
- Haffner S. M., Miettinen H. & Stern M. P. The homeostasis model in the San Antonio Heart Study. Diabetes Care 20, 1087–1092 (1997). [DOI] [PubMed] [Google Scholar]
- Katsuki A. et al. Homeostasis model assessment is a reliable indicator of insulin resistance during follow-up of patients with type 2 diabetes. Diabetes Care 24, 362–365 (2001). [DOI] [PubMed] [Google Scholar]
- Ikeda Y., Suehiro T., Nakamura T., Kumon Y. & Hashimoto K. Clinical significance of the insulin resistance index as assessed by homeostasis model assessment. Endocr. J. 48, 81–86 (2001). [DOI] [PubMed] [Google Scholar]
- Fisman E. Z. & Tenenbaum A. The ubiquitous interleukin-6: a time for reappraisal. Cardiovasc. Diabetol. 9, 62 (2010). [DOI] [PMC free article] [PubMed] [Google Scholar]
- Pickup J. C., Mattock M. B., Chusney G. D. & Burt D. NIDDM as a disease of the innate immune system: association of acute-phase reactants and interleukin-6 with metabolic syndrome X. Diabetologia 40, 1286–1292 (1997). [DOI] [PubMed] [Google Scholar]
- Kern P. A., Ranganathan S., Li C., Wood L. & Ranganathan G. Adipose tissue tumor necrosis factor and interleukin-6 expression in human obesity and insulin resistance. Am. J. Physiol. Endocrinol. Metab. 280, E745–E751 (2001). [DOI] [PubMed] [Google Scholar]
- Vozarova B. et al. Circulating interleukin-6 in relation to adiposity, insulin action, and insulin secretion. Obes. Res. 9, 414–417 (2001). [DOI] [PubMed] [Google Scholar]
- Pradhan A. D., Manson J. E., Rifai N., Buring J. E. & Ridker P. M. C-reactive protein, interleukin 6, and risk of developing type 2 diabetes mellitus. JAMA 286, 327–334 (2001). [DOI] [PubMed] [Google Scholar]
- Senn J. J., Klover P. J., Nowak I. A. & Mooney R. A. Interleukin-6 induces cellular insulin resistance in hepatocytes. Diabetes 51, 3391–3399 (2002). [DOI] [PubMed] [Google Scholar]
- Gwozdziewiczova S., Lichnovska R., Ben Yahia R., Chlup R. & Hrebicek J. TNF-alpha in the development of insulin resistance and other disorders in metabolic syndrome. Biomed. Pap. Med. Fac. Univ. Palacky Olomouc Czech Repub. 149, 109–117 (2005). [PubMed] [Google Scholar]
- Matthews V. B. et al. Interleukin-6-deficient mice develop hepatic inflammation and systemic insulin resistance. Diabetologia 53, 2431–2441 (2010). [DOI] [PubMed] [Google Scholar]
- Wallenius V. et al. Interleukin-6-deficient mice develop mature-onset obesity. Nat. Med. 8, 75–79 (2002). [DOI] [PubMed] [Google Scholar]
- Carey A. L. et al. Interleukin-6 increases insulin-stimulated glucose disposal in humans and glucose uptake and fatty acid oxidation in vitro via AMP-activated protein kinase. Diabetes 55, 2688–2697 (2006). [DOI] [PubMed] [Google Scholar]
- Burysek L. & Houstek J. beta-Adrenergic stimulation of interleukin-1alpha and interleukin-6 expression in mouse brown adipocytes. FEBS Lett. 411, 83–86 (1997). [DOI] [PubMed] [Google Scholar]
- Northoff H. & Berg A. Immunologic mediators as parameters of the reaction to strenuous exercise. Int. J. Sports Med. 12, (Suppl 1): S9–15 (1991). [DOI] [PubMed] [Google Scholar]
- Ostrowski K., Rohde T., Asp S., Schjerling P. & Pedersen B. K. Pro- and anti-inflammatory cytokine balance in strenuous exercise in humans. J. Physiol. 515, (Pt 1): 287–291 (1999). [DOI] [PMC free article] [PubMed] [Google Scholar]
- Helge J. W. et al. The effect of graded exercise on IL-6 release and glucose uptake in human skeletal muscle. J. Physiol. 546, 299–305 (2003). [DOI] [PMC free article] [PubMed] [Google Scholar]
- Trapnell C. et al. Differential gene and transcript expression analysis of RNA-seq experiments with TopHat and Cufflinks. Nat. Protoc. 7, 562–578 (2012). [DOI] [PMC free article] [PubMed] [Google Scholar]
- Huang da W., Sherman B. T. & Lempicki R. A. Systematic and integrative analysis of large gene lists using DAVID bioinformatics resources. Nat. Protoc. 4, 44–57 (2009). [DOI] [PubMed] [Google Scholar]
- Huang da W., Sherman B. T. & Lempicki R. A. Bioinformatics enrichment tools: paths toward the comprehensive functional analysis of large gene lists. Nucleic Acids Res. 37, 1–13 (2009). [DOI] [PMC free article] [PubMed] [Google Scholar]
- Edgar R., Domrachev M. & Lash A. E. Gene Expression Omnibus: NCBI gene expression and hybridization array data repository. Nucleic Acids Res. 30, 207–210 (2002). [DOI] [PMC free article] [PubMed] [Google Scholar]
Associated Data
This section collects any data citations, data availability statements, or supplementary materials included in this article.
Supplementary Materials
Supplementary Figures 1-11 and Supplementary Tables 1-3


