

Abstract
Despite extensive research, the relationship between age and physiological function remains poorly characterised and there are currently no reliable markers of human ageing. This is probably due to a number of confounding factors, particularly in studies of a cross-sectional nature. These include inter-subject genetic variation, as well as inter-generational differences in nutrition, healthcare and insufficient levels of physical activity as well as other environmental factors. We have studied a cohort of highly and homogeneously active older male (n = 84) and female (n = 41) cyclists aged 55–79 years who it is proposed represent a model for the study of human ageing free from the majority of confounding factors, especially inactivity. The aim of the study was to identify physiological markers of ageing by assessing the relationship between function and age across a wide range of indices. Each participant underwent a detailed physiological profiling which included measures of cardiovascular, respiratory, neuromuscular, metabolic, endocrine and cognitive functions, bone strength, and health and well-being. Significant associations between age and function were observed for many functions. The maximal rate of oxygen consumption ( showed the closest association with age (r = −0.443 to −0.664; P < 0.001), but even here the variance in age for any given level was high, precluding the clear identification of the age of any individual. The results of this cross-sectional study suggest that even when many confounding variables are removed the relationship between function and healthy ageing is complex and likely to be highly individualistic and that physical activity levels must be taken into account in ageing studies.
Key Points
The relationship between age and physiological function remains poorly defined and there are no physiological markers that can be used to reliably predict the age of an individual.
This could be due to a variety of confounding genetic and lifestyle factors, and in particular to ill-defined and low levels of physical activity.
This study assessed the relationship between age and a diverse range of physiological functions in a cohort of highly active older individuals (cyclists) aged 55–79 years in whom the effects of lifestyle factors would be ameliorated.
Significant associations between age and function were observed for many functions.
 was most closely associated with age, but even here the variance in age for any given level was high, precluding the clear identification of the age of any individual.
The data suggest that the relationship between human ageing and physiological function is highly individualistic and modified by inactivity.
Introduction
Over the past two centuries human life expectancy has more than doubled in the developed world (Oeppen & Vaupel, 2002), resulting in a dramatic increase in the number of older individuals. Advancing age is associated with declines in function which ultimately lead to a loss of independence accompanied by increased prevalence of age-associated diseases and frailty (Doherty, 2003). In many biological models of ageing, longevity is used as the primary outcome measure (Bartke et al. 2001; Tatar, 2009), but in humans this is arguably of less importance than the consequences of a deterioration in physiological function. In this regard healthy life expectancy, termed ‘the healthspan’, is not keeping pace with average life expectancy (House of Lords Science and Technology Committee, 2005), such that the years spent with poor health and disabilities in old age are increasing. Thus there is a drive to find strategies by which healthspan can be increased, optimal physiological function maintained and the trajectory towards frailty lowered (Kirkland & Peterson, 2009; Tatar, 2009). However, our understanding of the relationship between healthy ageing and physiological function is limited and no markers exist which can be used to estimate the age of an individual.
A host of factors that are intrinsic to research on human ageing, particularly in studies with a cross-sectional design, confound our interpretation of the age–function relationship. These factors include genetic variation between participants, inter-generational lifestyle, socio-economic, nutritional, healthcare and other environmental differences, as well as variations in the criteria used for the selection of participants (Metter et al. 1999; Lazarus & Harridge, 2010). In particular, a lack of adequate physical activity is known to have serious negative effects on physiological function (Blair, 2009) and in cases of enforced inactivity (e.g. bed rest and micro gravity) this initiates a so-called ‘accelerated ageing’ process (Saltin et al. 1968; McGuire et al. 2001). Because the majority of the older population fail to meet the recommended guidelines for physical activity and are largely sedentary (Blair, 2009) the tendency is to assume that inactivity is the inevitable condition for humans (Booth & Lees, 2006). However, given that our genetic inheritance stems from a period when high levels of physical activity were likely to be the norm (Booth et al. 2000), it has been argued that being physically active should be considered the default position for maintaining health and physiological function throughout the life span (Booth & Lees, 2006; Lazarus & Harridge, 2010). In this light, an age-related deterioration in function (or inferred deterioration in the case of cross-sectional studies) measured in populations of sedentary people does not reflect the biological ageing process, but should be described as being the product of the ageing process superimposed on a background of disuse.
Consequently, the experimental design for the study reported here, which aimed to investigate the relationship between age and physiological function, was mandated by the following considerations. First, having decided that exercise was the default condition for optimal physiological status, all participants had to be highly physically active. Secondly, with a longer life span and closer proximity to thresholds of functional independence, particularly as a result of a lower muscle mass (Skelton et al. 2002), the inclusion of females as well males was essential. Finally, although the indices to be measured would focus heavily on the systems critical for maintaining physical function and health in later life, particularly the cardiovascular and musculoskeletal systems, a wide range of other indices were also measured that would be indicative of good health. Therefore, a deep phenotyping of each individual was undertaken.
The aim of the study was thus to determine the relationship between age and function in non-elite male and female exercisers aged 55–79 years using a wide range of physiological indices and then to determine if any given function(s) could serve as a marker(s) of ageing as defined by its ability to predict the age of a healthy individual. The overarching hypothesis of our study was that only in the physically active would the relationship between age and physiological function be reflective of the ageing process.
Methods
Ethical approval
Prior to participation written informed consent was obtained from all subjects. All procedures were approved by the National Health Service Wandsworth Research Ethics Committee (reference number 12/LO/0457) and conformed to the Declaration of Helsinki.
Design
A cross-sectional study evaluating physiological function in 125 (84 males, 41 females; Table1) amateur non-elite cyclists aged 55–79 years was performed. The inclusion criteria for males was the ability to cycle 100 km in under 6.5 h while females had to cycle 60 km in under 5.5 h, which subjects were required to have undertaken twice in the 3 weeks prior to testing, evidence of which was obtained from official timing cards (brevet cards) or when this was not possible from training logs. In addition, subjects were classified as ‘healthy’ based on the criteria set out by Greig et al. (1994). The suitability of each subject was determined using questionnaires assessing their general health and cycling history. Exclusion criteria included smokers, those with excessive consumption of alcohol, and any known cardiovascular, musculoskeletal or neurological condition. Individuals with known hypertension or on any medications were also excluded. All testing was performed over 2 days.
Table 1.
Subject characteristics and correlations with age
| Males | Females | |||||||||||
|---|---|---|---|---|---|---|---|---|---|---|---|---|
| 55–59 | 60–64 | 65–69 | 70+ | All | Correlation | 55–59 | 60–64 | 65–69 | 70+ | All | Correlation | |
| n | 22 | 24 | 19 | 19 | 84 | 15 | 15 | 7 | 4 | 41 | ||
| Age (years) | 57.7 (1.6) | 62 (1.4) | 67 (1.2) | 73.4 (2.6) | 64.6 (6.0) | 56.4 (1.5) | 61.9 (1.6) | 67 (1.3) | 75.3 (3.0) | 62.0 (6.0) | ||
| Height (m) | 1.78 (0.04) | 1.7 (0.06) | 1.77 (0.06) | 1.76 (0.06) | 1.77 (0.06) | NS | 1.65 (0.07) | 1.66 (0.06) | 1.62 (0.06) | 1.61 (0.07) | 1.64 (0.06)* | NS |
| Mass (kg) | 77.2 (9.1) | 76.8 (8.5) | 72.6 (7.2) | 74.4 (10.1) | 75.4 (8.8) | NS | 61.5 (8.2) | 60.4 (5.5) | 57.8 (4.7) | 57.1 (6.4) | 60.0 (6.6)* | NS |
| BMI (kg m−2) | 24.5 (2.6) | 24.7 (2.6) | 23.2 (2.2) | 24.1 (2.2) | 24.2 (2.4) | NS | 22.6 (2.6) | 22.1 (2.8) | 21.9 (1.4) | 22 (1.2) | 22.2 (2.3)* | NS |
| % Fat | 20.5 (4.3) | 21.5 (3.7) | 20.1 (3.9) | 21.3 (2.8) | 20.9 (3.7) | NS | 28.3 (4.5) | 27.2 (5.8) | 30 (5) | 30.4 (2.8) | 28.4 (5.0)* | NS |
| FFM (kg) | 61.2 (6.2) | 60.1 (5.6) | 57.9 (4.9) | 58.4 (6.8) | 59.5 (6.0) | NS | 44 (5.6) | 43.8 (2.4) | 40.4 (3.5) | 39.7 (4.9) | 42.9 (4.4)* | NS |
Values are mean (SD) except correlations which are r (P-value). BMI, body mass index; FFM, fat-free mass.
Significant difference between males and females (P < 0.01). NS, not significant.
Body composition
Each participant's height and mass were determined using a stadiometer and calibrated balance beam scales, respectively. Bone mineral density (BMD) of the whole body, hip and lumbar spine was assessed by dual-energy X-ray absorptiometry (DXA) using a Hologic Discovery A scanner (Hologic, Bedford, MA, USA). Whole body fat mass, fat free mass and appendicular skeletal muscle mass index (SMI, mass height–2 (Baumgartner et al. 1998)) were also determined from DXA scans.
Physical activity levels
Subjects wore an Actigraph GT3x monitor (ActiGraph, Pensacola, FL, USA) secured over the right ankle with an elastic belt for a period of 7 days. It was not worn during sleeping, bathing/showering or swimming. Monitors record acceleration in three dimensions and provide activity counts in a composite vector magnitude of these dimensions. Data are presented in two ways: (1) mean vector magnitude counts min−1 (VM) were calculated by dividing the total daily number of counts recorded by the minutes of wear time and determining the average from all the days worn; and (2) the time spent performing different levels of activity intensity was determined. The threshold for these categories was determined from validation studies comparing accelerometer counts to intensity of activity. The cut-off points for each category are based on a modified version of those described by Sasaki et al. (2011) where vector magnitude counts min−1 of <100, 100–2689, 2690–6166, 6167–9642 and >9642 corresponded to sedentary, light, moderate, hard and very hard physical activity, respectively.
ACE and ACTN3 genotyping
DNA was isolated from peripheral blood mononuclear cells using an established sodium hydroxide isolation protocol (Truett et al. 2000). Subsequently both ACE I/D and ACTN3 R577X polymorphisms were identified by PCR using a standard thermocycler (QB-96, Quanta Biotech Ltd, West Byfleet, UK). The protocol followed for both ACE and ACTN3 was similar to that described by McCauley et al. (2009).
Endocrine and metabolic function
A blood sample (40 ml) was collected from participants (n = 120) who arrived in the fasted state, between 09.00 and 11.00 h to minimise any effect of diurnal variation. None of them reported any known infections at the time. Serum collected from vacutainers without anti-coagulant was frozen in aliquots at −80 °C for future analysis.
Serum cortisol and dehydroepiandrosterone sulphate (DHEAS) levels were measured by ELISA using a commercial kit (IBL International, Hamburg, Germany). Serum testosterone and insulin-like growth factor 1 (IGF-1) levels were measured by the Clinical Diagnostics Department of the Queen Elizabeth Hospital in Birmingham. Testosterone levels were analysed using LC-MS. All ELISAs were run in accordance with the manufacturer's guidelines. Serum levels of glucose, triglyceride, cholesterol, low-density lipoprotein (LDL) and high-density lipoprotein (HDL) were measured by the Clinical Laboratory in the Queen Elizabeth Hospital Birmingham using a Roche Modular automated system. Insulin levels were measured in the blood science laboratories of Guy's and St Thomas’ NHS trust using a chemiluminescence immunoassay and the Immulite Xpi. The glucose and insulin results were used to determine the parameters of the homeostatic model assessment (HOMA), which is widely used to assess insulin sensitivity and beta-cell function. The HOMA2 computer model was used to calculate insulin sensitivity (HOMA-%S), beta-cell function (HOMA-%B) and insulin resistance (HOMA IR) where normal values for HOMA-%S and HOMA-%B are 100% and HOMA IR is 1.0.
Resting cardiovascular and respiratory function
Upon arrival at the laboratory resting cardiovascular function was assessed using a Finometer Pro (Finapres Medical Systems, Amsterdam, Netherlands) with a finger cuff attached to the middle finger of the right arm following 15 min of quiet supine resting. Systolic (SBP) and diastolic (DBP) blood pressure, mean arterial pressure (MAP) and heart rate (HR) were recorded at 1 min intervals for 5 min and average values of each variable were calculated.
For lung function the highest peak expiratory flow (PEF), forced vital capacity (FVC), force expiratory volume in 1 s (FEV1) and FEV1:FVC were recorded using an Oxycon Pro (CareFusion, Basingstoke, UK) calibrated prior to use. Subjects were instructed to inhale rapidly to total lung capacity and then without pausing exhale as forcefully as possible until no more air could be expired. They were seated and required to maintain an upright posture during all manoeuvres, which were performed in accordance with American Thoracic Society/European Respiratory Society Guidelines (Miller et al. 2005).
Cardiopulmonary exercise testing
The responses to an incremental exercise test were determined using a continuous progressive exercise test on a cycle ergometer (Lode Coriva, Lode, Groningen, Netherlands). Breath-by-breath measurements of [O2] and [CO2] and volume of expired air were recorded continually throughout the test (Oxycon Pro; CareFusion). Subjects wore a face mask to which the volume and gas sensors were attached. The O2 and CO2 analysers were calibrated with known gases in accordance with the manufacturer's guidelines. A 3 litre syringe was used to calibrate the volume sensor before testing commenced.
Subjects initially cycled at a work rate of 50 W for 3 min after which the power output continually increased until the subject could no longer continue despite strong verbal encouragement. The rate of increase of power output (PO; 1–2 W every 3–5 s) was customized for each subject such that maximal effort would be reached within 10–12 min. The subjects cycled at constant self-selected rate typically between 75 and 80 r.p.m. HR was monitored continually using a 12 lead ECG. Maximal oxygen uptake ( was determined as the greatest O2 uptake recorded over a 20 s period at the end of the test. To ensure a valid
  was attained subjects had to meet at least two of the following criteria: (1) achievement of maximum HR greater than the age predicted maximum (220 minus age), (2) a respiratory exchange ratio >1.15 and (3) a plateau in
  indicated by an increase in
  ≤ 100 ml min−1 in the final two 20 s periods of the test (Rogers et al. 1990; Bassett & Howley, 2000; McArdle et al. 2014). Ventilatory threshold (VT) was determined using a combination of the v-slope method (the point where a clear steeper increase in
  compared to
  occurs) and the ventilatory equivalent method (the point where
  /
/ rises without a concomitant rise in
  /
/ assessed by two independent investigators with any differences between them resolved by a third if necessary (Gaskill et al. 2001).
O2 uptake kinetics
Using the same set up as for the  testing a square wave protocol was used to determine O2 uptake kinetics. This test was performed at least 45 min after the
  test (Burnley et al. 2006). It was performed twice with 3 min between each test. Subjects started cycling at 20 W for 6 min after which there was an abrupt increase in power output to that which elicited 80% of the
  recorded at VT. Subjects continued to cycle for 6 min at this intensity.
  was continually recorded throughout and subsequently analysed offline using custom written programs in Matlab (R2013a, MathWorks, Natick, MA, USA) with O2 uptake kinetics determined in a similar manner to that described by Rossiter et al. (2002) where the time constant (τ) of the response is calculated. Briefly, to remove data due to coughs, sighs or swallows,
  values lying outwith 4 SD of the local mean were removed. Breath-by-breath recordings were then linearly interpolated to 1 s intervals and aligned to the onset of exercise. Data from each trial were then averaged to give a single average response for each subject. This was further time averaged into 10 s bins to allow modelling using a non-linear least squares method. Phase II O2 uptake kinetics was modelled using a mono-exponential of the form:
where  represents the
  at any time point,
  is the baseline recorded 1 min prior to the increase in power output,
  is the steady state increase in
  above the baseline, τ is the time constant of the response and TD is the time delay, which was allowed to vary freely. The beginning of the model began after the cardiodynamic phase (phase I) which was deemed to be 25 s after the increase in power output as this has been shown to provide constant O2 uptake parameters in young and old individuals (Murias et al. 2011).
Neuromuscular function
Peripheral nerve conduction velocity (NCV)
With each participant sitting upright on a plinth with their legs straight supramaximal (direct current, square pulses of 0.1 ms duration) stimuli were delivered from a stimulator (Digitimer Stimulator DS7, Digitimer Ltd) to the peroneal nerve via a stimulating bar electrode (two 20 × 7 mm electrodes separated by 30 mm) placed proximally over the fibular head and distally over the anterior ankle, the position of which was marked. Surface electromyography (EMG) was recorded from the extensor digitorum brevis muscle using disposable electrodes (Ambu Blue Sensor Electrode, Ambu Ltd, St Ives, UK) with the reference electrode placed on the lateral portion of the calcaneus. EMG signals were pre-amplified (×100; NL-844 Pre-Amplifier, Digitimer Ltd), analog-to-digital converted and recorded in Spike 2 software (2000 Hz; CED 1401, Cambridge Electron Design, Cambridge, UK). The distance from each stimulation point to the recording electrodes was measured with a flexible tape. A peak in the muscle action potential was identified and the time from stimulation to the peak was measured for both stimulation points. NCV was measured based on the difference in time from stimulation to the peak and the distance between stimulation points. All measurements were made with a skin temperature of 30–34 °C determined by placing a thermocouple on the anterior shank.
H-reflex
The Hmax/Mmax ratio, used to assess the monosynaptic reflex pathway, was determined from surface EMG of the soleus muscle. Recording electrodes (Ambu Blue Sensor Electrode, Ambu Ltd) were placed two-thirds of the way along a line from the medial condyle of the femur to the medial malleolus. The reference electrode was placed over the lateral aspect of the knee. The tibial nerve was stimulated (Digitimer Stimulator DS7, Digitimer Ltd) with a voltage and pulse width of 400 V and 1 ms, respectively. The cathode (1.5 cm diameter) was placed over the nerve in the popliteal fossa while the anode (7 cm diameter) was positioned over the patella. EMG was sampled at a frequency of 2 kHz through an analog-to-digital convertor (CED 1401) and displayed on a PC. The signal was recorded with a gain of 100×. Subjects sat upright in a comfortable chair with arm rests in a quiet room. Their feet were supported in ∼10 deg of plantar flexion with the knee in 60 deg of flexion. They were instructed to remain still during testing and to refrain from moving their head and talking. The stimulus intensity was initially set 2 mA below the intensity required to elicit an H-reflex. The intensity was increased by 1 mA every 10 s until a plateau in the amplitude of the M-wave occurred. The maximum peak to peak amplitude of the H-reflex and M-wave was used to calculate Hmax/Mmax.
Muscle strength and voluntary activation
Maximal voluntary contraction (MVC) and voluntary activation (VA) of the knee extensors were assessed in the dominant limb. Subjects were seated upright with their arms folded in a custom-built dynamometer with their knee in 90 deg of flexion. Their lower leg (∼3 cm proximal to the ankle) was strapped in a padded steel brace attached by a rigid bar to a strain gauge. Signals from the strain gauge were recorded on Spike 2 software via an analog-to-digital converter (CED 1401) at a sampling rate of 2 kHz. Percutaneous stimulating electrodes (8 × 12 cm) were strapped around the distal and proximal segments of the quadriceps and attached to a constant current stimulator delivering square wave stimulation (pulse width 0.2 ms at up to 400 V; Digitimer Stimulator DS7, Digitimer Ltd). Waist and shoulder straps were used to minimise any hip or upper body movement. The distance from the centre of rotation of the knee joint to the steel brace was measured to allow torque to be calculated. The testing procedure began with determination of the maximal twitch response. Current was increased in a stepwise manner until no further increase in torque was observed. After a brief rest six MVC tests were performed in which subjects were asked to generate maximal force as quickly as possible and hold the contraction for 3–4 s. Strong verbal encouragement and visual feedback from the force trace was given. At least 1 min of rest elapsed between contractions. During three of the MVC tests a maximal electrical impulse was delivered to the muscle. The ratio of the amplitude of the twitch superimposed on the MVC to the resting twitch was used to assess levels of VA in accordance with the twitch interpolation technique. The greatest MVC and level of VA was used for analysis.
Maximum voluntary grip strength was assessed in the dominant hand using a hand grip dynamometer (MKIII, Queens Medical Centre, Nottingham, UK). Subjects were asked to keep their arms by their side. Verbal encouragement and visual feedback were given. Six maximal contractions were performed, the greatest of which was used for analysis.
Peak explosive cycling power
The peak explosive power (PP) recorded during a 5 s sprint on a custom built inertial testing stationary cycle (Pearson et al. 2004) was determined. Testing consisted of three maximal sprints, separated by ≥1 min, starting from the stationary position where the crank position of the dominant leg was vertical at the top of the pedal stroke. Prior to testing subjects completed a 5 min warm-up (50 W, self-selected pace cycling). Calculation of PP was performed similarly to that as detailed by Pearson et al. (2004). The inertial load of the system was set at 0.325 kg m2. Signals were sampled through an analog-to-digital converter and saved on Spike 2 software (CED 1401). PP was subsequently calculated offline using Matlab (R2013a, The Mathworks). After passing the rotary encoder signal through a fourth order low-pass Butterworth filter (cut-off frequency 8 Hz) the signal was double differentiated to give the angular acceleration of the flywheel. This was multiplied by the moment of inertia of the system to determine torque. By multiplying the torque recorded with the angular velocity (first differential of encoder signal) power output was calculated. Peak power obtained throughout the trial was determined and used for analysis.
Balance
Balance was assessed by asking the subjects to stand on one leg for a period ≤10 s; three attempts were performed with eyes open (EO) and 3 with eyes closed (EC). They were allowed to practise the manoeuvre and also to determine the preferred leg. Subjects stood on a custom built balance platform which recorded sway. Each trial was performed barefoot with arms folded. The experimenter gave an auditory cue when the subject was to start standing on one leg. During the EC trial subjects closed their eyes before moving on to one foot. For the EO trial the root mean square (rms) sway distance in the anterior–posterior (AP) and medial–lateral (ML) directions was determined. The majority of individuals were unable to stand on one leg for 10 s with EC so the length of time spent on one leg was used for analysis.
Timed up and go
Functional mobility was assessed using the timed up and go test (TUG; Podsiadlo & Richardson, 1991). The time taken to stand from a chair, walk 3 m, turn, walk back and sit down was measured. A standard height chair of 0.475 m without arms was used. Subjects began the test leaning against the back rest of the chair. They were instructed to perform the test ‘walking as quickly and safely as possible’ without using their arms to stand up. The quickest attempt of three trials was analysed.
Cognitive function and health and well-being
Cognition was assessed by a test of verbal fluency (animal naming) and of speed and concentration (timed letter search). The former requires the subjects to name as many animals as possible in a 1 min period. It is the most commonly used test of verbal fluency with scores <14 suggesting impaired cognition (Sager et al. 2006). The timed letter search (Richards et al. 1999) involves the subject being given an A4 sheet of paper with 65 letters on it and being given 1 min to cross out as many P and W letters as possible. At 1 min the subject is asked to place a line under the last letter scanned. Processing speed is determined by the total number of letters scanned and efficiency by the percentage of target letters identified.
In addition the following questionnaires were given to the participants: (1) the SF12v2 (Quality Metric, Lincoln, RI, USA) health survey to assess health and well-being, (2) the Hospital Anxiety and Depression Scale (HADS; Zigmond & Snaith, 1983) to determine anxiety and depression, (3) the Pittsburgh Sleep Quality Index (PSQI; Buysse et al. 1989) to assess sleep quality and (4) the EPIC-Norfolk Food Frequency Questionnaire (Bingham et al. 1994) to estimate daily nutritional intake, which was analysed using FETA software (http://www.srl.cam.ac.uk/epic/).
Statistical analysis
All statistical analysis was performed using IBM SPSS Statistics v 21 (Chicago, IL, USA). Normality was assessed using the Kolmogorov–Smirnov test. For normally distributed data sex differences were determined using independent sample t-tests while relationships with age were assessed with Pearson's correlation coefficient. If data were not normally distributed, Mann–Whitney U tests and Kendall's tau correlation were performed. For variables with a ceiling-effect (VA and EC balance time) the Tobit model was used to examine a relationship with age. Alpha was set at 0.05.
The crucial point for any of the indices measured to be considered suitable for use as a predictor of age is that the variance about the regression line is small compared to the age range considered. We thus set an r2 value of 0.8 as being required for any of the measured indices to be considered to be acceptable as a reliable predictor of age. This is roughly equivalent to a standard deviation of each age estimate being 10% of the range of ages. We determined the coefficient of determination (r2 value) for many variables to see whether they reached this critical value. The precision of this determination depends on sample size. Often one would have the null hypothesis that r2 = 0, in which case the sample size needed to reject this hypothesis increases as r2 falls. However, here we have the null hypothesis that r2 > 0.8 so the number of participants required to reject this hypothesis falls as r2 falls. Post-hoc analyses on all measures were performed using G*power (Faul et al. 2009), which takes into account the r2 value obtained for our sample, and the number of participants (n = 84 for males and n = 41 for females) to determine if the study was appropriately powered (1 – β > 0.8) to reject our null hypothesis.
In addition to traditional scatter plots of age vs. function, the range of ages accommodated by a functional level is also displayed in terms of functional equivalence (Lazarus & Harridge, 2010). This involves stratifying each value obtained into bandwidths of equivalent function and plotting each bandwidth against age with the size of each bandwidth being determined using the Freedman–Diaconsis rule:
where IQR is the interquartile range of the variable measured (x) and n is the number of observations.
Results
Subject characteristics
Age showed no association with height, mass, body mass index, percentage body fat or fat-free mass (Table1). Similarly, no age-related declines in activity levels, as determined from actigraphy, were observed. The monthly cycle distance reported tended to be lower for females than for males, but remained unchanged across the age range in both sexes (Table2).
Table 2.
Subject activity levels and correlations with age
| Male | Female | |||||||||||
|---|---|---|---|---|---|---|---|---|---|---|---|---|
| 55–59 | 60–64 | 65–69 | 70+ | All | Correlation | 55–59 | 60–64 | 65–69 | 70+ | All | Correlation | |
| Years cycling | 22.4 (17.5) | 27.6 (17.5) | 26.5 (19.6) | 36.7 (19.5) | 28.1 (18.9) | .174 (0.03) | 15.6 (10.5) | 24.6 (20.3) | 16 (9.3) | 45 (19.6) | 21.8 (17.3) | 0.423 (0.007) |
| Monthly distance (km) | 764 (355) | 635 (318) | 803 (350) | 731 (334) | 728 (339) | NS | 628 (235) | 611 (278) | 482 (242) | 622 (336) | 596 (258) | NS |
| Time spent performing activities classified as: | ||||||||||||
| Light (min day−1) | 203 (44) | 213 (46) | 236 (69) | 221 (55) | 218 (54) | NS | 224 (46) | 232 (49) | 261 (36) | 237 (25) | 234 (45) | NS |
| Moderate (min day−1) | 68 (21) | 75 (15) | 71 (25) | 67 (18) | 70 (20) | NS | 74 (18) | 73 (13) | 77 (19) | 74 (16) | 74 (16) | NS |
| Hard (min day−1) | 27 (12) | 28 (9) | 26 (13) | 26 (8) | 27 (11) | NS | 33 (12) | 31 (9) | 28 (9) | 26 (10) | 31 (10) | NS |
| Very hard (min day−1) | 71 (38) | 85 (42) | 96 (55) | 79 (40) | 82 (44) | NS | 100 (39) | 91 (34) | 71 (39) | 120 (76) | 94 (42) | NS |
| VM (counts min−1) | 1947 (853) | 2260 (782) | 2563 (1165) | 2074 (1001) | 2204 (963) | NS | 1998 (964) | 1911 (597) | 1631 (772) | 2024 (1525) | 2410 (3566) | NS |
Values are mean (SD) except correlations which are r (P-value). VM, vector magnitude.
Significant difference between males and females (P < 0.01). NS, not significant.
ACE and ACTN3 gene polymorphism identification was performed in 113 subjects. ACE I/D and ACTN3 577R/X genotype distribution were both found to be in Hardy–Weinberg equilibrium (ACE: II = 22 (19.5%), ID = 58 (51.3%), DD = 33 (29.2%), P > 0.05; ACTN3: XX = 25 (22.1%), RX = 56 (49.6%), RR = 32 (28.3%), P > 0.05).
Cardiopulmonary exercise testing
When  (Fig. 1A–C) was expressed in absolute terms and relative to total mass, males had superior values (P < 0.001 in both cases), but when expressed relative to fat-free mass no sex differences were apparent. For both sexes all measures of
  showed a linear decline with age (r = −0.443 to −0.664; P < 0.001) as did maximal HR (r = −0.360 and −0.337, P < 0.05 for males and females, respectively). Figure 1E–H shows the
  data plotted in terms of bandwidths of functional equivalence. It is clear that outwith of the extremes of
  an extensive age range is incorporated into each bandwidth.
Figure 1.
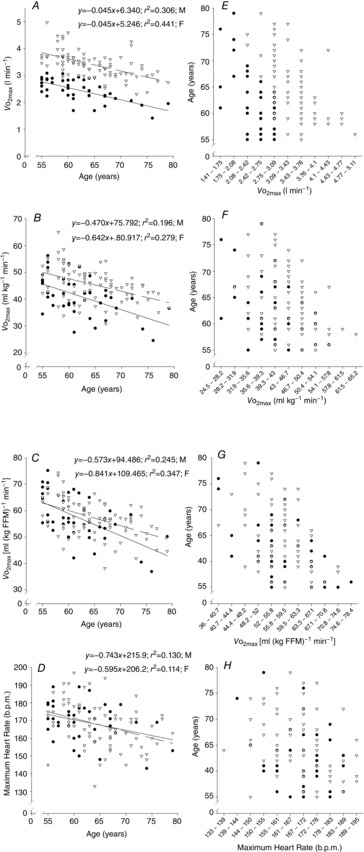
Maximal aerobic capacity relationships with age
The relationship of age with maximal aerobic capacity (in absolute terms, A; relative to body weight, B; and fat free mass (FFM)) and maximum heart rate (D). Data are displayed on scatterplots (A–D) and graphs of functional equivalence (E–H). Data are from females (• and continuous line) and males (∇ and dashed line).
VT, expressed in absolute terms and relative to both total body and fat-free mass, declined with age at a similar rate in both sexes (r = −.318 to −0.625, P < 0.001). Whilst the % at which the VT occurred (Fig. 2A–D) increased with age in females (r = 0.381, P = 0.014), there was only a tendency for this in males (P = 0.09). Oxygen uptake kinetics were similar across the age range in both sexes (Fig. 2E).
Figure 2.
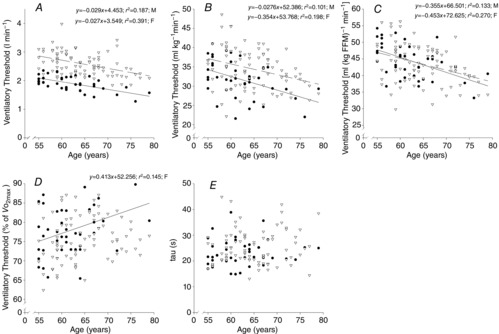
Ventialtory threshold and O2 uptake kinetics relationship with age
Ventilatory threshold (A–D) and O2 uptake kinetics (E) with age. Data are from females (• and continuous line) and males (∇ and dashed line).
Skeletal muscle mass index and bone mineral density
From the DXA analysis, the appendicular SMI, a common method used to assess sarcopenia, was calculated. No association between SMI and age was found in males or females (Fig. 3A).
Figure 3.
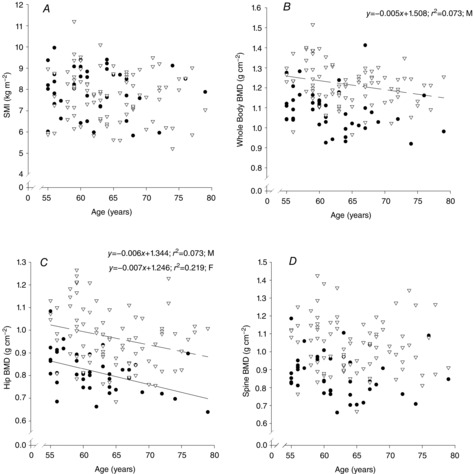
Relationship of skeletal muscle mass index and bone strength with age
Relationship between skeletal muscle mass index (SMI, A), whole body (B), hip (C) and lumbar spine (D) bone mineral density (BMD) with age. Data are from females (• and continuous line) and males (∇ and dashed line).
BMD of the whole body, hip and lumbar spine was greater in males (P < 0.001 in all cases, Fig. 3B–D). Whole body BMD declined with age in men only (r = −0.270, P = 0.013) while hip BMD declined with age in both males (r = −0.270, P = 0.013) and females (r = −0.468, P = 0.002). There was no association with age with regard to lumbar spine BMD. t- and Z-scores for each body segment revealed that this population was not different from the general population.
Endocrine and metabolic function
There was no effect of age on DHEAS, cortisol or total testosterone levels (P > 0.05 in all cases; Fig. 4A–C), but IGF-1 was associated with age in both males and females (r = −0.307 and −0.416 in males and females, respectively, P < 0.01, Fig. 4D). In terms of metabolic health, glucose, insulin, HOMA-%S, HOMA-%B, HOMA IR, cholesterol, HDL, LDL and triglyceride levels fell within normal healthy clinical ranges and were not associated with age in males or females (P > 0.05 in all cases; Table3).
Figure 4.
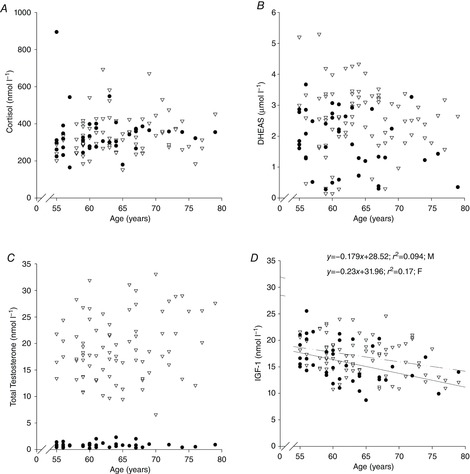
Relationship between age and hormone levels
Relationship between age and cortisol, DHEAS, testosterone and IGF-1 levels. Data are from females (•) and males (∇).
Table 3.
Metabolic function and correlation with age
| Male | Female | |||||||||||
|---|---|---|---|---|---|---|---|---|---|---|---|---|
| 55–59 | 60–64 | 65–69 | 70+ | All | Correlation | 55–59 | 60–64 | 65–69 | 70+ | All | Correlation | |
| Glucose (mmol l–1) | 5.5 (0.5) | 5.5 (0.4) | 5.6 (0.5) | 5.5 (0.4) | 5.5 (0.4) | NS | 5.5 (0.6) | 5.2 (0.5) | 5.3 (0.4) | 5.4 (0.3) | 5.4 (0.5) | NS |
| Insulin (pmol l–1) | 51.8 (36.1) | 42.1 (27.6) | 33.2 (11.2) | 38.7 (12.1) | 41.8 (25.5) | NS | 33.0 (13.7) | 36.2 (20.0) | 40.0 (29.0) | 22.3 (6.7) | 34.6 (19.0) | NS |
| HOMA-%B | 74.9 (38.3) | 64.8 (26.9) | 55.4 (11.5) | 62.2 (12.1) | 64.7 (26.1) | NS | 56.0 (16.5) | 63.8 (18.8) | 63.8 (28.3) | 47.4 (13.2) | 59.4 (19.6) | NS |
| HOMA-%S | 151.5 (103.2) | 185 (125.9) | 174.3 (61.5) | 147.5 (50.4) | 165.7 (93.5) | NS | 197.0 (109.2) | 184.4 (87.1) | 208.5 (150.5) | 245.9 (60.7) | 198.7 (105.5) | NS |
| HOMA IR | 0.97 (0.67) | 0.80 (0.52) | 0.64 (0.23) | 0.75 (0.23) | 0.80 (0.46) | NS | 0.63 (0.27) | 0.68 (0.29) | 0.77 (0.56) | 0.43 (0.15) | 0.66 (0.37) | NS |
| Cholesterol (mmol l–1) | 5.4 (1.0) | 5.4 (1.0) | 5.7 (1.0) | 5.3 (0.8) | 5.5 (0.9) | NS | 6.6 (0.9) | 6.0 (1.2) | 6.7 (0.6) | 6.4 (1.1) | 6.4 (1.0)* | NS |
| HDL (mmol l–1) | 2.0 (0.5) | 1.8 (0.6) | 2.0 (0.4) | 2.0 (0.5) | 1.9 (0.5) | NS | 2.2 (0.5) | 2.3 (0.7) | 2.3 (0.4) | 2.3 (0.8) | 2.3 (0.6)* | NS |
| LDL (mmol l–1) | 3.0 (1) | 3.2 (1.0) | 3.2 (1.0) | 3.0 (0.9) | 3.1 (1.0) | NS | 3.9 (1.1) | 3.4 (1.0) | 3.9 (0.5) | 3.8 (0.6) | 3.7 (1.0)* | NS |
| Triglyceride (mmol l–1) | 0.9 (0.4) | 1.1 (0.4) | 1.0 (0.3) | 0.9 (0.3) | 1.0 (0.4) | NS | 1.0 (0.4) | 0.9 (0.3) | 1.1 (0.3) | 1.0 (0.3) | 1.0 (0.3) | NS |
Values are mean (SD). HDL, high density lipoprotein; LDL, low density lipoprotein.
Significant difference between males and females (P < 0.01). NS, not significant.
Resting cardiovascular and respiratory function
SBP increased with age in males only (r = 0.305, P = 0.005) while there were no age-related changes in DBP or MAP in males or females (Fig. 5A–C). PEF, FEV1 and FVC all declined with age in females (r = −0.251, −0.574 and −0.458, respectively; P < 0.05) while only FEV1 decreased in males (r = −0.362, P < 0.001, Fig. 5D–G).
Figure 5.
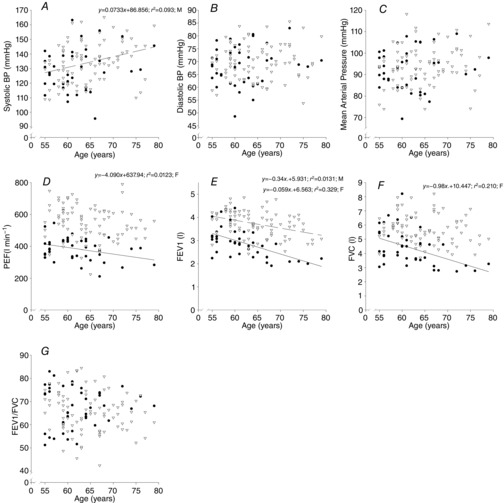
Relationship between cardiovascular function and age
Relationship between cardiovascular (A–C) and lung (D–G) function with age. BP; blood pressure; PEF, peak expiratory flow rate; FEV1, forced expiratory volume in 1 s; FVC, forced vital capacity. Data are from females (• and continuous line) and males (∇ and dashed line).
Neuromuscular function
Data for neuromuscular function are shown in Fig. 6. In males there was an inverse relationship in knee extensor MVC (r = −0.237, P = 0.002), PP (τ = −0.301, P < 0.001) and grip strength (r = −0.362, P < 0.001) with age while in women there was a tendency for this in grip strength (r = −0.362, P < 0.001) with age while in women there was a tendency for this in grip strength only (P = 0.055). VA declined with age in males only (t = −2.016, P = 0.044) with no association between age and NCV or Hmax:Mmax found.
Figure 6.
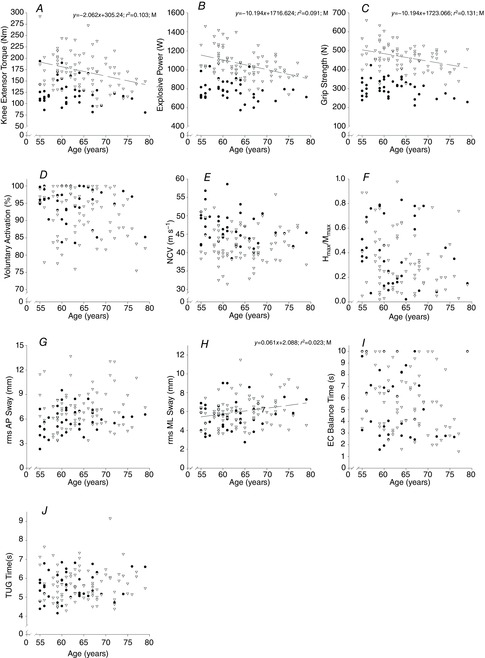
Neuromuscular function associations with age
Relationship between age and neuromuscular function. NCV, nerve conduction velocity; rms, root mean square; AP, anterior–posterior; ML, medio-lateral; EC, eyes closed; TUG, timed up and go. Data are from females (• and continuous line) and males (∇ and dashed line).
There was an increase in ML sway and EC balance time with age in males only (τ = 0.151, P = 0.048 and t = −3.068, P = 0.002, respectively). No changes in AP sway or TUG were observed with age.
Cognitive function and health and well-being
Efficiency of information processing declined with age in both sexes (τ = −0.255, P = 0.023 and τ = −0.158, P = 0.039 for females and males, respectively). There was no effect of age on speed of information processing or animal naming (Table4).
Table 4.
Cognitive function and correlation with age
| Male | Female | |||||||||||
|---|---|---|---|---|---|---|---|---|---|---|---|---|
| 55–59 | 60–64 | 65–69 | 70+ | All | Correlation | 55–59 | 60–64 | 65–69 | 70+ | All | Correlation | |
| Efficiency (% correctly identified) | 82.1 (8.6) | 79.4 (10.1) | 74.9 (10.7) | 76.4 (12.9) | 78.4 (10.7) | –0.158 (0.039) | 84.2 (9.9) | 81.5 (11.4) | 76.9 (17.5) | 67 (13.3) | 80.3 (12.8) | –0.255 (0.023) |
| Speed (no. of letters scanned) | 360 (60.3) | 348.7 (85.2) | 332.9 (56.1) | 338.1 (73.6) | 345.7 (70) | NS | 382.5 (99.3) | 368.2 (84) | 393.6 (57.5) | 351 (86.1) | 376.1 (84.4)* | NS |
| No. of animals | 28.1 (10.1) | 26 (6) | 22.5 (7.4) | 23.8 (5.6) | 25.3 (7.7) | NS | 27.3 (6.1) | 27.5 (6.3) | 24.3 (6.8) | 23 (2.4) | 26.4 (6.1) | NS |
Values are mean (SD) except correlations which are r (P-value).
Significant difference between males and females (P < 0.05). NS, not significant.
Sleep quality improved with age in males only (τ = −0.179, P = 0.026). In contrast, self-reported physical health declined with age in females (τ = −0.257, P = 0.023) but not males (Table5). The remaining health and well-being measures showed no age-related change (P > 0.05 in all cases; Table5). The results of the nutritional questionnaire are given in supplementary Table S1.
Table 5.
Health and well-being and correlation with age
| Male | Female | |||||||||||
|---|---|---|---|---|---|---|---|---|---|---|---|---|
| 55–59 | 60-64 | 65-69 | 70+ | All | Correlation | 55–59 | 60-64 | 65-69 | 70+ | All | Correlation | |
| PSQI score | 4.7 (2.3) | 3.9 (2.4) | 5.4 (3) | 2.8 (1.4) | 4.2 (2.5) | –0.179 (0.026) | 4.4 (2.7) | 4.9 (3.9) | 3.4 (1.9) | 4 (3.6) | 4.4 (3.1) | NS |
| SF12 physical summary | 56.5 (3.9) | 55.6 (5) | 56.6 (3.6) | 55.6 (3.4) | 56 (4.1) | NS | 58.9 (2.3) | 57.1 (4.7) | 57.1 (0.9) | 53.5 (4.9) | 57.4 (3.7)* | –0.257 (0.023) |
| SF12 mental summary | 53.5 (9.1) | 55.3 (5.1) | 53.1 (3.7) | 56.1 (4.5) | 54.5 (6.1) | NS | 51.5 (8.3) | 53.3 (3.9) | 54.7 (3.5) | 55.5 (1.9) | 53.1 (5.8) | NS |
| Anxiety score | 4.7 (2.8) | 3.4 (2.2) | 4.6 (2.7) | 3.3 (2.5) | 4 (2.6) | NS | 5.4 (2.4) | 5.7 (2.2) | 5.3 (2.3) | 2.3 (2.6) | 5.2 (2.4)* | NS |
| Depression score | 1.8 (1.7) | 1.6 (1.3) | 1.4 (1) | 1.8 (1.5) | 1.7 (1.4) | NS | 1.5 (1.5) | 1 (1.6) | 1.7 (0.8) | 1.5 (1.3) | 1.3 (1.4) | NS |
Values are mean (SD) except correlations which are r (P-value). PSI, Pittsburgh Sleep Quality Index.
Significant difference between males and females (P < 0.05). NS, not significant.
Relationship between training volume and physiological indices
Whilst no association between age and self-reported training volume was observed, training volume was shown to relate weakly to  in both men (r = 0.182, P < 0.02) and women (r = 0.332, P < 0.05), but more strongly to tau (men: r = −0.271, P < 0.001; women: men, r = −0.405, P < 0.01). In males training volume was also associated with the health indices %body fat (r = −0.177, P < 0.03) and HDL concentration (r = 0.247, P < 0.001), but not in females.
Use of physiological indices as biomarkers
Whilst an association between age and function was shown for many indices, the use of a function as a meaningful predictor of age requires a close association. For this we set a critical coefficient of determination value (r2 > 0.8). Even our strongest correlate ( , l min−1 for women), which gave an r2 value of 0.441, was still well below this acceptable value. Post hoc power analysis was undertaken on this and all other variables to determine if the study was sufficiently powered to be able to reject this critical value, based on the r2 observed and the number of participants. For the absolute
  for both females (n = 41) and males (n = 84, r2 = 0.306) the power to reject the hypothesis was shown to be sufficient (1 – β = 0.992 and 0.999, respectively, i.e. >0.8). Indeed, for all indices which had lower r2 values the power to reject the hypothesis was found to be even greater.
Discussion
Whilst it is often assumed that there are linear decrements in function with increasing age, the relationship between age and physiological function in humans is complex. Interpretation of this relationship is influenced by numerous confounding factors, particularly in cross-sectional studies. These include genetic variation and a number of lifestyle factors, of which sedentary behaviour is arguably the most critical (Blair, 2009). The crucial intersection between inactivity and biomarkers of ageing can also be demonstrated on the two most common molecular indices that have been suggested as being biomarkers of ageing. Indeed, both telomere length and methylation of DNA are sensitive to the effects of exercise (LaRocca et al. 2010; Rönn et al. 2013).
Thus, to try to define more appropriately the relationship between age and physiological function, we have attempted to ameliorate all, except genetic differences, by studying a highly and homogeneously active cohort of healthy older men and women. Furthermore, in contrast to many studies of ageing that focus on a single or limited number of systems, and to increase the probability of finding physiological markers that might predict age, a wide range of measurements encompassing cardio-respiratory, neuromuscular, metabolic, hormonal, cognitive, and health and well-being indices was undertaken. The data revealed a number of significant associations between age and function, although none reached the criteria for being able to predict reliably the age of a given healthy individual, as it was clear that for a given bandwidth of any function a wide age range was accommodated.
Cyclists as a model to study human ageing
To obtain a cohort of healthy active individuals who undertook vigorous and similar types of exercise, we recruited amateur, non-competitive road cyclists. Cyclists were chosen because their activity does not give excess joint loading, requires a high degree of motor control, produces high muscle forces as well as providing significant challenges to the cardiovascular and respiratory systems. The participants were predominantly recruited from the cycling organisation Audax UK, which comprises cyclists of all ages and abilities and stages events of set distances with defined upper and lower limits of cycling speeds (∼30 and ∼15 km h−1). A number of indices support our contention that these were not elite athletes, which whilst of interest (Rogers et al. 1990; Tanaka & Seals, 2008) represent population outliers. For example,  was generally lower (Faulkner et al. 2008) and body fat content higher than previously reported for elite athletes of comparable ages. Furthermore, whilst acknowledging the small scale of the present study in genetic terms, the distribution of the two most commonly studied ‘performance’ genotypes (ACE and ACTN3) were similar to that of the general population (Myerson et al. 1999; Yang et al. 2003) and not skewed to an endurance-based phenotype (Ma et al. 2013).
In the absence of clear evidence defining the amount of exercise necessary to combat the negative effects of inactivity, we pragmatically set standards for acceptance into the study. For men this was the ability to cycle 100 km in 6.5 h while for women the standard was set at the ability to regularly cycle 60 km in 5.5 h. The difference between sexes was necessary because of the paucity of women cyclists aged >55 years who regularly cycle 100 km. We specifically selected an age range that would: (1) represent those passing through late working life to early years of retirement, (2) straddle the ‘breakpoint’ in performance identified from the study of athletic world records (Tanaka & Seals, 2008) and (3) ensure that any observed associations between age and function would not be driven by simply having high performing young individuals at one extreme and poorly performing very elderly individuals at the other (Lazarus & Harridge, 2010). Table2 shows that although the distance the women cycled tended to be less, it was constant across the age range for both sexes, suggesting that there was no confounding training load effect. In addition, the time spent performing light, moderate, hard and very hard activities was similar between sexes and was also constant across the age range.
The use of physiological markers to predict the age of an individual
Having established the rationale for the study cohort, it was then important to select the criteria upon which to base an investigation of the relationship between age and physiological function.  was used here because it is viewed as the gold standard of physical fitness (McArdle et al. 2014), is a high predictor of all cause mortality (Blair et al. 1989) and is a highly integrative function requiring the effective interaction of a number of key systems. The results revealed significant negative associations with age and
  (Fig. 1A–C) inferring a loss of ∼10 and 15% per decade in males and females (in ml kg−1 min−1), respectively. This is in agreement with the 8–15% reported in previous cross-sectional studies of older athletic individuals (Tanaka et al. 1997; Wilson & Tanaka, 2000; Wiswell et al. 2001; Kusy & Zieliński, 2014). Indeed, the closet association between age and any of the indices measured in our study was observed for
  However, despite there being statistical associations between age and
  even this marker could not identify with any degree of accuracy the age of any given individual, which would be the requirement for any useful biomarker of ageing. A statistical association with age may be indicated by a significant P value (i.e. P < 0.05), which can be achieved with a small correlation coefficient offset by a large sample size or vice versa. However, an aim of our study was also to test whether a given physiological index could be considered as a marker of ageing and thus have predictive utility. For this we set a critical value for a correlation equivalent to five times that which would result from a random assignment of ages (r2 > 0.80). Post hoc analysis revealed that for all indices we were suitably powered both for the male and for the female cohorts. The phenomenon whereby a given function is significantly associated with age but has lower predictive power is highlighted graphically when the data are plotted in bandwidths of equivalent function (Fig. 1A–D). Here it can be seen that even when normalised to lean body mass (Fig.1C) a bandwidth of 52–56 ml (kg fat-free mass)−1 min−1 encompasses participants who span over 20 years for males (56–77 years) while females span the age range of 55–69 years. Indeed all indices measured failed to reach the power required to be used as a predictive marker of age.
Whilst a good marker of overall health,  is also sensitive to training load (in the present study it correlated weakly with self-reported training volume), is influenced by genetic factors (Bouchard & Rankinen, 2001), and shows a trainability–genetic interaction (Ghosh et al. 2013). Nonetheless, it is surprising that within this particular cohort of individuals, where many of the other confounding factors of ageing studies have been removed, individuals of the same age could differ so markedly in function.
These observations emphasise the complexity of identifying a physiological biomarker that can be used to predict the age of a healthy individual, even when a homogeneously active, healthy cohort is studied. The limitations of cross-sectional studies on ageing are well known (Metter et al. 1999) and the data from the present study serve to emphasise the need for prospective, longitudinal studies to investigate the relationship between ageing and physiological function on an individual basis.
Alternative biomarkers of ageing
In addition to physiological markers measured in the current study, a number of other markers have been suggested from which the age of an individual may be predicted; in particular, two such markers which showed promise were telomere length and DNA methylation, with the latter showing very high correlation and accuracy in a number of tissues (Horvath, 2013). However, the utility of these markers must be viewed with caution because they are both sensitive to the exercise status of the subjects, and it is now known that telomere length is preserved in healthy older adults who perform vigorous exercise and is positively related to maximal aerobic exercise capacity (LaRocca et al. 2010). Whilst 6 months of exercise altered DNA methylation status in over 7500 individual genes, only 18 candidate genes for obesity and 21 for type 2 diabetes had CpG sites with differences in adipose tissue DNA methylation in response to exercise (LaRocca et al. 2010). The authors conclude that exercise induces genome-wide changes in DNA methylation in human adipose tissue, potentially affecting adipocyte metabolism. These studies highlight further the difficulty in identifying robust markers of ageing even when sensitive molecular and genetic techniques are used.
Relationship between global physiological function and age
It is not possible within the constraints of this paper to discuss in detail each of the many indices measured in the present study. However, there are a number of noteworthy observations in regard to associations with age, the generally superior levels of function observed compared to sedentary and frail populations of the same age as well as the clinical relevance and interpretation of some of the measures reported in these healthy, high functioning individuals.
Cardiopulmonary exercise testing
The data for  have been discussed above, so we will consider the other indices obtained from the incremental exercise test. As expected, maximum HR was negatively associated with age, but interestingly the values were on average higher than predicted from the traditionally used estimates, such as 220 – age or 208 − 0.7*age (Tanaka et al. 2001). A decrease in VT with age has also previously been reported in the general population, although values in the current study were ∼15 ml kg−1 min−1 greater while the %
 at which this occurred is 5–10% lower (Paterson et al. 1999). There has been recent interest in using VT to assess the suitability for elective surgery. For example, a value of 10 ml kg−1 min−1 predicts those at risk of postoperative complications and increased length of hospital stay (Snowden et al. 2010). Extrapolating the data in the current study shows that even by 100 years of age the cyclists studied would be predicted to be comfortably above this value (24.8 and 19.2 ml kg−1 min−1 for males and females, respectively).
Another marker of cardiorespiratory fitness is the rate of O2 uptake (O2 kinetics, τ) during a bout of submaximal exercise at a fixed power output (Rossiter et al. 1999). This has been reported to be slower in older non-active subjects than in young individuals (DeLorey et al. 2004) while a slowing in τ of ∼16 s has been reported over a decade in older individuals with low activity levels (Bell et al. 1999). Our data from highly active individuals do not show any association with age in this parameter over the age range studied. The contention that previously observed age-related changes are mediated by inactivity is supported by the report of non-exercising 70-year-old males undertaking a 24-week aerobic training programme improving O2 uptake kinetics (τ = 62.2 s before vs. 31.9 s after; Babcock et al. 1994) to levels approaching those of the current study (25.2 s) and similar to those reported in young individuals (25–30 s; DeLorey et al. 2004; Murias et al. 2011). Like  , both VT and τ are sensitive to training volume (Jones & Carter, 2000). In this study we found no association with VT and training load, but τ was associated with training load in both men and women.
SMI and BMD
Skeletal muscle is sensitive to both mechanical and metabolic signals and, perhaps more than any other tissue, to physical inactivity. This suggests that the well-documented declines in neuromuscular performance with age (Skelton et al. 1994; Lindle et al. 1997; Klass et al. 2008) would be highly influenced by sedentary behaviour. Other things being equal, muscle function is related to size (O'Brien et al. 2010). An age-related loss of muscle mass is termed ‘sarcopenia’, although the precise definition of this clinical condition has been the subject of debate (Cruz-Jentoft et al. 2010). One commonly used definition is the ‘skeletal muscle index’ derived from a DXA scan (Baumgartner et al. 1998). Although seven subjects were classified as sarcopenic (one female and six males, SMI <5.5 and 7.26 kg m−2, respectively) there was no association between age and SMI (Fig. 2A). Thus, whilst sarcopenia in a sedentary older population is associated with frailty and increased risk of falling, in this healthy population the fact that these seven sarcopenic individuals were capable of meeting the challenging exercise criteria for entry into the study does not imply frailty, or indeed impaired function, but rather appears to be related to a thin, athletic phenotype.
Overall, the physiological data obtained in the present study show that this cohort comprises healthy individuals with elevated levels of function associated with their high levels of physical activity. However, one area in which the cyclists could not be distinguished from the general population was in regard to bone. Age effects for BMD were demonstrated in both males and females (Fig. 3B–D). Yet unlike other functions such as  , examination of z-scores for BMD (0.13 ± 0.85 and 0.27 ± 1.35 for male hip and lumbar spine BMD, respectively, and 0.06 ± 0.66 and 0.01 ± 1.10 for females) clearly indicate that bone strength in these exercisers is not superior to the general population. This lack of an exercise benefit is presumably explained by the relatively low loads applied to the skeleton during this type of exercise (Stewart & Hannan, 2000), which does not appear to maintain bone health above sedentary behaviour. Indeed six individuals in the current study were diagnosed as being osteoporotic.
Metabolic and endocrine function
Analysis of blood samples for metabolic function provide indicators of the risk factors for cardiovascular disease and type II diabetes (Grundy et al. 1999). In the general population, regular exercise is known to induce a favourable blood lipid profile by reducing cholesterol, LDL and triglyceride levels and elevating HDL levels (Mann et al. 2014). We analysed fasting serum samples for a number of metabolic markers and found triglyceride levels within the normal clinical range (<1.7 mmol l−1) as were the values for cholesterol and LDL, although they were borderline high (cholesterol >6.2 mmol l−1 and LDL > 4.1 mmol l−1 regarded as high). As previously reported in master athletes (Wiswell et al. 2001), HDL levels were high. Insulin levels and all HOMA measurements were found to be within the normal range and similar to that reported in previous studies of older athletes (Kusy et al. 2013). Overall there was no effect of age on any of the variables measured (Table3) and the incidences fell within normal clinically healthy ranges.
Testosterone levels are typically 10-fold higher in males than females (Harman et al. 2001; Sowers et al. 2001) a finding supported in the current study. An age-related decline in testosterone levels in men, known as the andropause, has been reported (Harman, 2005), but interestingly was not apparent in our results. Exercise training in sedentary older men can increase testosterone levels (Hayes et al. 2013), and therefore the exercise status of the current subjects may have preserved testosterone levels into old age. Crucially, this suggests that previously reported declines in testosterone with age may also be related to declining activity levels. DHEAS levels decline from the age of 20–30 years both in males and in females. DHEAS levels in the present study were similar to those previously reported in healthy, untrained older individuals and lower than that seen in young adults (Leblhuber et al. 1993), suggesting a reduction with age, although this was not apparent in the age range studied. Likewise, the IGF/growth hormone (GH) axis has been reported to be affected by ageing, with many older people being GH/IGF-I-deficient (Bartke, 2008). Indeed, the sensitivity of IGF-1 to age in highly active individuals even at a young age is reflected in the age-correction factors applied when measuring IGF-1 levels in young athletes as a biomarker of recombinant GH abuse (Healy et al. 2005). It is thus not surprising that in the present study IGF-1 was also shown to decline significantly with age.
Resting cardiovascular and respiratory function
As has previously been reported for endurance athletes (D'Andrea et al. 2011) the cyclists in the present study had low resting HRs and DBPs with all bar two having a DBP < 80 mmHg. There was no association with age in this parameter. A mean SBP of 134 ± 16 mmHg is in close agreement with previous reports on master athletes and its increase was associated with age in men, but not women. Although not investigated in the present study, master athletes are likely to have varying degrees of left ventricular hypertrophy, moderate cardiac enlargement and larger end diastolic volume (Seals et al. 1994; Carrick-Ranson et al. 2014), probably related to a greater left ventricular diastolic chamber compliance, distensibility, rapid active relaxation and vigorous diastolic suction (Levine et al. 1991; Carrick-Ranson et al. 2014). Elevated SBP may also be explained by mechanisms similar to those which cause spurious systolic hypertension in younger active individuals where raised blood pressure is attributed to an amplification of the pressure from the aorta to the brachial arteries due to an increase in the elasticity of the arteries (Mahmud & Feely, 2003). Indeed, previous studies have found that the reported age-associated increase in aortic stiffening is attenuated in master athletes, with master athletes having aortic ‘ages’ similar to that of younger individuals (Shibata & Levine, 2011). It is possible that due to their high activity levels the subjects in the present study exhibited an increased elasticity of their arteries that, coupled with the low resting HR, could explain the elevated SBP.
Lung function is one area where clinical data are typically reported as age-predicated values, suggesting a strong association with age. The data sets from which such predictive measures are based are from the general population, but previous studies of master athletes have shown that PEF, FVC and FEV1 values are superior to those predicted, although absolute values decline with increasing age and women have lower values than men (Degens et al. 2013). The same observations are reported here, but the associations with age are not strong (Fig. 5D–F). When expressed as a percentage of that predicted based on age, height and sex it is apparent that lung function is again superior to that of the general population; in particular, FEV1 and FVC are respectively ∼10 and ∼28% greater. An FEV1/FVC below 70% is used as a clinical indicator of airway obstruction (Swanney et al. 2008). Interestingly, and in general agreement with previous studies on master athletes (Degans et al. 2013), the mean FEV1/FVC for all the cyclists in the present study was below this clinical threshold, which in the absence of other data would suggest functional impairment.
Neuromuscular function
There is no denying the effect of age on neuromuscular performance, as evidenced by the declines in strength, power and athletic performance in highly trained elite master power athletes such as weightlifters and sprinters (Grassi et al. 1991; Pearson et al. 2002; Rittweger et al. 2009). This is further demonstrated in the current study, where even though activity levels were high and constant across the age range, reductions in both maximum isometric knee extensor strength and the peak power obtained during sprint cycling were apparent. These changes were not due to a decreased ability to activate the quadriceps muscle (Fig. 6D). However, the values for both knee extensor strength (Skelton et al. 1994) and peak cycling power (Pearson et al. 2006) are superior to those previously reported for similarly aged individuals.
As with lower limb function, handgrip strength also was associated with age in men, but was not statistically so in women. Handgrip is a relatively simple measure that can be used clinically, with low values being predictive of all-cause mortality (Desrosiers et al. 1995; Metter et al. 2002) and disability (Rantanen et al. 1999). Previous studies have found that grip strengths of below 33 kg in men and 21 kg in women are predictive of mobility limitation in normal weight individuals (Sallinen et al. 2010). Based on these cut-off values none of the women in the current study were at risk of mobility limitation, although one male was (0.02 kg lower than cut-off). Given the subjects’ exercise status and the minimal difference from the cut-off, it is probable that this low grip strength does not signify mobility limitation, but rather reflects the low body mass of this cyclist (61.5 kg).
In addition to mechanical output of muscle we were interested to investigate components of the neural system. Sarcopenia has been associated with a loss of motor units (Lexell et al. 1988). However, evidence comparing endurance runners with sedentary individuals using surface and intramuscular EMG to estimate motor unit number in the tibialis anterior suggests that exercise may be protective of the age-related loss in motor unit number seen in non-active individuals (Power et al. 2010). We were not able to measure this parameter in the present study, although we did measure other indices of neural function such as peroneal nerve conduction and the Hoffman reflex of the soleus muscle, the latter of which has previously been shown to be lowered in ageing (Kido et al. 2004). Our study showed no association between these parameters and age, but a wide range in values for both NCV and Hmax/Mmax were observed, as has been documented previously (Angulo-Kinzler et al. 1998; Aagaard et al. 2002; Scaglioni et al. 2003; Klass et al. 2007). Hmax/Mmax has a reported intraclass correlation coefficient of >0.95 (Palmieri et al. 2002) and has previously been found to decline from ∼0.65 to 0.15 between 20 and 80 years of age (Kido et al. 2004). The lack of association in the current study may be due to the large inter-subject variability in Hmax/Mmax (Fig. 6F) with the variability reported in the current study similar to that previously found in older individuals (Scaglioni et al. 2003). It is possible, however, that the lack of association in these cyclists could also be because the ageing signal is indeed less, or is masked by the more constrained age range (55–79 years) studied here as opposed to those studying wider age ranges including young individuals (20–80 years).
In addition to physiological measurements, we also performed clinically relevant tasks of neuromuscular function assessing balance and functional mobility (Fig. 6G–J). There appears to be a minimal effect of age on balance, although in the male subjects EC balance did show a weak association with age. TUG is a commonly used functional assessment for older individuals (Podsiadlo & Richardson, 1991). A completion time of >15 s indicates a high risk of falling (Whitney et al. 2005) while a value greater than 9–10 s may indicate a need for interventions to improve strength and power (Bohannon, 2006). Even the oldest participants in the present study fell well below these levels with an average time of 5.6 s, which is superior to that reported for the general older population (Bohannon, 2006) and well within the norm reported for healthy young adults (Bergmann et al. 2009).
Cognitive function, health and well-being
In addition to the wide portfolio of physiological assessments we also assessed the effects of ageing on cognitive function using two different tests, one which provides information regarding attention, mental speed and efficiency, while the other assesses verbal fluency and memory (Richards et al. 1999; Sager et al. 2006). The former indicated no age-associated change in speed of information processing, with values superior to those typically reported in this age range (between 40 and 80 more letters scanned). In contrast, efficiency of information processing declined with age at a similar rate (5–10% per decade) to that seen in the general population (Huppert, 1987). There was little effect of age on verbal fluency and memory as assessed by the animal naming task, although generally superior values to that of a typical individual aged over 50 years were found (25 vs. 19 animals named; Sager et al. 2006).
We were interested to investigate if the relatively high levels of physiological function observed in our cohort were reflected in markers of health and well-being. Scores ≤ 8 on the anxiety and depression component of the Hospital Anxiety and Depression Scale suggest individuals do not suffer from anxiety or depression. Based on these scores no subjects suffered from depression while 11 had elevated levels of anxiety, although none were classified as actually having anxiety (scores > 10; Gale et al. 2012). Self-reported physical and mental health were not associated with age in men while a moderate decline in self-reported physical health was apparent in women. The SF12v2 is scored using a norm-based reporting system where a value of 50 represents the mean of the general population (Ware et al. 2002). Given that both the self-reported mental and physical component scores obtained in the current study range from 53 to 58, it is clear that both are higher than would typically be expected in the general population (Table4), possibly due to the beneficial effect exercise has on physical function.
Conclusion
This study has characterised the physiological phenotype of a group of highly active, non-elite, older athletes, who we contend represent a model of inherent healthy human ageing. Despite studying a large number and diverse range of indices, it was not possible to identify a physiological marker that could be used to reliably predict the age of a given individual. Rather, we have found that the relationship between chronological age and most functions is complex, as is highlighted by the wide range of ages accommodated in any given bandwidth of function. The biological ageing process, even when free from confounding factors, is thus likely to be highly individualistic. Our results provide further support for the need for comprehensive longitudinal studies of human ageing using appropriate cohorts and taking physical activity into account, if the relationship between age and physiological function is to be elucidated and reliable biomarkers of ageing obtained.
Acknowledgments
We thank Lindsey Marjoram, Tony Christopher and Melanie Fleming for their assistance with testing and the staff of the Osteoporosis Unit in Guy's Hospital for performing the DXA scans. We would like to thank Professor Roger Woledge for statistical assistance.
Translational perspective
Despite extensive research, the relationship between age and physiological function remains poorly characterised. There have been many studies undertaken to try and bridge this gap by identifying a marker that will accurately link age and biological function in healthy people. These studies have used molecular markers such as DNA methylation and telomere length as well as physiological markers such as  . An important confounding factor in all these marker studies is the often overlooked negative effects of inactivity. In modern societies with the majority of the population being inactive it is easy to assume that inactivity is the default condition for human physiology. We strongly disagree with this position because inactivity has been shown not only to confound the indices mentioned above, but also to exert negative influence across the whole of human physiology. Our hypothesis is that the evolutionary history of humans mandates that the default condition for a healthy human is a lifestyle in which exercise is integral. Accordingly, we studied a wide spectrum of physiological, endocrine and blood indices in an exercising cohort of men and women aged 55–79 years. We found that
  showed the best correlation with age. However, the intrinsic physiological heterogeneity displayed even in this carefully selected exercising population rendered this index unsuitable for use as a predictor of the age of an individual. Prospective longitudinal studies in exercising men and women are a necessity to advance knowledge on healthy human ageing to identify factors that contribute to intrinsic human ageing that are not due to lifestyle influences such as inactivity.
Glossary
Abbreviations
- AP
anterior–posterior
- BMD
bone mineral density
- DBP
diastolic blood pressure
- DHEAS
dehydroepiandrosterone sulphate
- DXA
dual-energy X-ray absorptiometry
- EC
eyes closed
- EMG
electromyography
- EO
eyes open
- FEV1
force expiratory volume in 1 s
- FVC
forced vital capacity
- GH
growth hormone
- HADS
Hospital Anxiety and Depression Scale
- HDL
high-density lipoprotein
- HOMA
homeostatic model assessment
- HR
heart rate
- IGF
insulin-like growth factor
- LDL
low-density lipoprotein
- MAP
mean arterial pressure
- ML
medial–lateral
- MVC
maximal voluntary contraction
- NCV
nerve conduction velocity
- PEF
peak expiratory flow
- PP
peak explosive power
- PSQI
Pittsburgh Sleep Quality Index
- SBP
systolic blood pressure
- SMI
skeletal muscle mass index
- TUG
the timed up and go test
- VA
voluntary activation
- VM
vector magnitude
- VT
ventilatory threshold
Additional information
Competing interests
The authors declare no competing or conflicts of interest.
Author contributions
S.H., N.L., J.L. and R.P. were involved with the conception and design of experiments. R.P., N.L. and S.H. were responsible for collection of data and subject recruitment. R.P., S.C., C.V. and N.D. were responsible for data analysis. All authors were involved with drafting or revising the manuscript.
Funding
We thank the BUPA Foundation for supporting this project.
Supporting Information
Disclaimer: Supporting information has been peer-reviewed but not copyedited.
Table S1. Daily nutritional intake as assessed by the Food Frequency Questionnaire. Values are mean (SD) except correlations which are r (P-value); * indicates males are significantly greater than females (P < 0.01).
References
- Aagaard P, Simonsen E, Andersen J, Magnusson P. Dyhre-Poulsen P. Neural adaptation to resistance training: changes in evoked V-wave and H-reflex responses. J Appl Physiol. 2002;92:2309–2318. doi: 10.1152/japplphysiol.01185.2001. [DOI] [PubMed] [Google Scholar]
- Angulo-Kinzler R, Mynark R. Koceja D. Soleus H-reflex gain in elderly and young adults: modulation due to body position. J Gerontol A Biol Sci Med Sci. 1998;53A:M120:125. doi: 10.1093/gerona/53a.2.m120. [DOI] [PubMed] [Google Scholar]
- Babcock MA, Paterson DH. Cunningham DA. Effects of aerobic endurance training on gas exchange kinetics of older men. Med Sci Sport Exerc. 1994;26:447–452. [PubMed] [Google Scholar]
- Bartke A. Growth hormone and aging: a challenging controversy. Clin Interv Ageing. 2008;3:659–665. doi: 10.2147/cia.s3697. [DOI] [PMC free article] [PubMed] [Google Scholar]
- Bartke A, Wright JC, Mattison JA, Ingram DK, Miller RA. Roth GS. Extending the lifespan of long-lived mice. Nature. 2001;414:412. doi: 10.1038/35106646. [DOI] [PubMed] [Google Scholar]
- Bassett DR. Howley ET. Limiting factors for maximum oxygen uptake and determinants of endurance performance. Med Sci Sports Exerc. 2000;32:70–84. doi: 10.1097/00005768-200001000-00012. [DOI] [PubMed] [Google Scholar]
- Baumgartner RN, Koehler KM, Gallagher D, Romero L, Heymstleld SB, Ross RR, Garry PJ. Lindeman RD. Epidemiology of sarcopenia among the elderly in New Mexico. Am J Epidemiol. 1998;147:755–763. doi: 10.1093/oxfordjournals.aje.a009520. [DOI] [PubMed] [Google Scholar]
- Bell C, Paterson DH, Kowalchuk JM. Cunningham DA. Oxygen uptake kinetics of older humans are slowed with age but are unaffected by hyperoxia. Exp Physiol. 1999;84:747–759. [PubMed] [Google Scholar]
- Bergmann JHM, Alexiou C. Smith ICH. Procedural differences directly affect timed up and go times. J Am Geriatr Soc. 2009;57:2168–2169. doi: 10.1111/j.1532-5415.2009.02547.x. [DOI] [PubMed] [Google Scholar]
- Bingham S, Gill C, Welch A, Day K, Cassidy A, Khaw K, Sneyd M, Key T, Roe L. Day N. Comparison of dietary assessment methods in nutritional epidemiology: weighed records v. 24 h recalls, food-frequency questionnaires and estimated-diet records. Br J Nutr. 1994;72:619–643. doi: 10.1079/bjn19940064. [DOI] [PubMed] [Google Scholar]
- Blair S, Kohl H, 3rd, Paffenbarger RJ, Clark D, Cooper K. Gibbons L. Physical fitness and all-cause mortality. A prospective study of healthy men and women. JAMA. 1989;262:2395–2401. doi: 10.1001/jama.262.17.2395. [DOI] [PubMed] [Google Scholar]
- Blair SN. Physical inactivity: the biggest public health problem of the 21st century. Br J Sports Med. 2009;43:1–2. [PubMed] [Google Scholar]
- Bohannon RW. Reference values for the timed up and go test: a descriptive meta-analysis. J Geriatr Phys Ther. 2006;29:64–68. doi: 10.1519/00139143-200608000-00004. [DOI] [PubMed] [Google Scholar]
- Booth FW, Gordon SE, Carlson CJ, Hamilton MT. Frank W. Waging war on modern chronic diseases: primary prevention through exercise biology. J Appl Physiol. 2000;88:774–787. doi: 10.1152/jappl.2000.88.2.774. [DOI] [PubMed] [Google Scholar]
- Booth FW. Lees SJ. Physically active subjects should be the control group. Med Sci Sports Exerc. 2006;38:405–406. doi: 10.1249/01.mss.0000205117.11882.65. [DOI] [PubMed] [Google Scholar]
- Bouchard C. Rankinen T. Individual differences in response to regular physical activity. Med Sci Sports Exerc. 2001;33:S446–51. doi: 10.1097/00005768-200106001-00013. [DOI] [PubMed] [Google Scholar]
- Burnley M, Doust JH. Jones AM. Time required for the restoration of normal heavy exercise VO2 kinetics following prior heavy exercise. J Appl Physiol. 2006;101:1320–1327. doi: 10.1152/japplphysiol.00475.2006. [DOI] [PubMed] [Google Scholar]
- Buysse DJ, Reynolds CF, Monk TH, Berman SR. Kupfer DJ. The Pittsburgh Sleep Quality Index (PSQI): a new instrument for psychiatric research and practice. Psychiatry Res. 1989;28:193–213. doi: 10.1016/0165-1781(89)90047-4. [DOI] [PubMed] [Google Scholar]
- Carrick-Ranson G, Hastings JL, Bhella PS, Fujimoto N, Shibata S, Palmer MD, Boyd K, Livingston S, Dijk E. Levine BD. The effect of lifelong exercise dose on cardiovascular function during exercise. J Appl Physiol. 2014;116:736–745. doi: 10.1152/japplphysiol.00342.2013. [DOI] [PMC free article] [PubMed] [Google Scholar]
- Cruz-Jentoft AJ, Baeyens JP, Bauer JM, Boirie Y, Cederholm T, Landi F, Martin FC, Michel J-P, Rolland Y, Schneider SM, Topinková E, Vandewoude M. Zamboni M. Sarcopenia: European consensus on definition and diagnosis: Report of the European Working Group on Sarcopenia in Older People. Age Ageing. 2010;39:412–423. doi: 10.1093/ageing/afq034. [DOI] [PMC free article] [PubMed] [Google Scholar]
- D'Andrea A, Naeije R, D'Alto M, Argiento P, Golia E, Cocchia R, Riegler L, Scarafile R, Limongelli G, Di Salvo G, Citro R, Caso P, Russo MG, Calabrò R. Bossone E. Range in pulmonary artery systolic pressure among highly trained athletes. Chest. 2011;139:788–794. doi: 10.1378/chest.10-1260. [DOI] [PubMed] [Google Scholar]
- Degens H, Maden-Wilkinson TM, Ireland A, Korhonen MT, Suominen H, Heinonen A, Radak Z, McPhee JS. Rittweger J. Relationship between ventilatory function and age in master athletes and a sedentary reference population. Age (Omaha) 2013;35:1007–1015. doi: 10.1007/s11357-012-9409-7. [DOI] [PMC free article] [PubMed] [Google Scholar]
- DeLorey DS, Kowalchuk JM. Paterson DH. Effect of age on O2 uptake kinetics and the adaptation of muscle deoxygenation at the onset of moderate-intensity cycling exercise. J Appl Physiol. 2004;97:165–172. doi: 10.1152/japplphysiol.01179.2003. [DOI] [PubMed] [Google Scholar]
- Desrosiers J, Bravo G. Dutil E. Normative data for grip strength of elderly men and women. Am J Occup Ther. 1995;49:637–644. doi: 10.5014/ajot.49.7.637. [DOI] [PubMed] [Google Scholar]
- Doherty TJ. Invited Review: Aging and sarcopenia. J Appl Physiol. 2003;95:1717–1727. doi: 10.1152/japplphysiol.00347.2003. [DOI] [PubMed] [Google Scholar]
- Faul F, Erdfelder E, Buchner A. Lang A-G. Statistical power analyses using G*Power 3.1: tests for correlation and regression analyses. Behav Res Methods. 2009;41:1149–1160. doi: 10.3758/BRM.41.4.1149. [DOI] [PubMed] [Google Scholar]
- Faulkner JA, Davis CS, Mendias CL. Brooks SV. The aging of elite male athletes: age-related changes in performance and skeletal muscle structure and function. Clin J Sport Med. 2008;18:501–507. doi: 10.1097/JSM.0b013e3181845f1c. [DOI] [PMC free article] [PubMed] [Google Scholar]
- Gale CR, Dennison EM, Edwards M, Sayer AA. Cooper C. Symptoms of anxiety or depression and risk of fracture in older people: the Hertfordshire Cohort Study. Arch Osteoporos. 2012;7:59–65. doi: 10.1007/s11657-012-0080-5. [DOI] [PMC free article] [PubMed] [Google Scholar]
- Gaskill SE, Ruby BC, Walker AJ, Sanchez OA, Serfass RC. Leon AS. Validity and reliability of combining three methods to determine ventilatory threshold. Med Sci Sport Exerc. 2001;33:1841–1848. doi: 10.1097/00005768-200111000-00007. [DOI] [PubMed] [Google Scholar]
- Ghosh S, Vivar JC, Sarzynski M, Sung YJ, Timmons J, Bouchard C. Rankinen T. Integrative pathway analysis of a genome-wide association study of Vo2max response to exercise training. J Appl Physiol. 2013;115:1343–1359. doi: 10.1152/japplphysiol.01487.2012. [DOI] [PMC free article] [PubMed] [Google Scholar]
- Grassi B, Cerretelli P, Narici MV. Marconi C. Peak anaerobic power in master athletes. Eur J Appl Physiol. 1991;62:394–399. doi: 10.1007/BF00626609. [DOI] [PubMed] [Google Scholar]
- Greig C, Young A, Skelton D, Pippet E, Butler F. Mahmud S. Exercise studies with elderly volunteers. Age Ageing. 1994;23:185–189. doi: 10.1093/ageing/23.3.185. [DOI] [PubMed] [Google Scholar]
- Grundy S, Benjamin I, Burke G, Chait A, Eckel R, Howard B, Mitch W, Smith S. Sowers J. Diabetes and cardiovascular disease: a statement for healthcare professionals from the American Heart Association. Circulation. 1999;100:1134–1146. doi: 10.1161/01.cir.100.10.1134. [DOI] [PubMed] [Google Scholar]
- Harman SM. Testosterone in older men after the Institute of Medicine Report: where do we go from here? Climacteric. 2005;8:124–135. doi: 10.1080/13697130500118001. [DOI] [PubMed] [Google Scholar]
- Harman SM, Metter EJ, Tobin JD, Pearson JAY. Blackman MR. Longitudinal effects of aging on serum total and free testosterone levels in healthy men. J Clin Endocrinol Metab. 2001;86:724–731. doi: 10.1210/jcem.86.2.7219. [DOI] [PubMed] [Google Scholar]
- Hayes LD, Grace FM, Sculthorpe N, Herbert P, Ratcliffe JW, Kilduff LP. Baker JS. The effects of a formal exercise training programme on salivary hormone concentrations and body composition in previously sedentary aging men. Springerplus. 2013;2:18. doi: 10.1186/2193-1801-2-18. [DOI] [PMC free article] [PubMed] [Google Scholar]
- Healy M-L, Dall R, Gibney J, Bassett E, Ehrnborg C, Pentecost C, Rosen T, Cittadini A, Baxter RC. Sönksen PH. Toward the development of a test for growth hormone (GH) abuse: a study of extreme physiological ranges of GH-dependent markers in 813 elite athletes in the postcompetition setting. J Clin Endocrinol Metab. 2005;90:641–649. doi: 10.1210/jc.2004-0386. [DOI] [PubMed] [Google Scholar]
- Horvath S. DNA methylation age of human tissues and cell types DNA methylation age of human tissues and cell types. Genome Biol. 2013;14:R115. doi: 10.1186/gb-2013-14-10-r115. [DOI] [PMC free article] [PubMed] [Google Scholar]
- House of Lords Science and Technology Committee. Ageing: Scientific Aspects (Volume I: Report) London: The Stationery Office; 2005. [Google Scholar]
- Huppert FA. In: Cognitive function: Health and Lifestyle Survey: Preliminary Report of a National Survey of Physical and Mental Health Attitudes and Lifestyle of a Random Sample of 9003 British Adults. Buckle A, editor; Cox B, Blaxter M, editors. Washington: Health Promotion Trust; 1987. [Google Scholar]
- Jones A. Carter H. The effect of endurance training on parameters of aerobic fitness. Sport Med. 2000;29:373–386. doi: 10.2165/00007256-200029060-00001. [DOI] [PubMed] [Google Scholar]
- Kido A, Tanaka B. Stein R. Spinal excitation and inhibition decrease as humans age. Can J Physiol Pharmacol. 2004;82:238–248. doi: 10.1139/y04-017. [DOI] [PubMed] [Google Scholar]
- Kirkland JL. Peterson C. Healthspan, translation, and new outcomes for animal studies of aging. J Gerontol A Biol Sci Med Sci. 2009;64:209–212. doi: 10.1093/gerona/gln063. [DOI] [PMC free article] [PubMed] [Google Scholar]
- Klass M, Baudry S. Duchateau J. Voluntary activation during maximal contraction with advancing age: a brief review. Eur J Appl Physiol. 2007;100:543–551. doi: 10.1007/s00421-006-0205-x. [DOI] [PubMed] [Google Scholar]
- Klass M, Baudry S. Duchateau J. Age-related decline in rate of torque development is accompanied by lower maximal motor unit discharge frequency during fast contractions. J Appl Physiol. 2008;104:739–746. doi: 10.1152/japplphysiol.00550.2007. [DOI] [PubMed] [Google Scholar]
- Kusy K. Zieliński J. Aerobic capacity in speed-power athletes aged 20–90 years vs endurance runners and untrained participants. Scand J Med Sci Sports. 2014;24:68–79. doi: 10.1111/j.1600-0838.2012.01496.x. [DOI] [PubMed] [Google Scholar]
- Kusy K, Zieliński J. Pilaczyńska-Szcześniak L. Insulin sensitivity and β-cell function estimated by HOMA2 model in sprint-trained athletes aged 20–90 years vs endurance runners and untrained participants. J Sports Sci. 2013;31:1656–1664. doi: 10.1080/02640414.2013.792954. [DOI] [PubMed] [Google Scholar]
- LaRocca TJ, Seals DR. Pierce GL. Leukocyte telomere length is preserved with aging in endurance exercise-trained adults and related to maximal aerobic capacity. Mech Ageing Dev. 2010;131:165–167. doi: 10.1016/j.mad.2009.12.009. [DOI] [PMC free article] [PubMed] [Google Scholar]
- Lazarus NR. Harridge SDR. Exercise, physiological function, and the selection of participants for aging research. J Gerontol A Biol Sci Med Sci. 2010;65A:854–857. doi: 10.1093/gerona/glq016. [DOI] [PubMed] [Google Scholar]
- Leblhuber F, Neuhaoer C, Peichl M, Reisecker F, Steinparz FX, Windhager E. Dienstl E. Age and sex differences of dehydroepiandrosterone sulfate (DHEAS) and cortisol (CRT) plasma levels in normal controls and Alzheimer's disease (AD) Psychopharmacology (Berl) 1993;111:23–26. doi: 10.1007/BF02257402. [DOI] [PubMed] [Google Scholar]
- Levine BD, Lane LD, Buckey JC, Friedman DB. Blomqvist CG. Left ventricular pressure–volume and Frank-Starling relations in endurance athletes. Implications for orthostatic tolerance and exercise performance. Circulation. 1991;84:1016–1023. doi: 10.1161/01.cir.84.3.1016. [DOI] [PubMed] [Google Scholar]
- Lexell J, Taylor CC. Sjostrom M. What is the cause of the aging atrophy – total number, size and proportion of different fibre types studied in whole vastus lateralis muscle from 15-year old to 83-year old men. J Neurol Sci. 1988;84:275–294. doi: 10.1016/0022-510x(88)90132-3. [DOI] [PubMed] [Google Scholar]
- Lindle RS, Metter EJ, Lynch NA, Fleg JL, Fozard JL, Tobin J, Roy TA. Hurley BF. Age and gender comparisons of muscle strength in 654 women and men aged 20–93 yr. J Appl Physiol. 1997;83:1581–1587. doi: 10.1152/jappl.1997.83.5.1581. [DOI] [PubMed] [Google Scholar]
- Ma F, Yang Y, Li X, Zhou F, Gao C, Li M. Gao L. The association of sport performance with ACE and ACTN3 genetic polymorphisms: a systematic review and meta-analysis. PLoS One. 2013;8:e54685. doi: 10.1371/journal.pone.0054685. [DOI] [PMC free article] [PubMed] [Google Scholar]
- Mahmud A. Feely J. Spurious systolic hypertension of youth: fit young men with elastic arteries. Am J Hypertens. 2003;16:229–232. doi: 10.1016/s0895-7061(02)03255-7. [DOI] [PubMed] [Google Scholar]
- Mann S, Beedie C. Jimenez A. Differential effects of aerobic exercise, resistance training and combined exercise modalities on cholesterol and the lipid profile: review, synthesis and recommendations. Sports Med. 2014;44:211–221. doi: 10.1007/s40279-013-0110-5. [DOI] [PMC free article] [PubMed] [Google Scholar]
- McArdle W, Katch F. Katch V. Exercise Physiology: Energy, Nutrition, and Human Performance. 8th edn. Philidelphia: Lippincott, Williams & Wilkins; 2014. [Google Scholar]
- McCauley T, Mastana SS, Hossack J, Macdonald M. Folland JP. Human angiotensin-converting enzyme I/D and α-actinin 3 R577X genotypes and muscle functional and contractile properties. Exp Physiol. 2009;94:81–89. doi: 10.1113/expphysiol.2008.043075. [DOI] [PubMed] [Google Scholar]
- McGuire DK, Levine BD, Williamson JW, Snell PG, Gunnar C, Saltin B. Mitchell JH. A 30-year follow-up of the Dallas Bedrest and Training Study: I. Effect of age on the cardiovascular response to exercise. Circulation. 2001;104:1350–1357. [PubMed] [Google Scholar]
- Metter EJ, Lynch N, Conwit R, Lindle R, Tobin J. Hurley B. Muscle quality and age: cross-sectional and longitudinal comparisons. J Gerontol A Biol Sci Med Sci. 1999;54:B207–218. doi: 10.1093/gerona/54.5.b207. [DOI] [PubMed] [Google Scholar]
- Metter EJ, Talbot LA, Schrager M. Conwit R. Skeletal muscle strength as a predictor of all-cause mortality in healthy men. J Gerontol A Biol Sci Med Sci. 2002;57:B359–365. doi: 10.1093/gerona/57.10.b359. [DOI] [PubMed] [Google Scholar]
- Miller MR, Hankinson J, Brusasco V, Burgos F, Casaburi R, Coates A, Crapo R, Enright P, van der Grinten CPM, Gustafsson P, Jensen R, Johnson DC, MacIntyre N, McKay R, Navajas D, Pedersen OF, Pellegrino R, Viegi G. Wanger J. Standardisation of spirometry. Eur Respir J. 2005;26:319–338. doi: 10.1183/09031936.05.00034805. [DOI] [PubMed] [Google Scholar]
- Murias JM, Spencer MD, Kowalchuk JM. Paterson DH. Influence of phase I duration on phase II VO2 kinetics parameter estimates in older and young adults. Am J Physiol Regul Integr Comp Physiol. 2011;301:R218–24. doi: 10.1152/ajpregu.00060.2011. [DOI] [PubMed] [Google Scholar]
- Myerson S, Hemingway H, Budget R, Martin J, Humphries S. Montgomery H. Human angiotensin I-converting enzyme gene and endurance performance. J Appl Physiol. 1999;87:1313–1316. doi: 10.1152/jappl.1999.87.4.1313. [DOI] [PubMed] [Google Scholar]
- O'Brien TD, Reeves ND, Baltzopoulos V, Jones D. Maganaris CN. In vivo measurements of muscle specific tension in adults and children. Exp Physiol. 2010;95:202–210. doi: 10.1113/expphysiol.2009.048967. [DOI] [PubMed] [Google Scholar]
- Oeppen J. Vaupel J. Broken limits to life expectancy. Science. 2002;296:1029–1031. doi: 10.1126/science.1069675. [DOI] [PubMed] [Google Scholar]
- Palmieri RM, Hoffman MA. Ingersoll CD. Intersession reliability for H-reflex measurements arising from the soleus, peroneal, and tibialis anterior musculature. Int J Neurosci. 2002;112:841–850. doi: 10.1080/00207450290025851. [DOI] [PubMed] [Google Scholar]
- Paterson D, Cunningham D, Koval J. St. Croix C. Aerobic fitness in a population of independently living men and women aged 55–86 years. Med Sci Sport Exerc. 1999;31:1813. doi: 10.1097/00005768-199912000-00018. [DOI] [PubMed] [Google Scholar]
- Pearson SJ, Cobbold M. Harridge SDR. Power output of the lower limb during variable inertial loading: a comparison between methods using single and repeated contractions. Eur J Appl Physiol. 2004;92:176–181. doi: 10.1007/s00421-004-1046-0. [DOI] [PubMed] [Google Scholar]
- Pearson SJ, Cobbold M, Orrell RW. Harridge SD. Power output and muscle myosin heavy chain composition in young and elderly men. Med Sci Sport Exerc. 2006;38:1601–1607. doi: 10.1249/01.mss.0000227638.75983.9d. [DOI] [PubMed] [Google Scholar]
- Pearson SJ, Young A, Macaluso A, Devito G, Nimmo MA, Cobbold M. Harridge SDR. Muscle function in elite master weightlifters. Med Sci Sports Exerc. 2002;34:1199–1206. doi: 10.1097/00005768-200207000-00023. [DOI] [PubMed] [Google Scholar]
- Podsiadlo D. Richardson S. The timed up and go – a test of basic functional mobility for frail elderly persons. J Am Geriatr Soc. 1991;39:142–148. doi: 10.1111/j.1532-5415.1991.tb01616.x. [DOI] [PubMed] [Google Scholar]
- Power G, Dalton BH, Behm DG, Vandervoort A, Doherty TJ. Rice CL. Motor unit number estimates in masters runners: use it or lose it? Med Sci Sports Exerc. 2010;42:1644–1650. doi: 10.1249/MSS.0b013e3181d6f9e9. [DOI] [PubMed] [Google Scholar]
- Rantanen T, Guralnik JM, Foley D, Masaki K, Leveille S, Curb JD. White L. Midlife hand grip strength as a predictor of old age disability. J Am Med Assoc. 1999;281:558–560. doi: 10.1001/jama.281.6.558. [DOI] [PubMed] [Google Scholar]
- Richards M, Kuh D, Hardy R. Wadsworth M. Lifetime cognitive function and timing of the natural menopause. Neurology. 1999;53:308–314. doi: 10.1212/wnl.53.2.308. [DOI] [PubMed] [Google Scholar]
- Rittweger J, di Prampero PE, Maffulli N. Narici MV. Sprint and endurance power and ageing: an analysis of master athletic world records. Proc Biol Sci. 2009;276:683–689. doi: 10.1098/rspb.2008.1319. [DOI] [PMC free article] [PubMed] [Google Scholar]
- Rogers MA, Hagberg JM, Martin WH, Ehsani AA. Holloszy JO. Decline in VO2max with aging in master athletes and sedentary men. J Appl Physiol. 1990;68:2195–2199. doi: 10.1152/jappl.1990.68.5.2195. [DOI] [PubMed] [Google Scholar]
- Rönn T, Volkov P, Davegårdh C, Dayeh T, Hall E, Olsson AH, Nilsson E, Tornberg A, Dekker Nitert M, Eriksson K-F, Jones HA, Groop L. Ling C. A six months exercise intervention influences the genome-wide DNA methylation pattern in human adipose tissue. PLoS Genet. 2013;9:e1003572. doi: 10.1371/journal.pgen.1003572. [DOI] [PMC free article] [PubMed] [Google Scholar]
- Rossiter HB, Ward SA, Doyle VL, Howe FA, Griffiths JR. Whipp BJ. Inferences from pulmonary O2 uptake with respect to intramuscular [phosphocreatine] kinetics during moderate exercise in humans. J Physiol. 1999;518:921–932. doi: 10.1111/j.1469-7793.1999.0921p.x. [DOI] [PMC free article] [PubMed] [Google Scholar]
- Rossiter HB, Ward SA, Kowalchuk JM, Howe FA, Griffiths JR. Whipp BJ. Dynamic asymmetry of phosphocreatine concentration and O2 uptake between the on- and off-transients of moderate- and high-intensity exercise in humans. J Physiol. 2002;541:991–1002. doi: 10.1113/jphysiol.2001.012910. [DOI] [PMC free article] [PubMed] [Google Scholar]
- Sager M, Hermann BP, La Rue A. Woodard JL. Screening for dementia in community-based memory clinics. WMJ. 2006;105:25–29. [PubMed] [Google Scholar]
- Sallinen J, Stenholm S, Rantanen T, Heliovaara M. Sainio P, Hoskinen S. Hand-grip strength cut-points to screen older persons at risk for mobility limitation. J Am Geriatr Soc. 2010;58:1721–1726. doi: 10.1111/j.1532-5415.2010.03035.x. [DOI] [PMC free article] [PubMed] [Google Scholar]
- Saltin B, Blomqvist G, Mitchell J, Johnson RJ, Wildenthal K. Chapman C. Response to exercise after bed rest and after training. Circulation. 1968;38(VII):1–78. [PubMed] [Google Scholar]
- Sasaki JE, John D. Freedson PS. Validation and comparison of ActiGraph activity monitors. J Sci Med Sport. 2011;14:411–416. doi: 10.1016/j.jsams.2011.04.003. [DOI] [PubMed] [Google Scholar]
- Scaglioni G, Narici MV, Maffiuletti NA, Pensini M. Martin A. Effect of ageing on the electrical and mechanical properties of human soleus motor units activated by the H reflex and M wave. J Physiol. 2003;548:649–661. doi: 10.1113/jphysiol.2002.032763. [DOI] [PMC free article] [PubMed] [Google Scholar]
- Seals DR, Hagberg JM, Spina RJ, Rogers MA, Schechtman KB. Ehsani AA. Enhanced left ventricular performance in endurance trained older men. Circulation. 1994;89:198–205. doi: 10.1161/01.cir.89.1.198. [DOI] [PubMed] [Google Scholar]
- Shibata S. Levine BD. Biological aortic age derived from the arterial pressure waveform. J Appl Physiol. 2011;110:981–987. doi: 10.1152/japplphysiol.01261.2010. [DOI] [PMC free article] [PubMed] [Google Scholar]
- Skelton DA, Greig CA, Davies JM. Young A. Strength, power and related functional ability of healthy people aged 65–89 years. Age Ageing. 1994;23:371–377. doi: 10.1093/ageing/23.5.371. [DOI] [PubMed] [Google Scholar]
- Skelton DA, Kennedy J. Rutherford OM. Explosive power and asymmetry in leg muscle function in frequent fallers and non-fallers aged over 65. Age Ageing. 2002;31:119–125. doi: 10.1093/ageing/31.2.119. [DOI] [PubMed] [Google Scholar]
- Snowden CP, Prentis JM, Anderson HL, Roberts DR, Randles D, Renton M. Manas DM. Submaximal cardiopulmonary exercise testing predicts complications and hospital length of stay in patients undergoing major elective surgery. Ann Surg. 2010;251:535–541. doi: 10.1097/SLA.0b013e3181cf811d. [DOI] [PubMed] [Google Scholar]
- Sowers MF, Beebe JL, McConnell D, Randolph J. Jannausch M. Testosterone concentrations in women aged 25–50 years: associations with lifestyle, body composition, and ovarian status. Am J Epidemiol. 2001;153:256–264. doi: 10.1093/aje/153.3.256. [DOI] [PubMed] [Google Scholar]
- Stewart AD. Hannan J. Total and regional bone density in male runners, cyclists, and controls. Med Sci Sport Exerc. 2000;32:1373–1377. doi: 10.1097/00005768-200008000-00003. [DOI] [PubMed] [Google Scholar]
- Swanney MP, Ruppel G, Enright PL, Pedersen OF, Crapo RO, Miller MR, Jensen RL, Falaschetti E, Schouten JP, Hankinson JL, Stocks J. Quanjer PH. Using the lower limit of normal for the FEV1/FVC ratio reduces the misclassification of airway obstruction. Thorax. 2008;63:1046–1051. doi: 10.1136/thx.2008.098483. [DOI] [PubMed] [Google Scholar]
- Tanaka H, Desouza CA, Jones PP, Stevenson ET, Kevin P, Seals DR, Souza CADE, Davy KP. Jones P. Greater rate of decline in maximal aerobic capacity with age in physically active vs. sedentary healthy women. J Appl Physiol. 1997;83:1947–1953. doi: 10.1152/jappl.1997.83.6.1947. [DOI] [PubMed] [Google Scholar]
- Tanaka H, Monahan KD. Seals DR. Age-predicted maximal heart rate revisited. J Am Coll Cardiol. 2001;37:153–156. doi: 10.1016/s0735-1097(00)01054-8. [DOI] [PubMed] [Google Scholar]
- Tanaka H. Seals DR. Endurance exercise performance in Masters athletes: age-associated changes and underlying physiological mechanisms. J Physiol. 2008;586:55–63. doi: 10.1113/jphysiol.2007.141879. [DOI] [PMC free article] [PubMed] [Google Scholar]
- Tatar M. Can we develop genetically tractable models to assess healthspan (rather than life span) in animal models? J Gerontol A Biol Sci Med Sci. 2009;64:161–163. doi: 10.1093/gerona/gln067. [DOI] [PMC free article] [PubMed] [Google Scholar]
- Truett G, Heeger P, Mynatt R, Truett A, Walker J. Warman M. Preparation of PCR-quality mouse genomic DNA with hot sodium hydroxide and tris (HotSHOT) Biotechniques. 2000;29:29–30. doi: 10.2144/00291bm09. [DOI] [PubMed] [Google Scholar]
- Ware JEJr, Kosinski M, Turner-Bowker DM. Gandek B. Users Manual for the SF-12v2 Health Survey with Supplement Documentating Sf-12 Health Survey. Lincoln, RI: Quality Metric Incorporated; 2002. [Google Scholar]
- Whitney JC, Lord SR. Close JCT. Streamlining assessment and intervention in a falls clinic using the Timed Up and Go Test and Physiological Profile Assessments. Age Ageing. 2005;34:567–571. doi: 10.1093/ageing/afi178. [DOI] [PubMed] [Google Scholar]
- Wilson TM. Tanaka H. Meta-analysis of the age-associated decline in maximal aerobic capacity in men: relation to training status. Am J Physiol Heart Circ Physiol. 2000;278:H829–834. doi: 10.1152/ajpheart.2000.278.3.H829. [DOI] [PubMed] [Google Scholar]
- Wiswell R, Hawkins S, Jaque SV, Hyslop D, Constantino N, Tarpenning K, Marcell T. Schroeder ET. Relationship between physiological loss, performance decrement, and age in master athletes. J Gerontol A Biol Sci Med Sci. 2001;56:M618–26. doi: 10.1093/gerona/56.10.m618. [DOI] [PubMed] [Google Scholar]
- Yang N, MacArthur DG, Gulbin JP, Hahn AG, Beggs AH, Easteal S. North K. ACTN3 genotype is associated with human elite athletic performance. Am J Hum Genet. 2003;73:627–631. doi: 10.1086/377590. [DOI] [PMC free article] [PubMed] [Google Scholar]
- Zigmond A. Snaith RP. The hospital anxiety and depression scale. Acta Physiol Scand. 1983;67:361. doi: 10.1111/j.1600-0447.1983.tb09716.x. [DOI] [PubMed] [Google Scholar]
Associated Data
This section collects any data citations, data availability statements, or supplementary materials included in this article.
Supplementary Materials
Table S1. Daily nutritional intake as assessed by the Food Frequency Questionnaire. Values are mean (SD) except correlations which are r (P-value); * indicates males are significantly greater than females (P < 0.01).