

Abstract
Cold exposure stimulates the sympathetic nervous system (SNS), triggering the activation of cold-defence responses and mobilizing substrates to fuel the thermogenic processes. Although these processes have been investigated independently, the physiological interaction and coordinated contribution of the tissues involved in producing heat or mobilizing substrates has never been investigated in humans. Using [U-13C]-palmitate and [3-3H]-glucose tracer methodologies coupled with positron emission tomography using 11C-acetate and 18F-fluorodeoxyglucose, we examined the relationship between whole body sympathetically induced white adipose tissue (WAT) lipolysis and brown adipose tissue (BAT) metabolism and mapped the skeletal muscle shivering and metabolic activation pattern during a mild, acute cold exposure designed to minimize shivering response in 12 lean healthy men. Cold-induced increase in whole-body oxygen consumption was not independently associated with BAT volume of activity, BAT oxidative metabolism, or muscle metabolism or shivering intensity, but depended on the sum of responses of these two metabolic tissues. Cold-induced increase in non-esterified fatty acid (NEFA) appearance rate was strongly associated with the volume of metabolically active BAT (r = 0.80, P = 0.005), total BAT oxidative metabolism (r = 0.70, P = 0.004) and BAT glucose uptake (r = 0.80, P = 0.005), but not muscle glucose metabolism. The total glucose uptake was more than one order of magnitude greater in skeletal muscles compared to BAT during cold exposure (674 ± 124 vs. 12 ± 8 μmol min−1, respectively, P < 0.001). Glucose uptake demonstrated that deeper, centrally located muscles of the neck, back and inner thigh were the greatest contributors of muscle glucose uptake during cold exposure due to their more important shivering response. In summary, these results demonstrate for the first time that the increase in plasma NEFA appearance from WAT lipolysis is closely associated with BAT metabolic activation upon acute cold exposure in healthy men. In humans, muscle glucose utilization during shivering contributes to a much greater extent than BAT to systemic glucose utilization during acute cold exposure.
Key points
Both brown adipose tissue (BAT) and skeletal muscle activation contribute to the metabolic response of acute cold exposure in healthy men even under minimal shivering.
Activation of adipose tissue intracellular lipolysis is associated with BAT metabolic response upon acute cold exposure in healthy men.
Although BAT glucose uptake per volume of tissue is important, the bulk of glucose turnover during cold exposure is mediated by skeletal muscle metabolic activation even when shivering is minimized.
Introduction
Skeletal muscle and brown adipose tissue (BAT) both demonstrate remarkable ranges in metabolic activity and flexibility. This is particularly evident in adult humans acutely exposed to the cold, when skeletal muscles demonstrate a broad range of shivering intensity, shivering pattern and substrate utilization (Haman et al. 2004a,b, 2005) or during chronic cold exposure, which increases BAT volume (van der Lans et al. 2013), BAT oxidative metabolism and glucose clearance by BAT (Blondin et al. 2014). BAT investigations in humans to date have usually reported an absence of overt shivering by non-quantitative direct observation and/or subjective reporting by participants (van Marken Lichtenbelt et al. 2009; Vijgen et al. 2011; Yoneshiro et al. 2011; Cypess et al. 2012; Muzik et al. 2012; Vijgen et al. 2012). In the only study that simultaneously quantified both shivering and BAT activity, a significant increase in cold-induced BAT oxidative metabolism was accompanied by limited but detectable levels of shivering activity, measured by surface electromyography (sEMG), representing ∼2% of a maximal voluntary contraction (Ouellet et al. 2012). The inverse relationship between BAT volume of metabolic activity and shivering activity in the latter study also suggested that cold-stimulated oxidative metabolism is driven by the combination of both shivering and BAT thermogenesis in healthy men. Deeper muscles that are not accessible by sEMG may also contribute significantly to the whole-body metabolic response observed during mild, acute cold exposure (Ouellet et al. 2012). However, no quantification of the relative contribution of the muscle shivering response in relation to BAT metabolic response and the effect on circulating energy substrate metabolism has been reported to date.
The sympathetic nervous system (SNS) stimulation resulting from acute cold exposure not only triggers the activation of cold-defence responses, such as shivering and BAT thermogenesis, but also mobilizes substrates to fuel these thermogenic processes. Given the sympathetic innervation of adipose tissues, cold-mediated SNS activation stimulates β-adrenergic receptor signalling in white adipose tissue (WAT) and BAT, thus activating intracellular lipolysis in both organs. Whereas sympathetic β-adrenergic stimulation of lipolysis in WAT mobilizes non-esterified fatty acids (NEFAs) towards thermogenic organs, such as BAT and shivering skeletal muscles (Ouellet et al. 2012), SNS-mediated lipolysis of intracellular triglycerides (TGs) in BAT serves to activate and fuel BAT thermogenesis (Cannon ´ Nedergaard, 2004). Regional differences in catecholamine-mediated lipolysis and adrenoreceptor activity across various WAT depots have previously been documented in humans (Leibel ´ Hirsch, 1987; Mauriege et al. 1987, 1991; Wahrenberg et al. 1989). However, it remains unclear whether sympathetically triggered lipolysis in WAT and BAT thermogenesis are associated or distinct processes.
The aims of this study were two-fold: (1) to characterize skeletal muscle and BAT energy metabolism during acute cold exposure and (2) to assess the relationship between BAT and skeletal muscle metabolic responses on total energy expenditure and assess the relationship between BAT metabolism and cold-induced activation of adipose tissue lipolysis in healthy men. More specifically, changes in thermogenesis from skeletal muscles and BAT as well as changes in whole-body fuel kinetics were assessed using a combination of sEMG, positron emission tomography (PET)/CT and isotopic methodologies in non-cold acclimatized men exposed to a 3 h mild cold exposure. Combined measurements of sEMG and PET/CT techniques not only provided measures of the activity of the large surface muscles but also that of deeper muscles not measured in previous investigations. We hypothesized (1) that both skeletal muscles and BAT would contribute to energy and particularly glucose metabolism during acute cold exposure and (2) that cold-induced whole-body lipolysis of WAT would be associated with BAT metabolic responses.
Methods
Ethical approval
Twelve healthy, non-cold acclimatized men aged 24 ± 1 years with a body mass index of 25.5 ± 0.8 kg m−2, body surface area of 2.01 ± 0.04 m2 and lean mass of 63.3 ± 3.3 kg were fully informed of the risks and methodologies applied and provided their written consent to participate in this study, in accordance with the Declaration of Helsinki. This study received ethics approval from the Human Ethics Committee of the Centre de Recherche du Centre hospitalier universitaire de Sherbrooke. None of the participants were diagnosed with diabetes, based on medical history, repeated assessment of fasting glucose concentration and 75 g oral glucose tolerance test. None were taking any medication, had any current medical condition known to affect lipid levels or insulin sensitivity, or had known cardiovascular or other medical conditions.
Experimental protocols
All subjects participated in metabolic protocols designed to assess whole-body and tissue-specific metabolic rate as well as glucose turnover during an acute cold exposure. The metabolic protocol consisted of a 120 min baseline period at ambient temperature (∼25°C) followed by 180 min of exposure to a mild cold, elicited using a liquid-conditioned suit (Three Piece, Allen-Vanguard, Ottawa, ON, Canada) perfused with water at 18°C using a temperature- and flow-controlled circulation bath (Endocal, NESLAB Model 200-00, Micropump, Vancouver, WA, USA). Experiments were conducted between 07.30 and 15.00 h, following a 12 h fast and 48 h without strenuous physical activity. Subjects were asked to follow a 2 day standard isocaloric diet based upon a 3 day food record, filled a validated questionnaire for physical activity (Sallis et al. 1985) and underwent portable arm band accelerometry for 7 days (St-Onge et al. 2007). Upon their arrival in the laboratory, subjects wearing only shorts were weighed and instrumented with autonomous wireless temperature sensors (Thermochron iButton model DS1922H; Maxim integrated, San Jose, CA, USA) placed on the forehead, chest, forearm, back of the hand, lower back and quadricep to measure mean skin temperature (Palmes ´ Park, 1947). sEMG electrodes (Delsys, EMG System, Natick, MA, USA) were placed on the belly of eight large muscles known to contribute significantly to shivering during cold exposure (Bell et al. 1992; Haman et al. 2004b, 2005): m. pectoralis major, m. deltoideus, m. trapezius, m. sternocleidomastoid, m. rectus abdominis, m. rectus femoris, m. vastus medialis and m. vastus lateralis. Participants were then fitted with the liquid-conditioned suit, swallowed a telemetric thermometry capsule to measure core temperature (Vital Sense monitor and Jonah temperature capsule, Mini Mitter Co., Inc., Bend, OR, USA) and performed a series of maximal voluntary contractions (MVCs) of each of the eight muscles being recorded by sEMG for normalization of the shivering measures. Indwelling catheters were then placed in an antecubital vein in both arms for blood sampling and tracer infusions. Participants were asked to empty their bladder and primed continuous infusions of [3-3H]-glucose to measure the plasma glucose rate of appearance (Ra,glucose) (3.3 × 10⁶ d.p.m. min−1 bolus + infusion at 0.33 × 10⁶ d.p.m. min−1) and of [U-13C]-palmitate to measure the plasma NEFA rate of appearance (Ra,NEFA) (0.01 μmol kg−1 min−1 infusion of [U-13C]-palmitate in 100 ml of 5% human serum albumin) were started (time = 0 min) (Carpentier et al. 2001, 2005, 2007; Ouellet et al. 2012). Only the sampling times 100, 110, 120 and 280, 290 and 300 min were used to calculate steady state Ra,glucose and Ra,NEFA. Whole body and muscle-specific shivering intensity and pattern as well as mean skin and core temperatures were measured continuously from time 90 to 300 min as previously described (Haman et al. 2004b). Only the mean of the final 30 min of the ambient period and final 120 min of the cold exposure are reported. Whole body oxygen consumption  and energy expenditure were determined by indirect respiratory calorimetry (Vmax 29n; Sensormedics, Milan, Italy) (Haman et al. 2002, 2004c; Carpentier et al. 2005) at room temperature and between times 180–200 and 280–300 min (i.e. 60–80 and 160–180 min after the beginning of cold exposure).
PET/CT protocol
Participants remained supine in a PET/CT scanner (Philips Gemini GXL; Philips, Eindhoven, The Netherlands) for 120 min at ambient temperature (∼25°C). BAT oxidative metabolism under ambient conditions was determined by first performing a CT scan (40 mA.s) centred at the cervico-thoracic junction to correct for attenuation and to define PET regions of interest (ROI). At time 90 min, a ∼185 MBq bolus of 11C-acetate was injected intravenously, and was followed by a 30 min list-mode dynamic PET acquisition. Following this ambient period, the liquid-conditioned suit was perfused with 18°C water for 180 min (between 120 and 300 min) while the participant remained supine in the PET/CT scanner. BAT oxidative metabolism during cold exposure was determined by first performing a CT scan (40 mA.s) centred at the cervico-thoracic junction to correct for attenuation and to define PET ROI. At time 210 min (i.e. 90 min after onset of cold exposure), a ∼185 MBq bolus of 11C-acetate was injected intravenously, and was followed by a 30 min list-mode dynamic PET acquisition. This was immediately followed by another regional CT scan (40 mA.s) and a ∼185 MBq i.v. bolus of 18F-fluorodeoxyglucose (18FDG) at time 240 min (i.e. 120 min after onset of cold exposure) followed by a 40 min list-mode dynamic PET acquisition. At time 300 min, a whole body CT scan (16 mA.s) and whole body static PET acquisition were performed to determine whole body 18FDG organ distribution and tissue standard uptake value (SUV).
PET/CT image analyses
ROI were first defined from the transaxial CT slices, then copied to 11C-acetate and then to 18FDG PET image sequences. For dynamic PET acquisitions, mean value of pixels (mean SUV) for each frame was recorded. ROI were drawn on the aortic arch for blood activity (input functions), the larger skeletal muscles in the field of view (e.g. m. sternocleidomastoid, m. longus colli, m. trapezius, m. pectoralis major, m. deltoideus), on posterior cervical subcutaneous adipose tissue and on supraclavicular BAT. For whole body scans, ROI were first defined from the transaxial CT slices and then co-registered to 18FDG image sequences. Mean values of pixels (mean SUV) of ROI were determined bilaterally for BAT, abdominal subcutaneous WAT (scWAT) and the following muscles: m. sternocleidomastoid, m. longus colli, m. trapezius, m. lattissimus dorsi, m. pectoralis major, m. deltoideus, m. biceps brachii, m. triceps brachii, m. brachioradialis, m. erector spinae, m. rectus abdominis, m. psoas major, m. adductor magnus, m. gluteus maximus, m. biceps femoris, m. rectus femoris, m. vastus medialis, m. vastus lateralis.
Laboratory assays
Glucose, insulin, total NEFAs and triglycerides were measured as previously described (Carpentier et al. 2005). Plasma cortisol, thyroid-stimulating hormone, free triiodothyronine and free thyroxine were measured using specific electrochemiluminescent immunoassays (Roche Diagnostics Systems GmbH, Mannheim, Germany). Individual plasma NEFAs (palmitate, linoleate, oleate) and [U-13C]-palmitate enrichment in plasma were measured by liquid chromatography-mass spectrometry (Carpentier et al. 2005).
Calculations
The volume of supraclavicular BAT was determined according to the following criteria: a tissue radio density between −30 and −150 Hounsfield units and 18FDG uptake during cold exposure of more than 1.5 SUV units (Blondin et al. 2014). Tissue-specific BAT oxidative metabolism index (the rapid fractional tissue clearance of 11C-acetate, k, in s–1) was estimated from BAT 11C activity over time using a monoexponential fit from the time of peak tissue activity (Buck et al. 1991). Total BAT oxidative metabolism index was calculated as the product of the total volume of supraclavicular BAT and BAT oxidative metabolism index (Blondin et al. 2014). To determine tissue glucose uptake, plasma and tissue time–radioactivity curves were analysed graphically using the Patlak linearization method (Menard et al. 2010), with the image-derived arterial input function taken from the aortic arch (Croteau et al. 2010). The slope of the plot in the graphical analysis is equal to the glucose fractional uptake (Ki in min−1). Net glucose uptake (Km) was then calculated by multiplying Ki by plasma glucose concentration, measured during the PET imaging protocol, which assumes a lump constant value of 1.0 compared with endogenous plasma glucose. Total glucose uptake was calculated by taking the product of tissue-specific Km and the volume of BAT or estimated volume of skeletal muscle. Total glucose uptake by skeletal muscle was estimated by taking the product of the mean Km of m. trapezius, m. pectoralis major, m. deltoideus, three muscles that provide an average representation of skeletal muscle glucose uptake, and the volume of skeletal muscle (estimated as 42% of body mass; Rolfe ´ Brown, 1997). Tissue-specific glucose clearance was calculated by dividing the total glucose uptake in BAT or skeletal muscle by the whole body glucose disappearance rate.
Shivering EMG signals were recorded from the following muscle groups: m. pectoralis major, m. deltoideus, m. trapezius, m. sternocleidomastoid, m. rectus abdominis, m. rectus femoris, m. vastus medialis and m. vastus lateralis. Raw EMG signals were collected at 1000 Hz, filtered to remove spectral components below 20 Hz and above 500 Hz as well as 60 Hz contamination and related harmonics, and analysed using custom-designed MATLAB algorithms (Mathworks, Natick, MA, USA). Shivering intensity of individual muscles was determined from root-mean-square (RMS) values calculated from raw EMG data. In brief, baseline RMS values (RMSbaseline: 5 min RMS average measured prior to cold exposure) were subtracted from shivering RMS (RMSshiv) values and RMS values obtained from the maximal voluntary contractions of individual muscles (RMSmvc). Shivering intensity was normalized to RMSmvc by using the following equation:
 |
1 |
Shivering intensity was determined by using a weighted mean of the shivering intensity of all eight muscles, as previously described (Haman et al. 2004a).
The muscles identified by PET/CT scanning were grouped into upper body (e.g. m. sternocleidomastoid, m. longus colli, m. trapezius, m. lattissimus dorsi, m. pectoralis major, m. deltoideus, m. biceps brachii, m. triceps brachii, m. brachioradialis, m. erector spinae, m. rectus abdominis) versus lower body (e.g. m. psoas major, m. adductor magnus, m. gluteus maximus, m. biceps femoris, m. rectus femoris, m. vastus medialis, m. vastus lateralis), peripheral (e.g. m. deltoideus, m. biceps brachii, m. triceps brachii, m. brachioradialis, m. gluteus maximus, m. biceps femoris, m. rectus femoris, m. vastus medialis, m. vastus lateralis) versus central (e.g. m. sternocleidomastoid, m. longus colli, m. trapezius, m. lattissimus dorsi, m. pectoralis major, m. erector spinae, m. rectus abdominis, m. psoas major, m. adductor magnus), and deep (e.g. m. longus colli, m. erector spinae, m. psoas major, m. adductor magnus) versus superficial (e.g. m. sternocleidomastoid, m. trapezius, m. lattissimus dorsi, m. pectoralis major, m. deltoideus, m. biceps brachii, m. triceps brachii, m. brachioradialis, m. rectus abdominis, m. gluteus maximus, m. biceps femoris, m. rectus femoris, m. vastus medialis, m. vastus lateralis). A weighted average of glucose partitioning (SUV) of the 18 skeletal muscles, which include deep muscles that are inaccessible using sEMG, was also used as a shivering metabolic index.
The plasma palmitate rate of appearance (Ra,palmitate) was calculated from the C16:0 M +16 enrichment of plasma palmitate from background and the tracer infusion rate (Carpentier et al. 2005):
| 2 |
where F is the C16:0 M + 16 infusion rate determined during each experiment and TTRpalmitate is the plasma palmitate C16:0 M +16 to C16:0 M +0 ratio during tracer infusion, corrected for background. The total Ra,NEFA was determined by multiplying the palmitate Ra by the ratio of concentration of plasma NEFAs to plasma palmitate level (Jensen et al. 1987).
Statistical analysis
Data are expressed as mean ± SEM. A paired t test was used to compare averaged steady-state mean values of all end points of interest between room temperature and cold exposure. ANOVA for repeated measures with Bonferroni post hoc test was used to compare glucose partitioning and shivering intensity between the different tissues or muscles. Spearman correlation was used to determine correlation between variables. A two-tailed P value of less than 0.05 was considered significant. All analyses were performed using SPSS for Windows (version 16.0; SPSS Inc., Chicago, IL, USA) or GraphPad Prism version 6.01 for Windows (GraphPad, San Diego, CA, USA).
Results
Whole body thermogenic and metabolic responses
Whole body thermal and metabolic responses are presented in Table1. During cold exposure, average skin temperature and core temperature decreased by 4.5 ± 0.3 and 0.4 ± 0.1°C, respectively, eliciting a 1.8-fold increase in energy expenditure (from 6.7 ± 0.3 kJ min−1 at room temperature to 12.2 ± 0.8 kJ min−1 during cold exposure). Plasma glucose, insulin, triglyceride and cortisol concentrations did not change during cold exposure, whereas NEFA levels increased by 1.5-fold (from 464 ± 46 μmol l−1 at room temperature to 687 ± 62 μmol l−1 in the cold). This was the result of a cold-induced increase in Ra,NEFA, which increased by 1.4-fold during cold exposure (868 ± 71 μmol min−1 in the cold versus 616 ± 60 μmol min−1 at room temperature).
Table 1.
Core and mean skin temperature, energy expenditure, circulating metabolites and hormones, and plasma glucose and NEFA appearance rates
| Room temperature | Cold exposure | P | |
|---|---|---|---|
| Mean skin temperature (°C) | 33.1 ± 0.3 | 28.6 ± 0.3 | 0.0001 |
| Core temperature (°C) | 36.5 ± 0.1 | 36.1 ± 0.1 | 0.001 |
| Energy expenditure (kJ min−1) | 6.7 ± 0.3 | 12.2 ± 0.8 | 0.0001 |
| Shivering intensity (% MVC) | — | 1.6 ± 0.3 | — |
| PET-determined Shivering metabolic index (mean SUV) | — | 0.8 ± 0.1 | — |
| Glucose (mmol l−1) | 4.4 ± 0.2 | 4.4 ± 0.2 | 0.71 |
| Ra,glucose (μmol min−1) | — | 1600 ± 235 | — |
| NEFA (μmol l−1) | 464 ± 46 | 687 ± 62 | 0.0001 |
| Ra,NEFA (μmol min−1) | 616 ± 60 | 868 ± 71 | 0.001 |
| Insulin (pmol l−1) | 65.1 ± 7.2 | 58.1 ± 4.8 | 0.15 |
| Triglycerides (mmol l−1) | 1.02 ± 0.23 | 1.03 ± 0.21 | 0.98 |
| Cortisol (nmol l−1) | 285 ± 22 | 284 ± 20 | 0.97 |
| Thyroid-stimulating hormone (IU l−1) | 1.95 ± 0.41 | 1.65 ± 0.29 | 0.06 |
| Free thyroxine (pmol l−1) | 16.7 ± 0.4 | 17.1 ± 0.4 | 0.02 |
| Free triiodothyronine (pmol l−1) | 5.7 ± 0.2 | 5.6 ± 0.2 | 0.21 |
Data are expressed as mean ± SEM for steady-state values during the last 30 min at each temperature (n = 12). % MVC, percentage of maximal voluntary contraction; Ra,glucose, glucose rate of appearance; Ra,NEFA, NEFA rate of appearance.
BAT thermogenic and metabolic responses
BAT oxidative index (11C-acetate k) increased 2.3-fold during cold exposure (from 0.005 ± 0.001 to 0.012 ± 0.002 s−1, Fig. 1A) which was paralleled by an increase in the radio density of BAT (from −103 ± 3 HU to −86 ± 5 HU, Fig. 1B). Mean BAT volume of activity was 57 ± 16 ml (Fig. 1C). Total BAT oxidative metabolism demonstrated a 2.1-fold increase upon cold exposure (from 0.35 ± 0.13 to 0.74 ± 0.19 ml of BAT·11C-acetate s−1; Fig. 1D). During cold exposure, glucose fractional uptake (Ki; Fig. 1E) and net uptake per volume of tissue (Km; Fig. 1F) were significantly greater in supraclavicular BAT compared to m. deltoideus, m. trapezius, and subcutaneous adipose tissue but not compared to the m. pectoralis major, m. sternocleidomastoid and m. longus colli. A strong association between glucose partitioning in BAT (SUV) and both the fractional and the net glucose uptake in BAT (Fig. 1G and H) suggests that assessment of glucose partitioning using SUV may be a reliable surrogate of quantitative glucose uptake in BAT. Radio density of BAT was strongly associated with the fractional and net BAT glucose uptake (Fig. 2A and B). Fractional and net BAT glucose uptake did not correlate with BAT oxidative metabolism (Fig. 2C and D). We found strong associations between the cold-induced increase in Ra,NEFA and BAT volume of activity (Fig. 3A), total BAT oxidative metabolism (Fig. 3B) and BAT total glucose uptake (Fig. 3C). However, no association was found between the increase in Ra,NEFA and cold-induced muscle metabolism (Fig. 3D–F).
Figure 1. BAT energy metabolism during acute cold exposure.
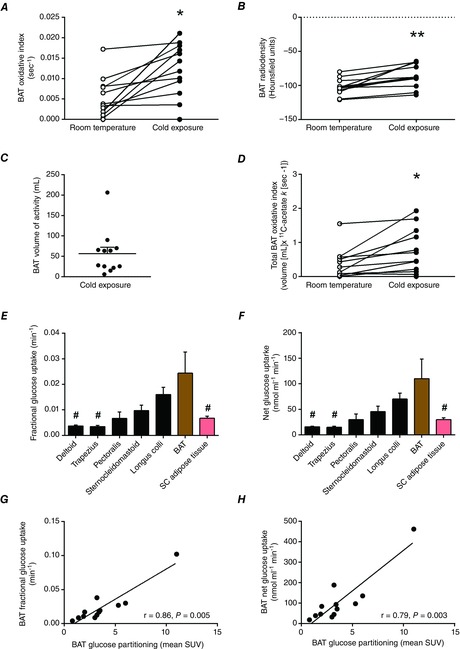
BAT monoexponential decay slope from peak 11C activity (BAT oxidative index, A), BAT radio density at room temperature and during cold exposure (B), BAT volume of activity during cold exposure (C), total BAT oxidative index at room temperature and during cold exposure (D), and fractional (E) and net glucose uptake in cervicothoracic tissues (F). G and H, the relationship between BAT glucose partitioning and fractional and net glucose uptake in BAT. Values presented as mean ± SEM (n = 12). Different from room temperature at *P ≤ 0.01, **P ≤ 0.001. Different from BAT at #P < 0.05.
Figure 2. BAT glucose metabolism during cold exposure.
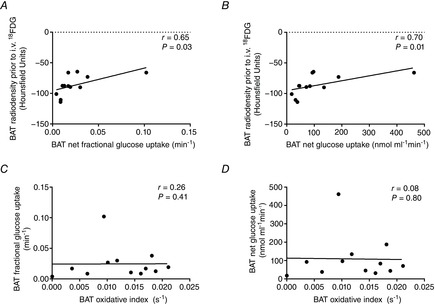
A and B, Spearman correlation between BAT radio density prior to intravenous (i.v.) injection of 18FDG and fractional (A) and net (B) BAT glucose uptake. C and D, Spearman correlation between BAT monoexponential decay slope from peak 11C activity (BAT oxidative index) and BAT fractional (C) and net (D) glucose uptake.
Figure 3. Sympathetic nervous system-mediated WAT lipolysis and BAT and skeletal muscle metabolism.
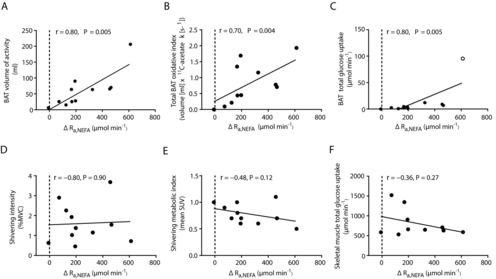
A–F, Spearman correlation between whole-body changes in Ra,NEFA (ΔRa,NEFA) and BAT volume of activity (A), change in total BAT oxidative metabolism index (B), BAT total glucose uptake (C), shivering intensity (D), PET-determined shivering index (E) and skeletal muscle total glucose uptake (F). With the exclusion of one outlier in C, indicated by an open circle, r = 0.73, P = 0.02.
Muscle shivering and metabolic responses
By design, whole body shivering intensity was minimized, reaching 1.6 ± 0.3% MVC (Table1). Muscle-dependent differences in shivering intensity, assessed by sEMG, were observed during cold exposure with m. pectoralis major showing greater shivering activity than m. rectus femoris, m. vastus lateralis, m. rectus abdominis, m. vastus medialis and m. deltoideus but not compared to m. trapezius and m. sternocleidomastoid (Fig. 4B). Of the eight muscles that were examined concomitantly by sEMG, glucose partitioning was significantly greater in m. pectoralis major relative to m. vastus lateralis, m. vastus medialis, m. rectus femoris, m. rectus abdominis, m. deltoideus and m. trapezius (P < 0.001), but not m. sternocleidomastoid (P = 0.76). We found a positive association between muscle shivering assessed by sEMG and total muscle glucose uptake (r = 0.60, P = 0.04, Fig. 4C). Glucose partitioning was significantly greater in centrally located muscles relative to peripheral muscles (P < 0.0001) and deep muscles compared to superficial muscle groups (P < 0.001), whereas no difference was seen between upper and lower body muscles (P = 0.19; Fig. 4D).
Figure 4. Bio-distribution of glucose and muscle shivering during cold exposure.
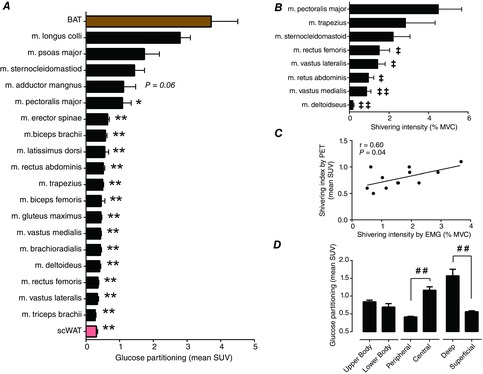
A and D, glucose partitioning in BAT, subcutaneous WAT (scWAT) and skeletal muscles during cold exposure. B, shivering intensity of m. pectoralis major, m. trapezius, m. sternocleidomastoid (n = 9), m. rectus femoris, m. vastus lateralis (n = 9), m. rectus abdominis, m. vastus medialis (n = 9) and m. deltoideus (n = 9), determined by sEMG. C, Spearman correlation between shivering intensity determined by surface EMG and a shivering index calculated using the relative uptake of 18FDG in skeletal muscles. Values are presented as mean ± SEM (n = 12, unless otherwise indicated). Different from BAT at *P ≤ 0.05, ** P ≤ 0.001; different from m. pectoralis major at ‡‡P ≤ 0.05, ‡P ≤ 0.001. Significant difference, ##P ≤ 0.001.
BAT versus muscle glucose uptake and relationship with whole body energy expenditure
Glucose partitioning varied considerably between different muscles and relative to BAT (P < 0.0001, between most muscles and BAT, Fig. 4A). However, glucose partitioning was not different between BAT and m. longus colli, m. psoas major and m. sternocleidomastoid (3.7 ± 0.7 vs. 2.8 ± 0.3, 1.7 ± 0.5 and 1.4 ± 0.3 mean SUV, respectively, P > 0.05). Total glucose uptake during cold exposure was 42-fold greater in skeletal muscle compared to BAT (674 ± 124 μmol min−1 in skeletal muscle vs. 12 ± 8 μmol min−1 in BAT) (Fig. 5A). This represented 47 ± 7% of glucose turnover occurring in muscle compared to 1 ± 1% in BAT (Fig. 5B).
Figure 5. BAT and skeletal muscle glucose uptake.
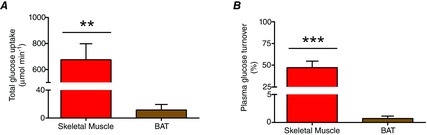
Total glucose uptake (A) and plasma glucose turnover (B) of skeletal muscle (red bar) and BAT (brown bar). Values presented as mean ± SEM (n = 12). Different from BAT at**P ≤ 0.001, ***P ≤ 0.0001.
No significant relationship was found between the cold-stimulated increase in energy expenditure and either shivering intensity (Fig. 6A; r = 0.36, P = 0.25), BAT volume of activity (r = 0.47, P = 0.12) or BAT total oxidative capacity (Fig. 6B; r = 0.01, P = 0.97). No significant relationship was found between shivering intensity and BAT volume of activity or BAT total oxidative metabolism (Fig. 5C and D).
Figure 6. BAT and skeletal muscle thermoregulatory interaction during cold exposure.
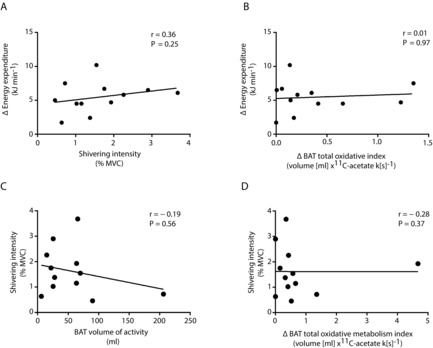
A and B, Spearman correlation between cold-induced change in energy expenditure (Δ energy expenditure) and shivering intensity (A) and cold-induced BAT total oxidative index (Δ BAT total oxidative index, B). C and D, Spearman correlation between shivering intensity and BAT volume of activity (C) and cold-induced BAT total oxidative capacity (D).
Discussion
The present study provides evidence that superficial and deep shivering muscles as well as BAT all contribute to energy metabolism in men exposed to mild cold, even under conditions designed to minimize the shivering response. It is important to note that although the level of recruitment of skeletal muscles and BAT varies amongst individuals, the amount of heat being produced remains a function of the cold stress applied, which was similar between participants. In addition, this mild cold stimulus also activated adipose tissue intracellular lipolysis, which was associated with BAT metabolic activity but not shivering activity. Although BAT glucose uptake per volume of tissue was important, BAT contributed marginally to systemic glucose clearance. The greatest contribution to glucose turnover during cold exposure was mediated by shivering skeletal muscles, particularly deep, centrally located muscle groups.
There have been a number of investigations in rodents demonstrating the effectiveness of BAT in regulating triglyceride clearance (Bartelt et al. 2011), glucose homeostasis and insulin sensitivity (Stanford et al. 2013) and energy balance by dissipating excess energy during cold exposure or excess feeding (Rothwell ´ Stock, 1979; Feldmann et al. 2009). However, the relevance of these metabolic regulatory functions in humans is controversial. Using a robust cooling protocol designed to clamp the skin temperature and consequent thermosensory input, we found that cold-induced thermogenesis was not independently associated with shivering intensity or BAT oxidative metabolism (Fig. 6A and B). This suggests that both processes could contribute to the whole body metabolic response to acute cold exposure. In some individuals, shivering skeletal muscle had a markedly greater contribution to heat production than BAT, for the same change in metabolic rate. While whole body shivering intensity, quantified using sEMG, was limited to ∼2% MVC in the present study, the shivering activity of individual muscles varied from 0.2 ± 0.1% MVC in the m. deltoideus to as high as 4.5 ± 1.2% MVC in the m. pectoralis major. This clearly indicates that shivering activity was present to varying degrees in different muscles with enormous differences in individual muscle contributions to the cold-induced increase in metabolic rate. Previous investigations have relied on qualitative methods such as visual inspection, self-reporting or experimenter-led inquiries (van Marken Lichtenbelt et al. 2009; Vijgen et al. 2011; Yoneshiro et al. 2011; Vijgen et al. 2012; Vosselman et al. 2012) as well as more quantitative approaches such as the muscle perfusion (Orava et al. 2011; Muzik et al. 2012, 2013; Orava et al. 2013) and glucose uptake (Orava et al. 2011, 2013) of a single muscle via 15O and 18FDG PET methods to determine muscle activity under similar thermal conditions. In many cases, by experimental design, overt shivering was considered absent or blunted. Indeed, if only sEMG or glucose partitioning results of m. deltoideus had been examined (Fig. 4A and B), the reference muscle commonly used (Orava et al. 2011, 2013; Muzik et al. 2012, 2013), we would have similarly concluded an absence of shivering activity or role of muscle in glucose clearance. This erroneous conclusion due to incomplete sampling of muscle activity was also reached by previous studies using sEMG (Meigal et al. 1996, 1998). Our results demonstrate that careful consideration should be taken in the selection of muscles when muscle activity is assessed at a single muscle to represent whole-body muscle metabolic response to cold. The shivering rhythmicity, intensity and pattern (i.e. burst versus continuous shivering or specific muscle recruitment) have all been suggested to be determined locally in the spinal cord (Perkins, 1945; Tanaka et al. 2006). The activation of shivering-promoting neurons in the reticulospinal tract, which in primates excites motoneurons primarily of proximal muscles and to a smaller extent distal muscles (Shapovalov, 1972; Davidson ´ Buford, 2004; Riddle et al. 2009), also suggests that proximal muscle groups may be preferentially recruited over distal muscle groups during shivering thermogenesis. Given the well documented contraction-stimulated glucose uptake in skeletal muscle (Glatz et al. 2010; Wasserman et al. 2011) and because 18FDG is retained in the cell in proportion to the glycolytic rate (Phelps, 2000; Sharp et al. 2012), a strong direct relationship between EMG-determined shivering intensity and the relative uptake of glucose was observed (Fig. 4C), suggesting that the latter could serve as a surrogate for EMG-determined muscle recruitment. As the glucose partitioning results demonstrate (Fig.6), the mild cold conditions in the present study resulted in the preferential recruitment of deep, centrally located muscles. This is consistent with recruitment patterns previous reported using sEMG (Bell et al. 1992) and indications from our previous BAT metabolism investigation (Ouellet et al. 2012), which showed that tissue oxidative and/or non-oxidative metabolism (acetate retention) were elevated in the m. longus colli compared to the m. trapezius and m. deltoideus. Combined, these findings demonstrate contribution of both BAT and shivering skeletal muscles to produce heat in the cold.
In addition to stimulating autonomic thermoregulatory responses, the sympathetic stimulation resulting from cold exposure also stimulates intracellular lipolysis of adipose tissues. The sympathetic β-adrenergic stimulation resulting from acute cold exposure not only initiates the hydrolysis of intracellular TGs in BAT, which serves as both the activator and the metabolic substrate fuelling BAT thermogenesis, but also initiates WAT lipolysis to fuel thermogenically active tissues. Consistent with our previous findings (Ouellet et al. 2012; Blondin et al. 2014), the cold-induced increase in BAT radio density in the present study indicates that BAT oxidative metabolism was indeed significantly supported by intracellular TG utilization. Here we show that under mild cold stress, whole body lipolytic activity increased 1.4-fold and was paralleled by a 2.1-fold increase in BAT oxidative metabolism. This sympathetically stimulated WAT lipolysis was strongly associated with the volume of metabolically active BAT and, most importantly, with its total oxidative metabolism. WAT lipolysis was, however, not associated with the shivering response. Rodent models have shown regional variations in the sympathetic drive of various adipose depots, which appears to be influenced by the lipolytic stimulus (Brito et al. 2008). Cold exposure elicited the greatest sympathetic drive and thus lipolytic activity, which seemed to be generalized across the various adipose depots (except dorsosubcutaneous WAT) but was most potent in BAT. Although regional differences in catecholamine-mediated WAT lipolysis and adrenoreceptor activity have been well documented in humans (Leibel ´ Hirsch, 1987; Mauriege et al. 1987, 1991; Wahrenberg et al. 1989), the relationship between sympathetically triggered lipolysis in WAT and BAT thermogenesis has never been investigated. The findings of the present study have important implications as they demonstrate that sympathetic nervous system-mediated WAT lipolysis and BAT thermogenesis are closely associated phenomena. Obese insulin-resistant individuals exhibit a blunted response to catecholamine-induced lipolysis in WAT (Reynisdottir et al. 1994; Horowitz et al. 1999; Jocken et al. 2008), which is associated with a reduction in cell surface β2-adrenergic receptor density (Reynisdottir et al. 1994). If such a catecholamine resistance was extended to BAT, this could explain the lower volume of metabolically active BAT (Vijgen et al. 2011) and BAT glucose uptake (Orava et al. 2013) reported in obese individuals. Furthermore, the consequence of a similar lipolytic dysfunction in brown adipocytes would require greater heat production from shivering skeletal muscles.
The requirement to produce heat during cold exposure leads to the channelling of circulating substrates towards metabolically active tissues to fuel thermogenesis. The findings from the present study show important thermoregulatory contributions of both BAT and shivering muscles. Consistent with previous findings in humans (Virtanen et al. 2009; Orava et al. 2011), BAT glucose uptake per volume of tissue was quite significant during a mild cold exposure, particularly when compared to any individual muscle. That BAT glucose uptake was limited to 12 ± 8 μmol min−1, accounting for 1±1% of plasma glucose turnover, and was inversely associated with BAT triglyceride content but not associated with BAT oxidative metabolism, indicates that uptake of circulating glucose by BAT is dependent upon intracellular TG content but not the tissue metabolic rate. This suggests that under short-term acute cold exposure, circulating glucose may indirectly fuel BAT thermogenesis through the replenishment of intracellular TG pools (i.e. de novo lipogenesis). More importantly, however, with BAT mass representing ∼1% of total body weight in adult humans compared to the estimated ∼42% represented by skeletal muscle (Rolfe ´ Brown, 1997) combined with the generalized muscle recruitment during shivering, the overall potential for skeletal muscle to clear circulating substrates during cold exposure via contraction-mediated pathways is significantly greater. Indeed, total glucose uptake was more than one order of magnitude greater in skeletal muscle compared to BAT in humans acutely exposed to the cold, representing ∼50% of systemic glucose turnover in muscles compared to 1% in BAT.
It is important to note that blood sampling and infusion sites may have effects on the measurement of glucose and fatty acid kinetics (Jensen, 1991; Wolfe ´ Chinkes, 2005). The practice of venous stable isotope infusion and arterialized venous blood sampling has been identified as the accepted infusion and sampling method when measuring glucose or NEFA kinetics (Jahoor et al. 1988; Wolfe ´ Chinkes, 2005). However, cold-induced vasoconstriction of the hand and forearm preclude the possibility of applying such a method in the current study. Consequently, antecubital vein blood sampling was used instead. The appearance rate of NEFAs by scWAT under ambient conditions has been shown to be greater in the forearm relative to whole body adipose tissue (Jensen, 1991), consequently resulting in the dilution of the NEFA tracer and thus an overestimation in NEFA appearance rates. However, NEFA and glucose kinetics in the forearm have never been investigated during cold exposure and it is unclear to what extent the insulative effect of scWAT and skeletal muscle of the forearm (Veicsteinas et al. 1982) might influence this tracer dilution effect. We acknowledge that the present NEFA appearance rates may still be overestimated, but further confirmation from cold exposure studies is required.
In summary, the present study demonstrates the contribution of BAT and shivering skeletal muscles to energy metabolism and clearing circulating NEFAs and glucose in adult humans exposed to a mild cold stimulus. The sympathetic stimulation from cold exposure resulted not only in the activation of thermoregulatory effectors, but also in the activation of adipose tissue intracellular lipolysis, which was closely associated with BAT oxidative metabolism. Even when minimized, muscle shivering could be a very significant mechanism of enhanced glucose metabolism during acute cold exposure whereas BAT seems to preferentially contribute to systemic NEFA clearance.
Acknowledgments
We would like to acknowledge the excellent technical assistance provided by Diane Lessard, Caroll-Lynn Thibodeau, Maude Gérard and Éric Lavallée. We also thank all the subjects who participated in this study.
Glossary
Abbreviations
- BAT
brown adipose tissue
- EMG
electromyography
- 18FDG
18F-fluorodeoxyglucose
- Ki
fractional uptake
- Km
net uptake
- MVC
maximal voluntary contraction
- NEFA
non-esterified fatty acid
- PET
positron emission tomography
- Ra
rate of appearance
- scWAT
subcutaneous white adipose tissue
- sEMG
surface electromyography
- SNS
sympathetic nervous system
- SUV
standard uptake value
- TG
triglyceride
- WAT
white adipose tissue
Additional information
Competing interests
All authors declare no conflict of interest regarding the content of the present manuscript.
Author contributions
Conception and design of the experiments: B.G., E.E.T., D.R., A.C.C. and F.H. Collection, analysis and interpretation of data: D.P.B., S.M.L., S.P., B.G., E.E.T., D.R., A.C.C. and F.H. Drafting the article or revising it critically for important intellectual content: D.P.B., S.M.L., S.P., B.G., E.E.T., D.R., A.C.C. and F.H.
Funding
This work was supported by a grant from the Canadian Diabetes association (OG-3-10-2970-AC) to A.C.C. and the Natural Sciences and Engineering Research Council of Canada (NSERC Canada) to F.H. and was performed at the Centre de recherche du Centre hospitalier universitaire de Sherbrooke, a research centre funded by the Fonds de la recherche du Québec – Santé (FRQS). D.P.B. is the recipient of the NSERC Postgraduate Scholarship. S.M.L. is the recipient of a CIHR Postdoctoral fellowship. D.R. is the recipient of the Research Chair on Obesity of Laval University. A.C.C. is the CIHR-GSK Chair in Diabetes.
References
- Bartelt A, Bruns OT, Reimer R, Hohenberg H, Ittrich H, Peldschus K, Kaul MG, Tromsdorf UI, Weller H, Waurisch C, Eychmuller A, Gordts PL, Rinninger F, Bruegelmann K, Freund B, Nielsen P, Merkel M. Heeren J. Brown adipose tissue activity controls triglyceride clearance. Nat Med. 2011;17:200–205. doi: 10.1038/nm.2297. [DOI] [PubMed] [Google Scholar]
- Bell DG, Tikuisis P. Jacobs I. Relative intensity of muscular contraction during shivering. J Appl Physiol. 1992;72:2336–2342. doi: 10.1152/jappl.1992.72.6.2336. [DOI] [PubMed] [Google Scholar]
- Blondin DP, Labbé SM, Tingelstad HC, Noll C, Kunach M, Phoenix S, Guérin B, Turcotte ÉE, Carpentier AC, Richard D. Haman F. Increased brown adipose tissue oxidative capacity in cold-acclimated humans. J Clin Endocrinol Metab. 2014;99:E438–E446. doi: 10.1210/jc.2013-3901. [DOI] [PMC free article] [PubMed] [Google Scholar]
- Brito NA, Brito MN. Bartness TJ. Differential sympathetic drive to adipose tissues after food deprivation, cold exposure or glucoprivation. Am J Physiol Regul Integr Comp Physiol. 2008;294:R1445–1452. doi: 10.1152/ajpregu.00068.2008. [DOI] [PubMed] [Google Scholar]
- Buck A, Wolpers HG, Hutchins GD, Savas V, Mangner TJ, Nguyen N. Schwaiger M. Effect of carbon-11-acetate recirculation on estimates of myocardial oxygen consumption by PET. J Nucl Med. 1991;32:1950–1957. [PubMed] [Google Scholar]
- Cannon B. Nedergaard J. Brown adipose tissue: function and physiological significance. Physiol Rev. 2004;84:277–359. doi: 10.1152/physrev.00015.2003. [DOI] [PubMed] [Google Scholar]
- Carpentier A, Patterson BW, Uffelman KD, Giacca A, Vranic M, Cattral MS. Lewis GF. The effect of systemic versus portal insulin delivery in pancreas transplantation on insulin action and VLDL metabolism. Diabetes. 2001;50:1402–1413. doi: 10.2337/diabetes.50.6.1402. [DOI] [PubMed] [Google Scholar]
- Carpentier AC, Frisch F, Brassard P, Lavoie F, Bourbonnais A, Cyr D, Giguere R. Baillargeon JP. Mechanism of insulin-stimulated clearance of plasma nonesterified fatty acids in humans. Am J Physiol Endocrinol Metab. 2007;292:E693–701. doi: 10.1152/ajpendo.00423.2006. [DOI] [PubMed] [Google Scholar]
- Carpentier AC, Frisch F, Cyr D, Genereux P, Patterson BW, Giguere R. Baillargeon JP. On the suppression of plasma nonesterified fatty acids by insulin during enhanced intravascular lipolysis in humans. Am J Physiol Endocrinol Metab. 2005;289:E849–856. doi: 10.1152/ajpendo.00073.2005. [DOI] [PubMed] [Google Scholar]
- Croteau E, Lavallée E, Labbe SM, Hubert L, Pifferi F, Rousseau JA, Cunnane SC, Carpentier AC, Lecomte R. Bénard F. Image-derived input function in dynamic human PET/CT: methodology and validation with 11C-acetate and 18F-fluorothioheptadecanoic acid in muscle and 18F-fluorodeoxyglucose in brain. Eur J Nucl Med Mol Imaging. 2010;37:1539–1550. doi: 10.1007/s00259-010-1443-z. [DOI] [PMC free article] [PubMed] [Google Scholar]
- Cypess AM, Chen YC, Sze C, Wang K, English J, Chan O, Holman AR, Tal I, Palmer MR, Kolodny GM. Kahn CR. Cold but not sympathomimetics activates human brown adipose tissue in vivo. Proc Natl Acad Sci USA. 2012;109:10001–10005. doi: 10.1073/pnas.1207911109. [DOI] [PMC free article] [PubMed] [Google Scholar]
- Davidson AG. Buford JA. Motor outputs from the primate reticular formation to shoulder muscles as revealed by stimulus-triggered averaging. J Neurophysiol. 2004;92:83–95. doi: 10.1152/jn.00083.2003. [DOI] [PMC free article] [PubMed] [Google Scholar]
- Feldmann HM, Golozoubova V, Cannon B. Nedergaard J. UCP1 ablation induces obesity and abolishes diet-induced thermogenesis in mice exempt from thermal stress by living at thermoneutrality. Cell Metab. 2009;9:203–209. doi: 10.1016/j.cmet.2008.12.014. [DOI] [PubMed] [Google Scholar]
- Glatz JFC, Luiken JFP. Bonen A. Membrane fatty acid transporters as regulators of lipid metabolism: implications for metabolic disease. Physiol Rev. 2010;90:367–417. doi: 10.1152/physrev.00003.2009. [DOI] [PubMed] [Google Scholar]
- Haman F, Legault SR, Rakobowchuk M, Ducharme MB. Weber J-M. Effects of carbohydrate availability on sustained shivering II: relating muscle recruitment to fuel selection. J Appl Physiol. 2004a;96:41–49. doi: 10.1152/japplphysiol.00428.2003. [DOI] [PubMed] [Google Scholar]
- Haman F, Legault SR. Weber J-M. Fuel selection during intense shivering in humans: EMG pattern reflects carbohydrate oxidation. J Physiol. 2004b;556:305–313. doi: 10.1113/jphysiol.2003.055152. [DOI] [PMC free article] [PubMed] [Google Scholar]
- Haman F, Péronnet F, Kenny GP, Doucet E, Massicotte D, Lavoie C. Weber J-M. Effects of carbohydrate availability on sustained shivering I: oxidation of plasma glucose, muscle glycogen and proteins. J Appl Physiol. 2004c;96:32–40. doi: 10.1152/japplphysiol.00427.2003. [DOI] [PubMed] [Google Scholar]
- Haman F, Péronnet F, Kenny GP, Massicotte D, Lavoie C, Scott C. Weber J-M. Effect of cold exposure on fuel utilization in humans: plasma glucose, muscle glycogen, and lipids. J Appl Physiol. 2002;93:77–84. doi: 10.1152/japplphysiol.00773.2001. [DOI] [PubMed] [Google Scholar]
- Haman F, Péronnet F, Kenny GP, Massicotte D, Lavoie C. Weber J-M. Partitioning oxidative fuels during cold exposure in humans: muscle glycogen becomes dominant as shivering intensifies. J Physiol. 2005;566:247–256. doi: 10.1113/jphysiol.2005.086272. [DOI] [PMC free article] [PubMed] [Google Scholar]
- Horowitz JF, Coppack SW, Paramore D, Cryer PE, Zhao G. Klein S. Effect of short-term fasting on lipid kinetics in lean and obese women. Am J Physiol. 1999;276:E278–284. doi: 10.1152/ajpendo.1999.276.2.E278. [DOI] [PubMed] [Google Scholar]
- Jahoor F, Klein S, Miyoshi H. Wolfe RR. Effect of isotope infusion and sampling sites on glucose kinetics during a euglycemic clamp. Am J Physiol. 1988;255:E871–874. doi: 10.1152/ajpendo.1988.255.6.E871. [DOI] [PubMed] [Google Scholar]
- Jensen MD. Regulation of forearm lipolysis in different types of obesity. In vivo evidence for adipocyte heterogeneity. J Clin Invest. 1991;87:187–193. doi: 10.1172/JCI114969. [DOI] [PMC free article] [PubMed] [Google Scholar]
- Jensen MD, Haymond MW, Gerich JE, Cryer PE. Miles JM. Lipolysis during fasting. Decreased suppression by insulin and increased stimulation by epinephrine. J Clin Invest. 1987;79:207–213. doi: 10.1172/JCI112785. [DOI] [PMC free article] [PubMed] [Google Scholar]
- Jocken JW, Goossens GH, van Hees AM, Frayn KN, van Baak M, Stegen J, Pakbiers MT, Saris WH. Blaak EE. Effect of beta-adrenergic stimulation on whole-body and abdominal subcutaneous adipose tissue lipolysis in lean and obese men. Diabetologia. 2008;51:320–327. doi: 10.1007/s00125-007-0866-y. [DOI] [PMC free article] [PubMed] [Google Scholar]
- Leibel RL. Hirsch J. Site- and sex-related differences in adrenoreceptor status of human adipose tissue. J Clin Endocrinol Metab. 1987;64:1205–1210. doi: 10.1210/jcem-64-6-1205. [DOI] [PubMed] [Google Scholar]
- Mauriege P, Despres JP, Prud’homme D, Pouliot MC, Marcotte M, Tremblay A. Bouchard C. Regional variation in adipose tissue lipolysis in lean and obese men. J Lipid Res. 1991;32:1625–1633. [PubMed] [Google Scholar]
- Mauriege P, Galitzky J, Berlan M. Lafontan M. Heterogeneous distribution of beta and alpha-2 adrenoceptor binding sites in human fat cells from various fat deposits: functional consequences. Eur J Clin Invest. 1987;17:156–165. doi: 10.1111/j.1365-2362.1987.tb02395.x. [DOI] [PubMed] [Google Scholar]
- Meigal AY, Lupandin YV. Hanninen O. Head and body positions affect thermoregulatory tonus in deltoid muscles. J Appl Physiol. 1996;80:1397–1400. doi: 10.1152/jappl.1996.80.4.1397. [DOI] [PubMed] [Google Scholar]
- Meigal AY, Oksa J, Hohtola E, Lupandin YV. Rintamaki H. Influence of cold shivering on fine motor control in the upper limb. Acta Physiol Scand. 1998;163:41–47. doi: 10.1046/j.1365-201x.1998.00333.x. [DOI] [PubMed] [Google Scholar]
- Menard SL, Croteau E, Sarrhini O, Gelinas R, Brassard P, Ouellet R, Bentourkia M, van Lier JE, Des Rosiers C, Lecomte R. Carpentier AC. Abnormal in vivo myocardial energy substrate uptake in diet-induced type 2 diabetic cardiomyopathy in rats. Am J Physiol Endocrinol Metab. 2010;298:E1049–1057. doi: 10.1152/ajpendo.00560.2009. [DOI] [PubMed] [Google Scholar]
- Muzik O, Mangner TJ. Granneman JG. Assessment of oxidative metabolism in brown fat using PET imaging. Front Endocrinol. 2012;3:15. doi: 10.3389/fendo.2012.00015. [DOI] [PMC free article] [PubMed] [Google Scholar]
- Muzik O, Mangner TJ, Leonard WR, Kumar A, Janisse J. Granneman JG. 15O PET measurement of blood flow and oxygen consumption in cold-activated human brown fat. J Nucl Med. 2013;54:523–531. doi: 10.2967/jnumed.112.111336. [DOI] [PMC free article] [PubMed] [Google Scholar]
- Orava J, Nuutila P, Lidell ME, Oikonen V, Noponen T, Viljanen T, Scheinin M, Taittonen M, Niemi T, Enerback S. Virtanen KA. Different metabolic responses of human brown adipose tissue to activation by cold and insulin. Cell Metab. 2011;14:272–279. doi: 10.1016/j.cmet.2011.06.012. [DOI] [PubMed] [Google Scholar]
- Orava J, Nuutila P, Noponen T, Parkkola R, Viljanen T, Enerbäck S, Rissanen A, Pietiläinen KH. Virtanen KA. Blunted metabolic responses to cold and insulin stimulation in brown adipose tissue of obese humans. Obesity. 2013;21:2279–2287. doi: 10.1002/oby.20456. [DOI] [PubMed] [Google Scholar]
- Ouellet V, Labbe SM, Blondin DP, Phoenix S, Guerin B, Haman F, Turcotte EE, Richard D. Carpentier AC. Brown adipose tissue oxidative metabolism contributes to energy expenditure during acute cold exposure in humans. J Clin invest. 2012;122:545–552. doi: 10.1172/JCI60433. [DOI] [PMC free article] [PubMed] [Google Scholar]
- Palmes ED. Park CR. Thermocouples for the measurement of the surface temperature of the skin. Fed Proc. 1947;6:175. [PubMed] [Google Scholar]
- Perkins JF., Jr The role of the proprioceptors in shivering. Am J Physiol. 1945;145:264–271. doi: 10.1152/ajplegacy.1945.145.2.264. [DOI] [PubMed] [Google Scholar]
- Phelps ME. Positron emission tomography provides molecular imaging of biological processes. Proc Natl Acad Sci USA. 2000;97:9226–9233. doi: 10.1073/pnas.97.16.9226. [DOI] [PMC free article] [PubMed] [Google Scholar]
- Reynisdottir S, Ellerfeldt K, Wahrenberg H, Lithell H. Arner P. Multiple lipolysis defects in the insulin resistance (metabolic) syndrome. J Clin Invest. 1994;93:2590–2599. doi: 10.1172/JCI117271. [DOI] [PMC free article] [PubMed] [Google Scholar]
- Riddle CN, Edgley SA. Baker SN. Direct and indirect connections with upper limb motoneurons from the primate reticulospinal tract. J Neurosci. 2009;29:4993–4999. doi: 10.1523/JNEUROSCI.3720-08.2009. [DOI] [PMC free article] [PubMed] [Google Scholar]
- Rolfe DFS. Brown GC. Cellular energy utilization and molecular origin of standard metabolic rate in mammals. Physiol Rev. 1997;77:731–758. doi: 10.1152/physrev.1997.77.3.731. [DOI] [PubMed] [Google Scholar]
- Rothwell NJ. Stock MJ. A role for brown adipose tissue in diet-induced thermogenesis. Nature. 1979;281:31–35. doi: 10.1038/281031a0. [DOI] [PubMed] [Google Scholar]
- Sallis JF, Haskell WL, Wood PD, Fortmann SP, Rogers T, Blair SN. Paffenbarger RSJ. Physical activity assessment methodology in the Five-City Project. Am J Epidemiol. 1985;121:91–106. doi: 10.1093/oxfordjournals.aje.a113987. [DOI] [PubMed] [Google Scholar]
- Shapovalov AI. Extrapyramidal monosynaptic and disynaptic control of mammalian alpha-motoneurons. Brain Res. 1972;40:105–115. doi: 10.1016/0006-8993(72)90114-x. [DOI] [PubMed] [Google Scholar]
- Sharp LZ, Shinoda K, Ohno H, Scheel DW, Tomoda E, Ruiz L, Hu H, Wang L, Pavlova Z, Gilsanz V. Kajimura S. Human BAT possesses molecular signatures that resemble beige/brite cells. PLoS One. 2012;7:e49452. doi: 10.1371/journal.pone.0049452. [DOI] [PMC free article] [PubMed] [Google Scholar]
- St-Onge M, Mignault D, Allison DB. Rabasa-Lhoret R. Evaluation of a portable device to measure daily energy expenditure in free-living adults. Am J Clin Nutr. 2007;85:742–749. doi: 10.1093/ajcn/85.3.742. [DOI] [PubMed] [Google Scholar]
- Stanford KI, Middelbeek RJ, Townsend KL, An D, Nygaard EB, Hitchcox KM, Markan KR, Nakano K, Hirshman MF, Tseng YH. Goodyear LJ. Brown adipose tissue regulates glucose homeostasis and insulin sensitivity. J Clin invest. 2013;123:215–223. doi: 10.1172/JCI62308. [DOI] [PMC free article] [PubMed] [Google Scholar]
- Tanaka M, Owens NC, Nagashima K, Kanosue K. McAllen RM. Reflex activation of rat fusimotor neurons by body surface cooling, and its dependence on the medullary raphe. J Physiol. 2006;572:569–583. doi: 10.1113/jphysiol.2005.102400. [DOI] [PMC free article] [PubMed] [Google Scholar]
- van der Lans AA, Hoeks J, Brans B, Vijgen GH, Visser MG, Vosselman MJ, Hansen J, Jorgensen JA, Wu J, Mottaghy FM, Schrauwen P. van Marken Lichtenbelt WD. Cold acclimation recruits human brown fat and increases nonshivering thermogenesis. J Clin Invest. 2013;123:3395–3403. doi: 10.1172/JCI68993. [DOI] [PMC free article] [PubMed] [Google Scholar]
- van Marken Lichtenbelt WD, Vanhommerig JW, Smulders NM, Drossaerts JM, Kemerink GJ, Bouvy ND, Schrauwen P. Teule GJ. Cold-activated brown adipose tissue in health men. N Engl J Med. 2009;360:1500–1508. doi: 10.1056/NEJMoa0808718. [DOI] [PubMed] [Google Scholar]
- Veicsteinas A, Ferretti G. Rennie DW. Superficial shell insulation in resting and exercising men in cold water. J Appl Physiol. 1982;52:1557–1564. doi: 10.1152/jappl.1982.52.6.1557. [DOI] [PubMed] [Google Scholar]
- Vijgen GH, Bouvy ND, Teule GJ, Brans B, Hoeks J, Schrauwen P. van Marken Lichtenbelt WD. Increase in brown adipose tissue activity after weight loss in morbidly obese subjects. J Clin Endocrinol Metab. 2012;97:E1229–1233. doi: 10.1210/jc.2012-1289. [DOI] [PubMed] [Google Scholar]
- Vijgen GH, Bouvy ND, Teule GJ, Brans B, Schrauwen P. van Marken Lichtenbelt WD. Brown adipose tissue in morbidly obese subjects. PLoS One. 2011;6:e17247. doi: 10.1371/journal.pone.0017247. [DOI] [PMC free article] [PubMed] [Google Scholar]
- Virtanen KA, Lidell ME, Orava J, Heglind M, Westergren R, Niemi T, Taittonen M, Laine J, Savisto NJ, Enerbäck S. Nuutila P. Functional brown adipose tissue in healthy adults. N Engl J Med. 2009;360:1518–1525. doi: 10.1056/NEJMoa0808949. [DOI] [PubMed] [Google Scholar]
- Vosselman MJ, van der Lans AA, Brans B, Wierts R, van Baak MA, Schrauwen P. van Marken Lichtenbelt WD. Systemic β-adrenergic stimulation of thermogenesis is not accompanied by brown adipose tissue activity in humans. Diabetes. 2012;61:3106–3113. doi: 10.2337/db12-0288. [DOI] [PMC free article] [PubMed] [Google Scholar]
- Wahrenberg H, Lonnqvist F. Arner P. Mechanisms underlying regional differences in lipolysis in human adipose tissue. J Clin Invest. 1989;84:458–467. doi: 10.1172/JCI114187. [DOI] [PMC free article] [PubMed] [Google Scholar]
- Wasserman DH, Kang L, Ayala JE, Fueger PT. Lee-Young RS. The physiological regulation of glucose flux into muscle in vivo. J Exp Biol. 2011;214:254–262. doi: 10.1242/jeb.048041. [DOI] [PMC free article] [PubMed] [Google Scholar]
- Wolfe RR. Chinkes DL. Isotope Tracers in Metabolic Research: Principles and Practice of Kinetic Analysis. Hoboken, NJ: Wiley-Liss; 2005. [Google Scholar]
- Yoneshiro T, Aita S, Matsushita M, Kameya T, Nakada K, Kawai Y. Saito M. Brown adipose tissue, whole-body energy expenditure, and thermogenesis in healthy adult men. Obesity (Silver Spring) 2011;19:13–16. doi: 10.1038/oby.2010.105. [DOI] [PubMed] [Google Scholar]