Abstract
Structural magnetic resonance imaging (MRI) provides anatomical information about the brain in healthy as well as in diseased conditions. On the other hand, functional MRI (fMRI) provides information on the brain activity during performance of a specific task. Analysis of fMRI data requires the registration of the data to a reference brain template in order to identify the activated brain regions. Brain templates also find application in other neuroimaging modalities, such as diffusion tensor imaging and multi-voxel spectroscopy. Further, there are certain differences (e.g., brain shape and size) in the brains of populations of different origin and during diseased conditions like in Alzheimer’s disease (AD), population and disease-specific brain templates may be considered crucial for accurate registration and subsequent analysis of fMRI as well as other neuroimaging data. This manuscript provides a comprehensive review of the history, construction and application of brain atlases. A chronological outline of the development of brain template design, starting from the Talairach and Tournoux atlas to the Chinese brain template (to date), along with their respective detailed construction protocols provides the backdrop to this manuscript. The manuscript also provides the automated workflow-based protocol for designing a population-specific brain atlas from structural MRI data using LONI Pipeline graphical workflow environment. We conclude by discussing the scope of brain templates as a research tool and their application in various neuroimaging modalities.
Keywords: Alzheimer’s disease, brain atlas, method for brain template design, MRI, population-specific brain template
INTRODUCTION
A brain template is a specific anatomical presentation of the brain depicting finer anatomical details (e.g., nuclei, cortical areas) [1]. Digital brain templates, or atlases, generated either from a single-subject or from multiple subjects, have begun to replace the conventional printed brain template (e.g., Talairach and Tournoux atlas) [2, 3]. The more advanced brain templates using multiple subjects have higher signal-to-noise ratio, provide better contrast between grey matter and white matter [4], and quantify typical variations within the study cohort or the population of interest.
This article provides a comprehensive review of the nine most commonly used brain templates from the Talairach and Tournoux atlas to the Chinese brain template, describes the rationale behind the atlas construction protocols, and provides examples of specific computational neuroscientific studies. The article falls under the following headings: (i) a detailed review of available brain templates; (ii) steps involved and the rationale in creating a new population-specific brain template using LONI pipeline [5–7]; (iii) brain atlas applications in various imaging modalities; and (iv) clinical application.
BRAIN ATLASING AND BIOMARKERS
Neuroimaging atlases were initially intended to provide transformation framework for aligning 2D slices (e.g., cryotomographic, immunohistochemical) or transforming a 3D data (e.g., low resolution CT, CAT, SPECT, positron emission tomography (PET) volumes) to a higher-resolution common space like the one used in MRI magnetic resonance imaging (MRI). These transformations from one space (subject) to an atlas space provide localization of structural, functional, and physiological data into a well-understood template space.
NEED FOR POPULATION-SPECIFIC BRAIN TEMPLATES
Overall brain features (e.g., brain volume, shape, and size) vary across different populations due to phenotypic, genetic, developmental, and environmental factors [8]. Therefore, population-specific brain templates that capture, quantify, and visualize the varying brain anatomy are required for many structural, functional, and physiological studies to provide finer details which leads to better interpretation [9]. This concept can be extended further to create disease-specific brain templates, in conditions like Alzheimer’s disease (AD), which may aid in crucial neuroimaging data analysis.
REVIEW OF EXISTING HUMAN BRAIN TEMPLATES
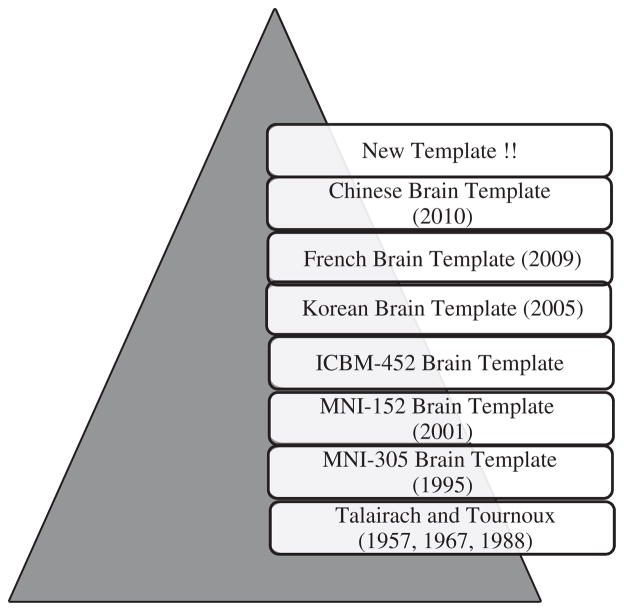
There are nine most commonly used brain templates which are depicted in Fig. 1 and the characteristic features of each brain template is presented in Table 1.
Fig. 1.
Existing human brain templates presented in chronological order. The first Talairach atlas was reported in 1957. In 1988, it was constructed from the postmortem brain of a 60 year old French woman. The MNI-305 brain template was constructed in 1995 from the average of 305 three dimensional MRI brain images (mean age = 23.4 ± 4.1 years). The MNI-152 brain template was constructed in 2001 using brain MRI images from 152 normal subjects. The ICBM-452 brain template was created in 2003. The Korean brain template was created in 2005 from 78 healthy (normal) Korean subjects (mean age 44.6 ± 19.4 years). The French brain template (constructed from a 45 year old Frenchman) was reported in 2009, and the Chinese brain template was created in 2010 using 56 young Chinese subjects (mean age 24.49 ± 1.76 years). New brain templates refer to template from Indian subcontinent and African continent etc.
Table 1.
Different characteristic features (e.g., number of subjects, registration procedure involved, type of spatial transformation used, coverage area, cortical detail etc.) used to construct the existing human brain templates
| Feature | Talairach Tournoiix(TT) (1988) |
MNI-305 (1995) |
Colin-27 (1998) |
MM-152 (2001) |
ICBM-452 (2003) |
Korean (2005) |
French (2009) |
Chinese-56 (2010) |
|---|---|---|---|---|---|---|---|---|
| No. of subjects | 1 F-l |
305 M-239, F-66 |
1 M-l |
152 NA |
452 NA |
78 M-49, F-29 |
1 M-1 |
56 M-56 |
| Age (years) | 60 | 23.4 ± 4.1 | NA | NA | NA | 44.6 ± 19.4 | 45 | 24.49 ± 1.76 |
| Image type | 2D | 3D | 3D | 3D | 3D | 3D | 3D | 3D |
| Population specific | No | Yes | No | Yes | Yes | Yes | Yes | Yes |
| Type of atlas | Non-digital | Digital | Digital | Digital | Digital | Digital | Digital | Digital |
| Registration procedure | Manual (Intra-subject) | Linear (Inter-subject) | Linear & non-Linear (Intra-subject) | Linear & non-Linear (Inter-subject) | Linear & non-Linear (Inter-subject) | Linear & non-Linear (Inter-subject) | Linear & non-Linear (Inter-subject) | Linear & non-Linear (Inter-subject) |
| Spatial transformation | NA | 9-parameter Linear | Affine | 9-parameter Affine | 12-parameter Affine | Affine | Affine | 12-parameter Affine |
| Coverage | Excludes brain stem & cerebellum | Does not fully cover top of head & cerebellum | Full head & cerebellum | Full head & cerebellum | Full head & cerebellum | Full head & cerebellum | Deep brain regions | Full head & cerebellum |
| Cortical detail information | Lack of cortical detail | Lack of cortical detail | Improved cortical details | Lack of cortical detail | Improved cortical detail | Improved cortical detail | Improved cortical detail | Improved cortical detail |
| Contrast between gray and white matter | Less Significant | Significant | Significant | Significant | Significant | Significant | Significant | Significant |
| Size (Length, width & height of brain) | Smaller than other brain templates | Larger than Talairach Tournoux | Same as MNI-305 | Same as MNI-305 | Same as MNI-305 | Height is shorter than IT and MNI-305 but width is same | Voxel size reduced | Length and height are shorter than MNI-152 but width is more |
Talairach and Tournoux atlas
The first stereotactic atlas of grey nuclei was published by Talairach and coworkers in the year 1957 [10], followed by a second atlas in 1967 [11]. Talairach and Tournoux then constructed the third human brain atlas (in printed form) in 1988 from the single postmortem brain of a 60 year old French woman [12]. This atlas has become one of the standard reference systems in human brain mapping [13]. It introduced a coordinate system to identify and label different brain regions (Fig. 2) which was based on two reference landmarks, the anterior commissure (AC) as its origin and the posterior commissure (PC) [14, 15]. The x-axis was defined by the line passing through the AC point and perpendicular to the AC-PC line, y-axis was defined by the line connecting the most superior point of the AC and the most inferior point of the PC. In this coordinate system, z-axis was defined by the line on a vertical plane (horizontal plane defined by the x-axis and y-axis) passing through the inter-hemispheric fissure and the AC point [14]. Talairach and Tournoux also introduced a spatial transformation to match a general brain image to their brain atlas [13].
Fig. 2.
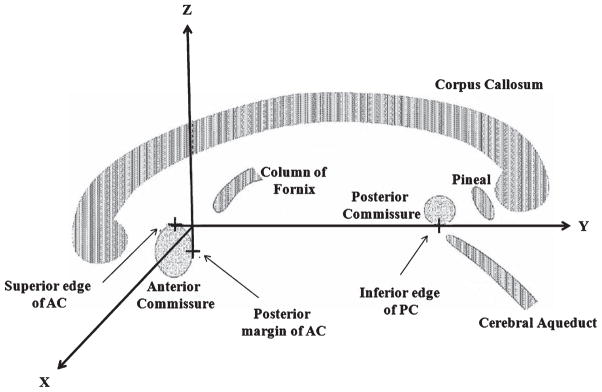
Coordinate system introduced by Talairach and Tournoux. The anterior commissure (AC) and posterior commissure (PC) are the landmarks used for developing this standard reference coordinate system. Its origin was defined at the AC, with x-and y-axis defining the horizontal plane and z-axis defining the vertical axis. The original figure [15] is slightly modified and reproduced with permission.
Although the Talairach and Tournoux atlas provides accurate descriptions of areas around the origin (AC) of the coordinate system (e.g., the basal ganglia, pituitary gland, and thalamus), it has certain drawbacks [3]. The brain used by Talairach and Tournoux was relatively smaller [16]. Furthermore, this atlas was created from a single subject (postmortem brain). The slice thickness was also very large (2–5 mm), and almost fifteen slices were left unaccounted for while creating the atlas [8, 17, 18]. This generated wide gaps in the atlas and hence, did not reflect the complete neuro-anatomical features. The anatomical locations can only be identified by comparing the Talairach and Tournoux brain atlas with the Brodmann map. Furthermore, the anatomical mapping from 3D MRI images to this version of Talairach and Tournoux atlas is not possible, as no 3D image of the original brain was used in its construction [3]. Hence, primary application of this template is limited to two dimensional (2D) analyses. Another drawback associated with the earlier version of the Talairach and Tornoux atlas is that the anterior tip of the temporal lobe is 1 cm anterior to the AC plane. It has to be noted that in moderately demented AD patients, it is 1 cm posterior to the AC plane [19–21].
MNI-305
In 1995, the Montreal Neurological Institute (MNI) created a new standard population-specific brain template, MNI-305, to address the limitations of the Talairach and Tournoux atlas. The MNI-305 brain template was generated by averaging 3D brain MRI images (n = 305 right-handed subjects, M = 239, F = 66 having average age of 23.4 ± 4.1 years) [22, 23]. The construction procedure involved two stages. In the first stage, 3D brain MRI images of 250 subjects were taken, and each image was registered manually to the Talairach and Tournoux brain atlas [23]. The two reference landmarks, the AC and the PC, were defined manually to identify the AC-PC line and the edges of the brain. Each input brain MRI image was scaled to match the manually defined landmarks (AC and PC) to the equivalent positions on the Talairach and Tournoux atlas [23]. These scaled images were then averaged to construct the MNI-250 brain template [23]. The second stage consisted of taking another set of 3D brain images of 55 normal subjects, and registering each brain image to the MNI-250 brain template using automatic linear registration [24]. These 55 automatically registered brain MRI images and manually registered 250 brain images were then averaged together to create the MNI-305 brain template.
Although the MNI-305 brain template is based on the Talairach and Tournoux brain atlas, there are some significant differences between the two. The MNI-305 brain template is comparatively larger than the Talairach and Tournoux brain template [16, 25]. Also, for creating the MNI-305 brain template, brains were not scanned to cover the top of head and the cerebellum and consequently lacked cortical details. Furthermore, the accuracy of MNI-305 brain template is constrained by the limiting resolution of the input brain MRI images [26].
Colin-27
In 1998, a high-resolution MRI brain template, Colin-27, was constructed by acquiring twenty-seven high-resolution (seven images at 0.78 mm3 and twenty images at 1.0 mm3) T1-weighted 3D brain images from a single subject [26]. The brain images were then automatically registered to a common stereotactic space in which they were sub-sampled and image intensities were averaged. Due to availability of high-resolution brain images, the Colin-27 brain template provides finer anatomical details. Due to its excellent contrast and signal-to-noise ratio, this brain template is being used as a target for regional spatial normalization in many laboratories [26].
In 2001, a French research group used Collin-27 brain template to develop a tool for automated anatomical labeling of activated areas in the brain [27]. The aim was to establish the relationships between brain structures and their functions, and to minimize the anatomical and functional variability between subjects.
MNI-152
The International Consortium for Brain Mapping (ICBM) adopted MNI-152 as their standard template [25, 28]. It is included in different functional imaging analysis packages, including the statistical parametric mapping package (SPM), and the expanded FMRIB Software Library (FSL) [9, 29]. MNI-152 template was created in 2001 from 3D brain MRI images of 152 normal subjects [30]. In MNI-152 brain template, Talairach and Tournoux coordinate system was selected as the reference coordinate space.
To construct the MNI-152 brain template, automated image registration (AIR) algorithms were used to align brain MRI images with the reference brain image (target image). The brain MRI images were linearly registered to the target image (using a 9-parameter affine transformation) followed by a non-linear registration to overcome the inter-subject anatomical differences in shape, size, and relative orientation [25, 28]. The advantage of MNI-152 brain template is that it provides a full head coverage and also provides more detailed information from the top portion of the brain to the bottom portion of the cerebellum [16]. However, MNI-152 template lacks cortical details.
ICBM-452
The ICBM-452 brain template was created in 2003, by averaging T1-weighted brain MRI images of 452 normal young subjects in a coordinate space which was defined using the average position, orientation, scale, and shear of all individual subjects [31]. Two versions of ICBM-452 brain template were defined, namely, the air-12 and the warp-5. The air-12 version of ICBM-452 brain template was constructed by linearly transforming all brain MRI images from 452 subjects to the MNI-305 brain template space using a 12-parameter affine transformation and subsequently taking the average of all the transformed brain images [31]. On the other hand, the warp-5 version of ICBM-452 was created using AIR to perform linear affine transformation followed by a fifth-order polynomial non-linear warping. The warp-5 version of the ICBM-452 brain template provides more cortical details due to more accurate alignment compared to the air-12 version of ICBM-452 [31].
Korean brain template
The Korean brain template was constructed in 2005 using MRI and PET images of 78 normal right-handed Korean subjects (49 males and 29 females) with age ranging from 18 to 77 years (mean age = 44.6 ± 19.4 years) [17]. The MRI and PET brain images of these subjects were spatially normalized to the target brains using linear transformations. The brain templates corresponding to the young and elderly were created by subdividing the subjects into two groups for each gender, the young/midlife group (<55 years-old; 35 males and 13 females) and the elderly group (>55 years-old; 14 males, 16 females) [17].
In this template design process, the overall length (anterior commissure margin to posterior commissure margin), height (inter commissural margin to superior cortical margin), and width (left cortical margin to right cortical margin) of the standard Korean brains were calculated. The anterior-posterior length and height of the Korean standard brain template were lower compared to the MNI-152 and Talairach and Tournoux brain atlas. However, the left-right widths of Korean brain templates were found to be equivalent to those of the MNI-152 brain template and the Talairach and Tournoux brain atlas [17]. For the standard Korean male brain template, length was 10% lesser, height was 9% shorter, and width was 1% greater compared to the MNI-152 brain template. However, in the case of standard Korean female brain template, length was 10% lesser, height was 4% shorter, but the width was equal when compared to the Talairach and Tournoux brain atlas.
These differences between Korean brain template and other brain templates (e.g., MNI-152 brain template and the Talairach and Tournoux atlas) reflect the differences in shape and size of the brains of Koreans and Caucasians [17], emphasizing the need for population-specific templates.
French brain template
In 2009, a French brain template was constructed by averaging fifteen T1-weighted brain MRI images acquired using multiple scans from a 45 year old French male. Subsequently, a T2-weighted template was constructed by averaging seven brain MRI images from the same subject [32]. One T1-weighted native image was randomly chosen as the target image. Subsequently, all T1 and T2 weighted images acquired were linearly registered to the target image [32]. In this brain template, the voxel size was significantly reduced to 0.25 mm3, after sub-sampling the resulting averaged volumes using a cubic B-spline algorithm, which helped to observe fine brain structures as well as white matter/grey matter intensity crossings [32].
Chinese brain template
The Chinese brain template was constructed from high-quality brain MRI images acquired from 56 right-handed Chinese male subjects (mean age = 24.46 ± 1.81 years) [8]. The acquired brain MRI images were then registered linearly to the selected target image (to account for global deformations), followed by non-linear registration (to account for local deformations). The target image was selected randomly from the 56 brain MRI images, and all the images were linearly registered using a 12-parameter affine transformation. The non-linear registration of the linearly aligned MRI images was performed using fifth order polynomial transformation. The registered images were then averaged to construct the brain template [8].
The Chinese brain template [8] is relatively shorter in both length and height, but greater in width in comparison to the MNI-152 brain template. In addition, brain features such as brain shape, size, and the length of AC-PC line were significantly different from the MNI-152 brain template. This once again validates the need for population-specific brain templates for different populations [8].
STEPS FOR DESIGNING A NEW POPULATION SPECIFIC BRAIN TEMPLATE
Acquisition of MRI data in different brain template design processes
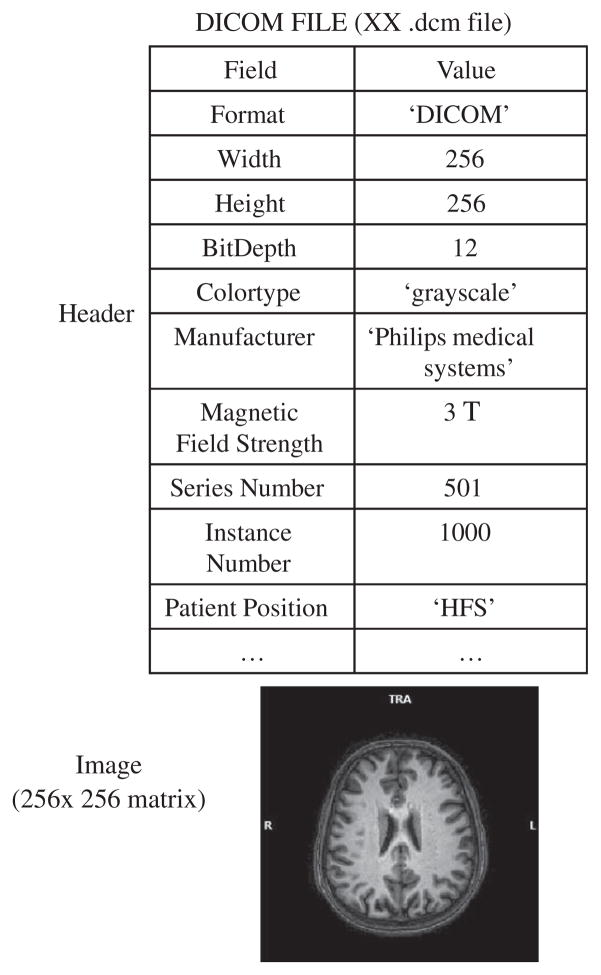
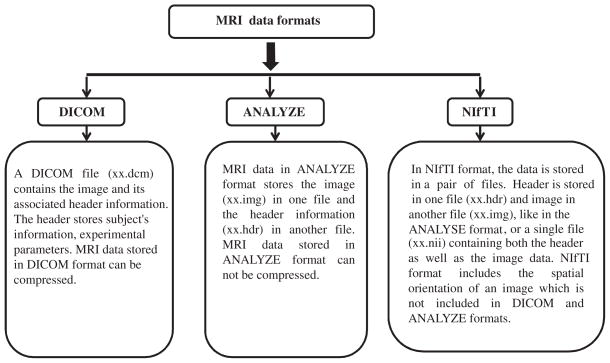
High quality MRI images are very important for the generation of brain templates. Table 2 presents the detailed specifications (e.g., slice thickness, flip angle, echo time, repetition time, inversion time, field of view, acquisition matrix, and voxel size) used for acquiring MRI data for the above-mentioned brain templates. Brain MRI images are generally acquired in vendor-specific formats but usually it is saved in Digital Imaging and Communications in Medicine (DICOM) format [33]. The general internal structure of DICOM file is provided in Fig. 3. Other formats (e.g., ANALYZE [34], Neuroimaging Informatics Technology Initiative (NIfTI) [35], etc.) are also used for brain MRI image storage. Figure 4 illustrates the salient features of different brain MRI image formats.
Table 2.
Experimental parameters used to acquire brain MRI images for the construction of existing human brain templates
| Template | MRI scanner | Slicing | Slice thickness | TE/TR/TI (ms) | Flip angle (°) | Field of view | Acquisition matrix | Voxel size |
|---|---|---|---|---|---|---|---|---|
| Chinese French |
3.0 Tesla GE | Axial | 1.40 mm | 2.88/6.68/4.50 | 25° | 24×24 cm2 | 512×512×248 | 0.47×0.47×0.70 mm3 |
| (T1-weighted) | 3.0 Tesla Philips | Sagittal | 1 mm | 4.6/9.8/915 | 8° | 256 mm | 256×256 | 0.5×0.5×1 mm3 |
| (T2-weighted) | 3.0 Tesla Philips | Coronal | 1 mm | 80/3035/NA | 90° | 256 mm | 256×256 | 1×1×1 mm3 |
| Korean | 1.5 Tesla GE | Sagittal | 1.5 mm | 5.5/14.4/NA | 20° | 24×24 cm2 | 256×256 | NA |
| MNI-305 | 1.9 Tesla GE | Sagittal | NA | 6/24/NA | 25° | 256×256 mm2 | 256×256×124 | 0.98×0.98×1.20 mm3 |
| MNI-305 | 1.5 Tesla Philips | NA | 2 mm | 30/400/NA | NA | NA | 256×256×160 | 0.67×0.86×0.75 mm3 |
Fig. 3.
General representation of brain MRI data in DICOM format. It consists of header which contains information relating to the subject and experimental parameters; and the corresponding image data.
Fig. 4.
Structure of different MRI data formats (e.g., DICOM, ANALYZE, and NIfTI).
Steps involved in brain template design
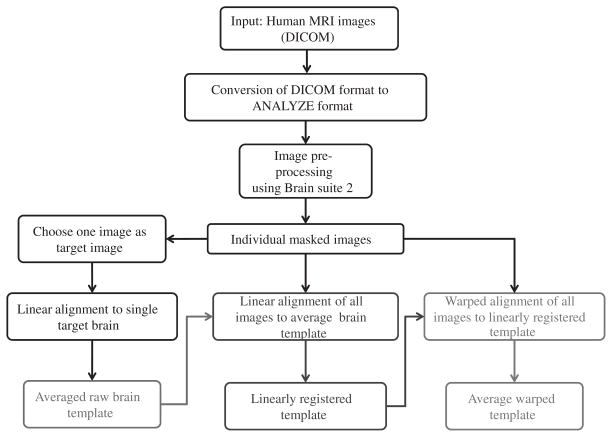
The steps involved in the design of a population-specific brain template, using LONI pipeline, are depicted in Fig. 5 [8, 36]. The complete pipeline workflow is also available online for community testing and validation via the LONI Pipeline Web-Start interface (http://pipeline.loni.ucla.edu/PWS, http://ucla.in/qECrrp). The LONI pipeline processing environment is a visual programming interface consisting of various modules (e.g., AIR [37, 38], BrainSuite [39], FSL [40]) [5–7]. The desired work-flow for the design of a brain template can be created by adding the required modules to the pipeline. At first, the high resolution structural brain MRI images are acquired in DICOM format. These images are then converted to ANALYZE format. The next image pre-processing steps include skull stripping, by selecting/masking the desired brain region, followed by reorientation of the brain MRI images [41, 42].
Fig. 5.
General flowchart for the construction of population-specific brain template using LONI pipeline [8, 36]. At first, brain MRI images of the subjects of a population acquired in the DICOM format are converted to ANALYZE image format. Image pre-processing steps include the skull stripping and reorientation of the brain MRI images. The construction protocol includes mainly three steps: The averaged raw brain template is constructed first (red block will be in red color), to which each individual brain MRI image is linearly registered (to account for global shape and intensity differences) to get an averaged linear brain template (the color of green block would be in green color). This is followed by a non-linear registration (to account for local deformations) of each individual brain MRI images to the averaged linear brain template to get averaged non-linear brain template (Blue block will be in blue color).
The skull-stripped brain MRI images are processed in three steps: (i) the averaged raw brain template is constructed first by selecting an image as a target image [8]. The target image can be selected in three different ways. First, it can be done by subjective, objective, or random selection of the best brain image. Second, a target image can be selected from the standard human brain template database (e.g., MNI-152, ICBM-452, etc.) Third, a target image can be chosen as the one which has the best match after linear alignment with a standard human brain template (MNI-152 or ICBM-452).
The linear registration between the target image and skull-stripped images is performed separately for each image. These registered images are then averaged to create the averaged raw brain template. (ii) Second, an average linear brain template is constructed by averaging all the skull stripped images after linear registration of each image to the average raw brain template. (iii) Finally, an averaged non-linear brain template is constructed by averaging all the skull stripped images after non-linear registration of each image to the average linear brain template.
Automatic image registration
The AIR module in the LONI pipeline is commonly used to register human brain MRI images [36, 43–49]. The construction of human brain template involves linear (global) transformation (Ti, linear (x, y, z)) followed by non-linear (local) transformation (Ti, non-linear(x, y, z)) [30]. The global transformation is accomplished by an affine transformation to address overall (global) differences in the brain MRI images. On the other hand, the local transformation allows more detailed deformation of the brain MRI images and is accomplished by non-linear alignment techniques [30, 48].
Affine transformation
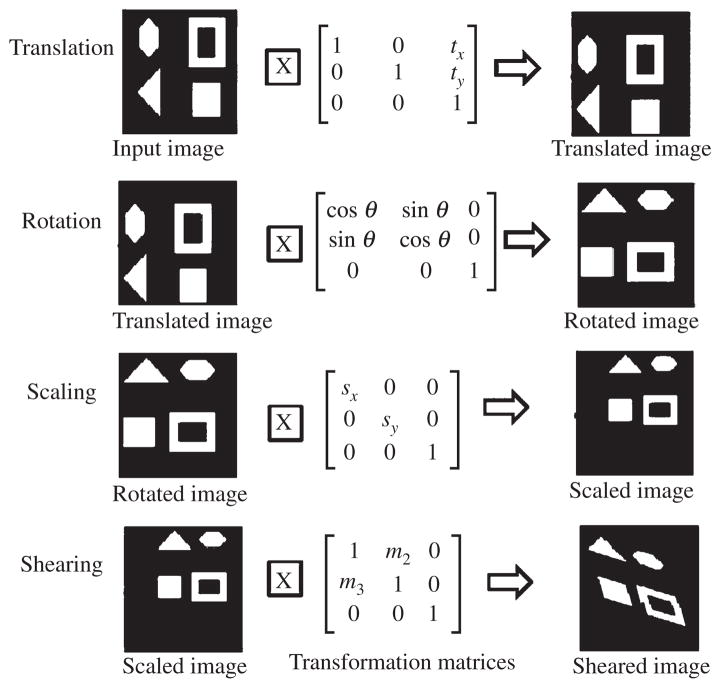
An affine transformation is a linear geometric transformation that involves translation, rotation, scaling, and shearing as depicted in Fig. 6 [43, 50]. This operation requires alignment of the source image to the target image to retain certain geometric features (parallel lines remain parallel but size and orientation may change) [50]. An affine transformation of a 3D coordinate (Ti, linear (x, y, z)) in the source image to a new 3D coordinate (Ti, linear (x, y, z) [43] in the transformed source image (linearly registered image) is accomplished using a transformation matrix as shown in Equation-1.
Fig. 6.
Effects of affine transformation consisting of translation, rotation, scaling, and shearing operation are elaborated. This linear transformation is required to align the source images to the target image. This Figure is revised, modified from earlier work [118] and presented here.
| (1) |
Here, m14, m24, and m34 are the translation parameters in x-, y-, and z-directions, respectively. The remaining 3 × 3 matrix ([mij]; i, j = 1, 2, 3) represents the rotation, scaling, and shearing parameters. Figure 7 illustrates an example of an affine transformation on a 2D image. The number of parameters required in transformation matrix depends upon the type of images used (e.g., registering fMRI images requires 6-parameter affine transformation, whereas MRI images requires up to 12-parameter affine transformation) [50, 51].
Fig. 7.
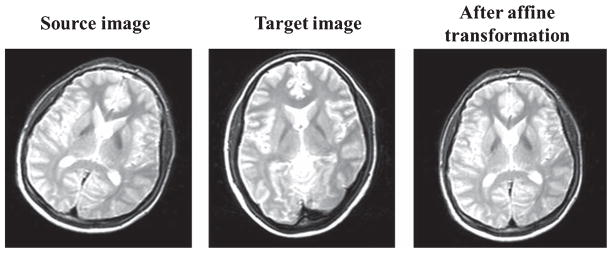
Illustration of affine transformation on a 2D MRI image [51].
Non-linear alignment
The objective of non-linear alignment is to warp the source brain MRI images, using a high dimensional warping transform, such that the homologous regions are aligned accurately to the corresponding regions in the target image [43–45, 52–54].
The non-linear alignment of brain MRI images can be performed using spline-based deformations [55–57], including thin plate splines [48, 55] and B-splines [55, 58]; and physical model-based deformations, including elastic deformations [55, 59, 60] and fluid deformations [37, 48, 54, 55, 61]. Neuroimaging studies, using different brain warping techniques, have found increased rates of hippocampal volume loss and different patterns of hippocampal shape change, during early dementia of Alzheimer type as compared to normal aging [62]. This signifies the importance of non-linear registration, for alignment of source and target images, in diseases such as AD and other dementias. To make an assessment, the AD patient group has to be compared with the normal control group. Hence, analysis of normal control group becomes crucial and the use of the population-specific template is appropriate to capture better local information.
Refinement of the registration
The reliability of the designed brain template depends on the accuracy of the image registration performed during brain template design process [30].
For most registration methods, diffeomorphic warping aside [63], deriving separate displacement vector fields for registering θ:A→B and Ψ:B→A, would generate a distinct resliced volume: À = Ψ(θ(A)). In other words, the displacement vector fields (Ψ, θ) are not inverses of each other. At the same time, even diffeomorphic normalization transformations [64], where the identity I(·) = Ψ (θ(·)), do not guarantee exactly the same intensities of the original (A) and resliced (À) volumes. This is due to the computational error in interpolation of the resliced intensities and smoothing that may be intentionally imposed while generating a visually appealing spatially normalized (resliced) result. Certain characteristic metrics can be used to determine the accuracy of registration and they are as provided below.
Wavelet based metrics to evaluate non-linear registration
The wavelet-based metrics can be used to evaluate the non-linear registration quantitatively [65]. This method uses a concise representation of the native and re-sliced (pre- and post-warp) data in compressed wavelet space to assess quality of registration. Three different approaches can be used to evaluate the performance of non-linear registration in compressed wavelet space and they are as follows: 1) Triangle Scheme (Δ) for Warp Classification; 2) Cluster Group Classification (CGC); and 3) Spread Group Classification (SGC). The step-by-step process for quantitative assessment of volumetric image registration according to the wavelet-based approach is as follows:
Compute the wavelet transform of all data volumes, their warped-resliced representations, and the target data.
Apply wavelet shrinkage technique to the wavelet transformed data to obtain the compressed data.
Evaluate the desired warp rankings (triangle Δ, CGC, SGC) according to the pre-defined relations [65].
Smaller values of triangle and CGC, and larger values of SGC are indicative of appropriate image registration [65].
Voxel-based similarity metrics
Voxel-based similarity metrics depend on the differences in the voxel intensities from corresponding locations in the target (T) and transformed source (S) brain MRI images [66]. There are two voxel-based measures (namely cross-correlation and sum of squared differences).
Cross-correlation
The cross-correlation method evaluates the correlation between the target brain image (T) and the registered image (S) (transformed source brain MRI image). The transformation parameters are applied on source images to maximize the correlation between the target image and the source images [66]. The cross-correlation coefficient (CC) between the target image and the transformed source image is the sum of the product of the respective image intensities and is given by Equation-2:
| (2) |
where iT(x) and iS(x) denotes the intensity at voxel location (x) in the target image and the transformed source image respectively. Figure 8 illustrates an example of transformed source 2D image after non-rigid registration using cubic B-splines with cross-correlation coefficient as the similarity measure used. This measure assumes a linear relationship between intensities of the target and source images and is sensitive to differences in brightness and contrast of target and source images [55].
Fig. 8.
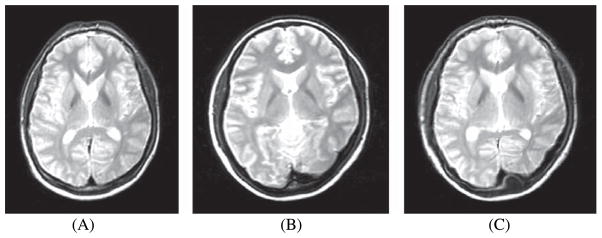
A) Transformed source image; B) Target image; C) After application of cubic B-splines using CC as the similarity measure on the transformed source image [119]. Source code (https://sites.google.com/site/myronenko/research/mirt) was used to convert the images.
To overcome this limitation, the normalized cross-correlation can be used. The normalized correlation coefficient (NCC) between the target image (T) and transformed source image (S) can be expressed by the Equation 3 [48, 55]:
| (3) |
where, and represent mean intensity of the target image (T) and the transformed source image (S), respectively. The value of NCC ranges from zero to one. Low value of NCC implies improper alignment of the images and for the perfect alignment of images; NCC value is one. Thus, a transformation is estimated in such a way that it maximizes the NCC. Figure 9 illustrates the application of NCC on a transformed 2D source image.
Fig. 9.
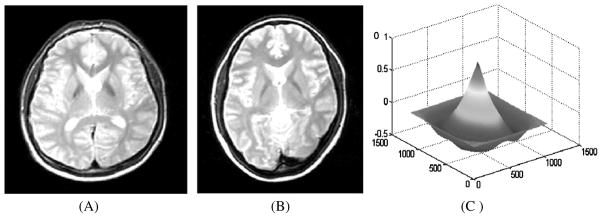
A) Transformed source image; B) Target image; C) Normalized cross-correlation (NCC) between the transformed source image and target image displayed as a surface plot. The peak of the cross-correlation matrix occurs when the images are best correlated [55].
Sum of squared differences
The sum of squares of intensity difference (SSD) is calculated by taking the summation of all the squared differences of the intensity values in the target (T) and transformed source (S) images [55]. It is represented by the following Equation:
| (4) |
The value of SSD will be zero when the images are perfectly aligned and will increase in case of improper alignment. The main limitation of voxel-based similarity metrics is that it can be applied only for single modality images [48, 55].
Due to the presence of non-uniform intensities in brain MRI images, the corresponding regions in different images may not have the same voxel intensities [67]. This limits the application of voxel-based metrics to estimate the reliability of the registration. This problem was addressed using entropy-based similarity metrics. Figure 10 illustrates an example of non-rigid registration performed on the transformed source image using cubic B-splines with SSD as the similarity measure.
Fig. 10.
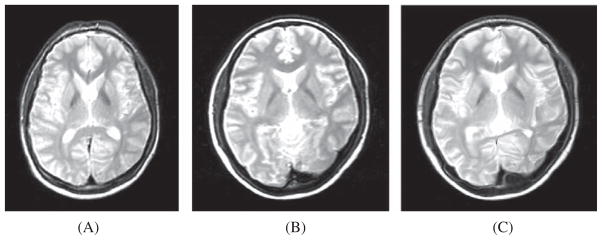
A) Transformed source image; B) Target image; C) The transformed source image after non-rigid registration using cubic B-splines with SSD as the similarity measure used [119]. Source code (https://sites.google.com/site/myronenko/research/mirt) was used to convert those images.
Entropy based metrics
To check the reliability of the designed brain template, there are three entropy-based metrics: joint entropy, mutual information, and, normalized mutual information.
Joint entropy
The joint entropy H(T,S) of the target (T) and transformed source (S) images, having intensities iT(x) ∈ T and iS(x) ∈ S respectively, is represented by the following Equation [67]:
| (5) |
where, p(iT, iS) represents the joint probability density function of the target (T) and transformed source (S) images. Figure 11 illustrates schematically the relation between the partial and joint entropies for a pair of images.
Fig. 11.
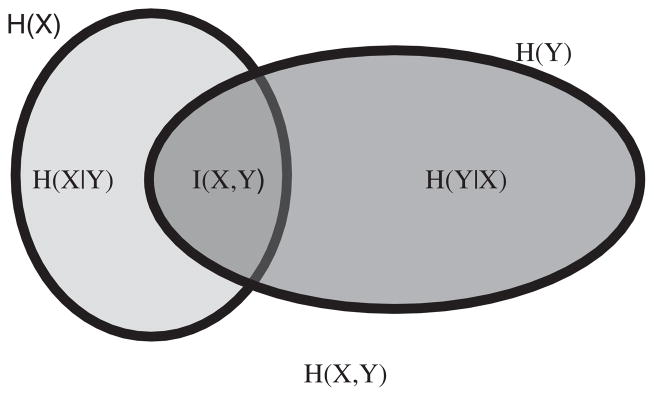
Illustration for the relations between individual (H(X), H(Y)), joint (H(X, Y) and conditional entropies for a pair of correlated images X and Y with mutual information I(X, Y) [68].
A low value of the joint entropy indicates a better alignment of the images. A detailed explanation regarding the minimization of entropy H(T, S) can be found in the literature [68]. The limitation of using joint entropy is that lower values of joint entropy can also be obtained with poor alignment (for example, when the background of the images is aligned, instead of the homologous anatomical features).
Mutual information based method
Mutual information (MI) content between the target and transformed source images is an alternative error metric to check the reliability of the designed brain template with better performance by considering individual entropies of the target and source images along with their joint entropy [68]. The target and source images are registered to maximize the mutual information between the images [47].
A joint probability distribution technique can be used to estimate the mutual information between the images [47]. The joint probability distribution is estimated by plotting a joint histogram of the target and transformed source images [47]. When two images are in proper alignment, the resulting histogram will be a diagonal line indicating very tight clusters. On the other hand, improper alignment of the images will result in a dispersed histogram [47].
Based on the reliability results from the above-mentioned procedure, the registration results can be improved by maximizing the mutual information of the source and the target images. The mutual information I(T, S) of the target (T) and transformed source (S) images can be obtained from their respective marginal entropies H(T), H(S) and their joint entropy H(T, S) by the following equation [47, 68]:
| (6) |
The marginal entropies can be calculated using Shan-non definition:
| (7) |
| (8) |
where, p(iT) and p(iS) stands for marginal probability distributions of voxels with intensities iT and iS occurring in the target (T) and transformed source (S) images, respectively. Thus Equation-6 is modified to:
| (9) |
where, p(iT, iS) denotes the joint probability density function (PDF) of the target (T) and source (S) images. The mutual information I(T, S) of the target (T) and transformed source (S) images is high when the images are properly aligned [69]. To maximize the mutual information I(T, S), the joint entropy H(T, S) needs to be minimized [68]. Figure 12 illustrates an example of refining the registration on the transformed source image using MI as the similarity measure.
Fig. 12.
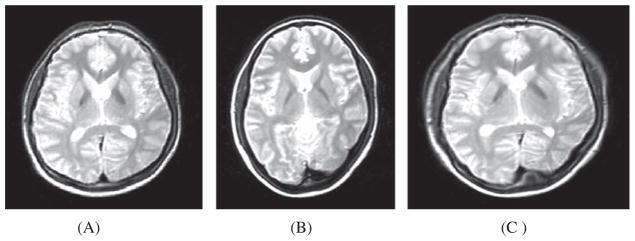
A) Transformed source image; B) Target image; (C) Transformed source image after non-rigid registration of the transformed source image and the target image using cubic B-spline, with MI as the similarity measure used Source code (https://sites.google.com/site/myronenko/research/mirt).
Normalized mutual information
Mutual information metric is less sensitive to overlap error (only background is aligned and not the anatomical structures), compared to the joint entropy metric, due to the addition of the marginal entropies of both images. But, sometimes inefficient overlap may also lead to an increase in mutual information. To overcome this overlap problem, another entropy based measure called normalized mutual information (NMI) [70] can be used and is given by the following equation:
| (10) |
where H(T) and H(S) represents the marginal entropies of the target and the transformed source images and H(T, S) represents the joint entropy of the two images. The images are registered such that the normalized mutual information between the images is maximized or the joint entropy is minimized [71].
Overlap based metrics
The accuracy of registration can be evaluated by comparing the corresponding regions in the target image and the transformed source image [72]. This comparison can be done using three quantifying overlap measures, i.e., target overlap, mean overlap, and union overlap. Target overlap (TO) is the ratio of the intersection between the corresponding regions (r) in target (T) and transformed source (S) images, to the volume of the region in target (T) image and can be computed by taking summation over a set of multiple labeled regions and is shown in Equation 11 [72]:
| (11) |
where, Tr is the set of voxels in the region r in the target image, Sr is the set of voxels in the region r in the transformed source image and ∩ indicates volumetric intersection.
TO ranges from zero (when source and target images have no common regions to align) to one (when source and target images are in complete overlap). Mean overlap (MO) is the ratio of the intersection between two similarly labeled regions (r) of target and transformed source images to the mean volume of the two regions summed over multiple labeled regions [72]:
| (12) |
MO is also known as Dice coefficient.
The third overlap measure, union overlap (UO) is the ratio of the intersection between two similarly labeled regions (r) in target (T) and source (S) images to their union and can be expressed as:
| (13) |
UO ranges from 0 (when two images have no common regions to align) to 1 (when two images are properly aligned). There are two error measures to check the incorrectly labeled measures: false-positive (FP) and false-negative (FN) errors [72]. An FN error for a given region is the ratio of the volume of the target region outside the corresponding source region to the volume of the target region, i.e.,
| (14) |
where, Tr\Sr indicates the set of elements (voxels) in Tr but not in Sr. An FP error for a given region is calculated as the ratio of the volume of a source region outside the corresponding target region to the volume of the source region as follows:
| (15) |
where, Sr\Tr indicates the set of elements in Sr but not in Tr. The false-negative error and false-positive error can range from zero (indicative of perfect overlap) to one (indicative of poor overlap). Figure 13 illustrates the concept of false positive, true positive, false negative, and true negative through a Venn diagram.
Fig. 13.
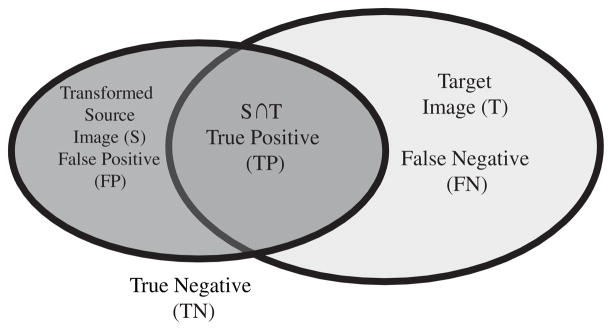
Illustration of false positive, true positive, false negative, and true negative through the Venn diagram [74].
Accuracy of spatial overlap of two images from Dice coefficients/mean overlap
The Dice coefficient [73] can be used as a performance measure to access the extent of spatial overlap between two brain MRI images (target image (T) and transformed source image (S)). It is commonly used in reporting performance of image registration and is defined as the ratio of the intersection between two similarly labeled regions (r) of target and transformed source images to the mean volume of the two regions:
The value of Dice coefficient range between 0 (when two images have no common regions to align) to 1 (when images are perfectly aligned). Dice coefficient has been frequently used for evaluating the quality of image analysis [74, 76–78].
The above methods are used to estimate the accuracy of image registration as well as the reliability of a designed brain template. Furthermore, visual inspection may be performed by a domain expert to estimate the registration accuracy [48, 79].
APPLICATION: DIFFERENT IMAGING MODALITIES
Due to a number of intrinsic and extrinsic factors, the result of different neuroimaging analyses and statistical maps may sometimes be difficult to interpret, validate, or reproduce. Intrinsic factors include the significant intra-and inter-subject variability, presence of noise during acquisition, and variations in study designs between research groups, scanner type, sample sizes and sampling protocols. Extrinsic factors include the mapping technique, statistical methodologies, and computational tools used [6]. However, the creation of a population-specific template may reduce the inter-subject variability to reflect the brain structures from the same population. These population-specific brain templates have immense application in various types of neuroimage analysis. Several examples of powerful atlas-based neuroimaging studies are summarized below:
Voxel Based Morphometry (VBM)
VBM involves voxel-wise comparison of the local concentration of gray matter between groups of subjects. Spatial normalization in VBM is accomplished by transforming all the subjects’ data into same stereo-tactic space (an atlas or a standard brain template) [80]. In this case, a population-specific template is very much essential and required as differences in the standard template may affect the final results.
fMRI data analysis
The selection of brain template has an effect on the result of fMRI data analysis. An initial step in fMRI data analysis involves spatial normalization where individual subject images are registered to a common spatial co-ordinate space which is commonly the MNI co-ordinate space. This normalization also uses information from the structural data. It is observed that the size, shape, and position of brain structures are anatomically not uniform and show significant differences according to the age, gender, race, and clinical conditions [81, 82]. To overcome this situation, researchers have attempted analysis based on specific region of interest [83–87]. The study-specific template was initially proposed for voxel-based morphometric method and it was observed that the results were enhanced when study-specific template (SST) was used for analyses [88, 89]. Such SSTs were generated by averaging all the images after normalizing each of them to the MNI-T1 weighted template. A recent study indicated that most small-world parameters are sensitive to the selection of parcellation atlases. These differences arise also due to variations in the processes and different sample sizes used in preparing the atlases [90]. It is also observed that the structural anatomical landmarks were offset or inconsistent with estimated locations of corresponding functional activity [82]. Such offsets could change the statistics significantly leading to misinterpretation when studying the spatial patterns of brain activity. A population-specific template may help to overcome the above-mentioned issues as it reflects the anatomical information from that particular population.
Tensor-Based Morphometry (TBM)
TBM creates maps of brain volume and shape differences from sequential MRI scans, which aid in understanding the growth/atrophy rates of brain tissues [91]. In TBM, the images undergo non-rigid registration to a common reference space. The statistical analysis is commonly performed by computing the determinant of the Jacobian matrix of the deformation field (which is obtained as a result of registration) [92]. The common TBM analysis protocol involves first selecting the reference image as one of the initial subject image [93, 94], a standard template, or a study-specific minimum distance template generated for the particular study [92, 95–97]. These registrations are not perfect and different template or reference image may influence the results [98]. Hence, to reduce the amount of false positive or false negative findings in the resulting parametric maps, a population-specific template would be the best option.
Diffusion Tensor Imaging (DTI)
DTI is a unique procedure which provides the structural integrity, the orientation of white matter fibers in vivo, and the white matter tracts through tractography [99–101]. The comparison of the diffusion tensors between the normal control group and patient group is performed after spatial normalization of DTI data using a standard template [102]. A DTI template generated with limited number of subjects is influenced by the specific characteristic of individual subjects [103]. Hence, a population-specific template, generated using a larger population size, may be appropriate in this case.
Magnetic Resonance Spectroscopy (MRS)
MRS technique allows the detection of different metabolites (within the concentration range of 0.5–10 mM) in different organs (e.g., brain). These metabolites (e.g., glutathione, N-acetyl aspartate, myoinositol, phosphocreatine, etc.) in the brain provide crucial information on oxidative stress [104] and membrane metabolism [105] as well as brain pH mapping [106]. The quantitative determination of these various neurochemicals from different brain regions is of immense value in the diagnosis of different brain disorders [6, 107]. Brain segmentation into white matter, gray matter, and cerebrospinal fluid helps in the better interpretation of metabolite concentration information from each magnetic resonance spectroscopic imaging (MRSI) voxel measured through 1H or 31P MRSI [108]. As brain segmentation involves normalization to a reference image (template), an appropriate brain template would increase the specificity of brain metabolite analysis.
Clinical application
Recently, the goals of transforming and comparing AD data from different phenotypes (e.g., races, ages, genders, pathological states, etc.) or genotypes (e.g., APOE4) are extended to include longitudinal studies within subjects and morphometric comparison, of localized brain anatomy and function, between cohorts longitudinally. For instance, modern AD research explores the relation between diverse areas of molecular, morphological, and biomedical markers and aims to identify reliable imaging, clinical, neuropsychological biomarkers, that represent the progression of dementia, which can be accurately and consistently mapped onto a common stereotactic framework like the AD brain atlas [109]. Such biomarkers, and their interrelations, are of considerable scientific and clinical interest as they have the potential to untangle the biological processes driving the progression of the disease and facilitate the theoretical modeling and empirical estimation that is necessary to predict the state and course of the disease.
Traumatic brain injury (TBI)
TBI is one of the most common causes of cognitive disability. However, unlike other acute or chronic neurological conditions, TBI studies present a serious challenge in construction and utilization of pathological brain atlases. Developing an image analysis technique for precise quantification of TBI-induced structural changes is a challenging task as no clear boundary between two structures exists and they can exhibit severe global and focal atrophy [110]. LONI Pipeline package [111] could be used to measure whole brain volume for both accurate and chronic time points in the patient as well as in control groups [112, 113]. Volumetric analysis such as VBM could be used to study the volume changes after TBI. The biggest concern is that during the process of registering each image to a reference image (could be a standard template), any mis-registration could lead to falsely identified registration errors as true anatomic differences-with poor clinical correlation and serious misjudgment.
The structural abnormalities in the brains of TBI subjects violate the basic assumption of small deformations and intensity relationships which are used in many existing registration methods [114]. As most of the TBIs cases are different due to variation in the type of physical injury, interventions, and physical conditions, TBI atlas variability may be enormous and difficult to quantify. Despite the fact that there are common cognitive symptoms and physiological presentation, there are many unique variations among injured brains. Contemporary TBI atlases attempt to explore the importance of injury impact on brain connectivity using diffusion-based imaging. There are efforts to quantify probabilistically the integrity of the white tracts by DTI [115, 116].
CONCLUSIONS
Brain template design is crucial for the successful analysis of neuroimaging data in neuroscience research. Many laboratories in different institutes are actively involved in the development and refinement of the brain templates.
We have made an attempt to present a review of existing human brain templates in chronological order along with the description of their features and construction protocols. Documentation of the existing brain template design process will lead towards designing a new template or refinement of existing templates using additional information.
There are nine human brain templates available to date, of which only seven are population-specific. Population-specific brain templates are essential for accurate data analysis and interpretation. There is an urgent need in the modern neuroscientific community for development of such templates, particularly for large and diverse population subsets like the Indian subcontinent and African continent. To this end, we have initiated the development of an Indian brain template in our laboratory.
It will be particularly interesting to understand how genetic factors might influence brain structure, for example by affecting a particular vector associated with dimensional growth. Presumably, a general population atlas will accommodate the pressures and vectors with which many genetic factors related to the diversity of the world population will affect size and shape.
A very recent review article has highlighted the need of brain template for different age groups and specific brain areas (e.g., pediatric brain, aging brain, white matter atlas, etc.) [117]. Brains expand and stretch along specific cardioid ontogenetic dimensions that recapitulate phylogeny, and such growth pressures affect sulcal and gyral shape, as well as other brain features. The other end of this continuum is aging, with its unique effect on brain structure, while specific problems such as AD and fronto-temporal dementia definitely have their own unique pressures related to the progression of their own variations of atrophy. There needs to be separate systems for brainstem and cortical mapping, particularly frontal and temporal cortices. In conclusion, the enormous scope for further development and refinement of template design in neuroscience research needs to be exploited and pursued in a goal-oriented manner, as population-and disease-specific brain templates have immense applicative potential in neuroscientific research.
Acknowledgments
Dr. Pravat K. Mandal (Principal Investigator) is thankful to the Department of Information Technology, Govt. of India for funding this research. Thanks are due to Dr. Subbulakshmi Natarajan (MBBS, Ph. D) for comments. Thanks to Mr. R. Prashant for preparing Figures 7–12. Dr. Ivo Dinov acknowledges funding agencies (US National Institutes of Health through Grants U54 RR021813, P41 RR013642, R01 MH71940, and U24-RR025736).
Footnotes
Authors’ disclosures available online (http://www.j-alz.com/disclosures/view.php?id=1303).
References
- 1.Roland PE, Zilles K. Brain atlases–a new research tool. Trends Neurosci. 1994;17:458–467. doi: 10.1016/0166-2236(94)90131-7. [DOI] [PubMed] [Google Scholar]
- 2.Toga AW, Thompson PM. Brain Warping. Academic Press; Los Angeles: 1999. An introduction to brain warping; pp. 1–26. [Google Scholar]
- 3.Toga AW, Thompson PM, Mori S, Amunts K, Zilles K. Towards multimodal atlases of the human brain. Nat Rev Neurosci. 2006;7:952–966. doi: 10.1038/nrn2012. [DOI] [PMC free article] [PubMed] [Google Scholar]
- 4.Bohland JW, Bokil H, Allen CB, Mitra PP. The brain atlas concordance problem: Quantitative comparison of anatomical parcellations. PLoS One. 2009;4:e7200. doi: 10.1371/journal.pone.0007200. [DOI] [PMC free article] [PubMed] [Google Scholar]
- 5.Rex DE, Ma JQ, Toga AW. The LONI pipeline processing environment. Neuroimage. 2003;19:1033–1048. doi: 10.1016/s1053-8119(03)00185-x. [DOI] [PubMed] [Google Scholar]
- 6.Dinov ID. Neurological imaging: Statistics behind the pictures. Imaging Med. 2011;3:423–432. doi: 10.2217/iim.11.37. [DOI] [PMC free article] [PubMed] [Google Scholar]
- 7.Dinov I, Lozev K, Petrosyan P, Liu Z, Eggert P, Pierce J, Zamanyan A, Chakrapani S, Van Horn J, Parker DS, Magsipoc R, Leung K, Gutman B, Woods R, Toga A. Neuroimaging study designs, computational analyses and data provenance using the LONI pipeline. PloS One. 2010;5 doi: 10.1371/journal.pone.0013070. pii: e13070. [DOI] [PMC free article] [PubMed] [Google Scholar]
- 8.Tang Y, Hojatkashani C, Dinov ID, Sun B, Fan L, Lin X, Qi H, Hua X, Liu S, Toga AW. The construction of a Chinese MRI brain atlas: A morphometric comparison study between Chinese and Caucasian cohorts. Neuroimage. 2010;51:33–41. doi: 10.1016/j.neuroimage.2010.01.111. [DOI] [PMC free article] [PubMed] [Google Scholar]
- 9.Mazziotta J, Toga A, Evans A, Fox P, Lancaster J, Zilles K, Woods R, Paus T, Simpson G, Pike B, Holmes C, Collins L, Thompson P, MacDonald D, Iacoboni M, Schormann T, Amunts K, Palomero-Gallagher N, Geyer S, Parsons L, Narr K, Kabani N, Le Goualher G, Boomsma D, Cannon T, Kawashima R, Mazoyer B. A probabilistic atlas and reference system for the human brain: International Consortium for Brain Mapping (ICBM) Philos Trans R Soc Lond B Biol Sci. 2001;356:1293–1322. doi: 10.1098/rstb.2001.0915. [DOI] [PMC free article] [PubMed] [Google Scholar]
- 10.Talairach J, David M, Tournoux P, Corredor H, Kvasina T. Atlas d’anatomie stéréotaxique. Repérage radiologique indirect des noyaux gris centraux des régions mésencephalosousoptique et hypothalamique de l’homme. Masson & Cie; Paris: 1957. p. 294. [Google Scholar]
- 11.Talairach J, Szikla G. Anatomo-Radiological Studies. Masson & Cie; Paris: 1967. Atlas of Stereotaxic anatomy of the telencephalon; p. 326. [Google Scholar]
- 12.Talairach J, Tournoux P. Co-planar steorotaxic atlas of the human brain: Three dimensional proportional system - an approach to cerebral imaging. Thieme Medical Publishers; New York: 1988. p. 132. [Google Scholar]
- 13.Brett M, Johnsrude IS, Owen AM. The problem of functional localization in the human brain. Nat Rev Neurosci. 2002;3:243–249. doi: 10.1038/nrn756. [DOI] [PubMed] [Google Scholar]
- 14.Chau W, McIntosh AR. The Talairach coordinate of a point in the MNI space: How to interpret it. Neuroimage. 2005;25:408–416. doi: 10.1016/j.neuroimage.2004.12.007. [DOI] [PubMed] [Google Scholar]
- 15.Cox RW. AFNI: Software for analysis and visualization of functional magnetic resonance neuroimages. Comput Biomed Res. 1996;29:162–173. doi: 10.1006/cbmr.1996.0014. [DOI] [PubMed] [Google Scholar]
- 16.Lancaster JL, Tordesillas-Gutierrez D, Martinez M, Salinas F, Evans A, Zilles K, Mazziotta JC, Fox PT. Bias between MNI and Talairach coordinates analyzed using the ICBM-152 brain template. Hum Brain Mapp. 2007;28:1194–1205. doi: 10.1002/hbm.20345. [DOI] [PMC free article] [PubMed] [Google Scholar]
- 17.Lee JS, Lee DS, Kim J, Kim YK, Kang E, Kang H, Kang KW, Lee JM, Kim JJ, Park HJ, Kwon JS, Kim SI, Yoo TW, Chang KH, Lee MC. Development of Korean standard brain templates. J Korean Med Sci. 2005;20:483–488. doi: 10.3346/jkms.2005.20.3.483. [DOI] [PMC free article] [PubMed] [Google Scholar]
- 18.Ganser KA, Dickhaus H, Metzner R, Wirtz CR. A deformable digital brain atlas system according to Talairach and Tournoux. Med Image Anal. 2004;8:3–22. doi: 10.1016/j.media.2003.06.001. [DOI] [PubMed] [Google Scholar]
- 19.Bearden CE, van Erp TG, Dutton RA, Tran H, Zimmermann L, Sun D, Geaga JA, Simon TJ, Glahn DC, Cannon TD, Emanuel BS, Toga AW, Thompson PM. Mapping cortical thickness in children with 22q11.2 deletions. Cereb Cortex. 2007;17:1889–1898. doi: 10.1093/cercor/bhl097. [DOI] [PMC free article] [PubMed] [Google Scholar]
- 20.Sherbondy AJ, Dougherty RF, Napel S, Wandell BA. Identifying the human optic radiation using diffusion imaging and fiber tractography. J Vis. 2008;8:12.1–12.11. doi: 10.1167/8.10.12. [DOI] [PMC free article] [PubMed] [Google Scholar]
- 21.Mandelstam SA. Challenges of the anatomy and diffusion tensor tractography of the Meyer loop. AJNR Am J Neurorad. 2012 doi: 10.3174/ajnr.A2652. [DOI] [PMC free article] [PubMed] [Google Scholar]
- 22.Collins DL, Neelin P, Peters TM, Evans AC. Automatic 3D intersubject registration of MR volumetric data in standardized Talairach space. J Comput Assist Tomogr. 1994;18:192–205. [PubMed] [Google Scholar]
- 23.Evans AC, Collins DL, Milner B. An MRI-based stereotactic atlas from 250 young normal subjects. Soc Neurosci Abstr. 1992;18:408–492. [Google Scholar]
- 24.Collins DL, Holmes CJ, Peters TM, Evans AC. Automatic 3-D model-based neuroanatomical segmentation. Hum Brain Mapp. 1995;3:190–208. [Google Scholar]
- 25.Mazziotta JC, Toga AW, Evans AC, Fox PT, Lancaster JL. Digital brain atlases. Trends Neurosci. 1995;18:210–211. doi: 10.1016/0166-2236(95)93904-c. [DOI] [PubMed] [Google Scholar]
- 26.Holmes CJ, Hoge R, Collins L, Woods R, Toga AW, Evans AC. Enhancement of MR images using registration for signal averaging. J Comput Assist Tomogr. 1998;22:324–333. doi: 10.1097/00004728-199803000-00032. [DOI] [PubMed] [Google Scholar]
- 27.Tzourio-Mazoyer N, Landeau B, Papathanassiou D, Crivello F, Etard O, Delcroix N, Mazoyer B, Joliot M. Automated anatomical labeling of activations in SPM using a macroscopic anatomical parcellation of the MNI MRI single-subject brain. NeuroImage. 2002;15:273–289. doi: 10.1006/nimg.2001.0978. [DOI] [PubMed] [Google Scholar]
- 28.Mazziotta JC, Toga AW, Evans A, Fox P, Lancaster J. A probabilistic atlas of the human brain: Theory and rationale for its development. The International Consortium for Brain Mapping (ICBM) Neuroimage. 1995;2:89–101. doi: 10.1006/nimg.1995.1012. [DOI] [PubMed] [Google Scholar]
- 29.Mazziotta J, Toga A, Evans A, Fox P, Lancaster J, Zilles K, Woods R, Paus T, Simpson G, Pike B, Holmes C, Collins L, Thompson P, MacDonald D, Iacoboni M, Schormann T, Amunts K, Palomero-Gallagher N, Geyer S, Parsons L, Narr K, Kabani N, Le Goualher G, Feidler J, Smith K, Boomsma D, Hulshoff Pol H, Cannon T, Kawashima R, Mazoyer B. A four-dimensional probabilistic atlas of the human brain. J Am Med Inform Assoc. 2001;8:401–430. doi: 10.1136/jamia.2001.0080401. [DOI] [PMC free article] [PubMed] [Google Scholar]
- 30.Maintz JB, Viergever MA. A survey of medical image registration. Med Image Anal. 1998;2:1–36. doi: 10.1016/s1361-8415(01)80026-8. [DOI] [PubMed] [Google Scholar]
- 31.ICBM 452 T1 Atlas. ( http://www.loni.ucla.edu/Atlases/AtlasDetail.jsp?atlasid=6.
- 32.Lalys F, Haegelen C, Ferre JC, El-Ganaoui O, Jannin P. Construction and assessment of a 3-T MRI brain template. Neuroimage. 2010;49:345–354. doi: 10.1016/j.neuroimage.2009.08.007. [DOI] [PubMed] [Google Scholar]
- 33.NEMA. What is DICOM (Digital Imaging and Communications in Medicine v3.0) conformance anyway? Adm Radiol J. 1996;15:40, 42. [PubMed] [Google Scholar]
- 34.Analyze7.5. Mayo Clinic; ( http://www.mayo.edu/bir/ [Google Scholar]
- 35.Neuroimaging Informatics Technology Initiative. ( http://nifti.nimh.nih.gov/dfwg/
- 36.LONI Handbook. http://www.loni.ucla.edu/~pipeline/documentation/LONIPipelineHandbookv1.3.pdf.
- 37.Woods RP, Grafton ST, Watson JD, Sicotte NL, Mazziotta JC. Automated image registration: II. Intersubject validation of linear and nonlinear models. J Comput Assist Tomogr. 1998;22:153–165. doi: 10.1097/00004728-199801000-00028. [DOI] [PubMed] [Google Scholar]
- 38.Woods RP, Grafton ST, Holmes CJ, Cherry SR, Mazziotta JC. Automated image registration: I. General methods and intrasubject, intramodality validation. J Comput Assist Tomogr. 1998;22:139–152. doi: 10.1097/00004728-199801000-00027. [DOI] [PubMed] [Google Scholar]
- 39.Shattuck DW, Leahy RM. BrainSuite: An automated cortical surface identification tool. Med Imag Analysis. 2002;6:129–142. doi: 10.1016/s1361-8415(02)00054-3. [DOI] [PubMed] [Google Scholar]
- 40.Smith SM, Jenkinson M, Woolrich MW, Beckmann CF, Behrens TE, Johansen-Berg H, Bannister PR, De Luca M, Drobnjak I, Flitney DE, Niazy RK, Saunders J, Vickers J, Zhang Y, De Stefano N, Brady JM, Matthews PM. Advances in functional and structural MR image analysis and implementation as FSL. NeuroImage. 2004;23(Suppl 1):S208–S219. doi: 10.1016/j.neuroimage.2004.07.051. [DOI] [PubMed] [Google Scholar]
- 41.Zhuang AH, Valentino DJ, Toga AW. Skull-stripping magnetic resonance brain images using a model-based level set. Neuroimage. 2006;32:79–92. doi: 10.1016/j.neuroimage.2006.03.019. [DOI] [PubMed] [Google Scholar]
- 42.Dinov ID, Valentino D, Shin BC, Konstantinidis F, Hu G, MacKenzie-Graham A, Lee EF, Shattuck D, Ma J, Schwartz C, Toga AW. LONI visualization environment. J Digit Imaging. 2006;19:148–158. doi: 10.1007/s10278-006-0266-8. [DOI] [PMC free article] [PubMed] [Google Scholar]
- 43.Ashburner J, Neelin P, Collins DL, Evans A, Friston K. Incorporating prior knowledge into image registration. Neuroimage. 1997;6:344–352. doi: 10.1006/nimg.1997.0299. [DOI] [PubMed] [Google Scholar]
- 44.Ashburner J, Friston KJ. Nonlinear spatial normalization using basis functions. Hum Brain Mapp. 1999;7:254–266. doi: 10.1002/(SICI)1097-0193(1999)7:4<254::AID-HBM4>3.0.CO;2-G. [DOI] [PMC free article] [PubMed] [Google Scholar]
- 45.Ashburner J. A fast diffeomorphic image registration algorithm. Neuroimage. 2007;38:95–113. doi: 10.1016/j.neuroimage.2007.07.007. [DOI] [PubMed] [Google Scholar]
- 46.Whitwell JL. Voxel-based morphometry: An automated technique for assessing structural changes in the brain. J Neurosci. 2009;29:9661–9664. doi: 10.1523/JNEUROSCI.2160-09.2009. [DOI] [PMC free article] [PubMed] [Google Scholar]
- 47.Kostelec PJ, Periaswamy S. Image registration for MRI. Modern Signal Processing. 2003;46:161–184. [Google Scholar]
- 48.Zitová B, Flusser J. Image registration methods: A survey. Image Vis Comput. 2003;21:977–1000. [Google Scholar]
- 49.Brown GL. A survey of image registration techniques. ACM Computing Surveys (CSUR) 1992;24:325. [Google Scholar]
- 50.Van den Elsen PA, Pol EJD, Viergever MA. Medical image matching-a review with classification. IEEE Eng Med Biol. 1993;12:26–39. [Google Scholar]
- 51.Ashburner J, Friston KJ. Image registration. In: Moonen CTW, Bandettini PA, editors. Functional MRI. Springer-Verlag; Berlin: 2000. pp. 585–596. [Google Scholar]
- 52.Thompson PM, Toga AW. Detection, visualization and animation of abnormal anatomic structure with a deformable probabilistic brain atlas based on random vector field transformations. Med Image Anal. 1997;1:271–294. doi: 10.1016/s1361-8415(97)85002-5. [DOI] [PubMed] [Google Scholar]
- 53.Toga AW, Thompson PM. The role of image registration in brain mapping. Image Vis Comput. 2001;19:3–24. doi: 10.1016/S0262-8856(00)00055-X. [DOI] [PMC free article] [PubMed] [Google Scholar]
- 54.Christensen GE, Rabbitt RD, Miller MI. Deformable templates using large deformation kinematics. IEEE Trans Image Process. 1996;5:1435–1447. doi: 10.1109/83.536892. [DOI] [PubMed] [Google Scholar]
- 55.Crum WR, Hartkens T, Hill DL. Non-rigid image registration: Theory and practice. Br J Radiol 77 Spec No. 2004;2:S140–S153. doi: 10.1259/bjr/25329214. [DOI] [PubMed] [Google Scholar]
- 56.Meyer CR, Boes JL, Kim B, Bland PH, Zasadny KR, Kison PV, Koral K, Frey KA, Wahl RL. Demonstration of accuracy and clinical versatility of mutual information for automatic multimodality image fusion using affine and thin-plate spline warped geometric deformations. Med Image Anal. 1997;1:195–206. doi: 10.1016/s1361-8415(97)85010-4. [DOI] [PubMed] [Google Scholar]
- 57.Davis MH, Khotanzad A, Flamig DP, Harms SE. A physics-based coordinate transformation for 3-D image matching. IEEE Trans Med Imaging. 1997;16:317–328. doi: 10.1109/42.585766. [DOI] [PubMed] [Google Scholar]
- 58.Sederberg TW. Free form deformation of solid geometric models. Proceeding SIGGRAPH’86 Proceedings of the 13th Annual Conference on Computer Graphics and Interactive Techniques. 1986;20:151–160. [Google Scholar]
- 59.McInerney T, Terzopoulos D. Deformable models in medical image analysis: A survey. Med Image Anal. 1996;1:91–108. doi: 10.1016/s1361-8415(96)80007-7. [DOI] [PubMed] [Google Scholar]
- 60.James CG, Ruzena KB. Brain Warping. Academic Press; Philadelphia: 1999. Elastic matching: Continuum mechanical and probabilistic analysis; pp. 183–197. [Google Scholar]
- 61.Bro-Nielsen M, Gramkow C. Visualization in Biomedical Computing (VBC’96), Springer Lecture Notes in Computer Science. Hamburg, Germany: 1996. Fast fluid registration of medical images; pp. 267–276. [Google Scholar]
- 62.Qiu A, Younes L, Miller MI, Csernansky JG. Parallel transport in diffeomorphisms distinguishes the time-dependent pattern of hippocampal surface deformation due to healthy aging and the dementia of the Alzheimer’s type. NeuroImage. 2008;40:68–76. doi: 10.1016/j.neuroimage.2007.11.041. [DOI] [PMC free article] [PubMed] [Google Scholar]
- 63.Joshi SH, Cabeen RP, Sun B, Joshi AA, Gutman B, Zamanyan A, Chakrapani S, Dinov I, Woods RP, Toga AW. Cortical sulcal atlas construction using a diffeomorphic mapping approach. Med Image Comput Comput Assist Interv. 2010;13(Pt 1):357–366. doi: 10.1007/978-3-642-15705-9_44. [DOI] [PMC free article] [PubMed] [Google Scholar]
- 64.Avants BB, Epstein CL, Grossman M, Gee JC. Symmetric diffeomorphic image registration with cross-correlation: Evaluating automated labeling of elderly and neurodegenerative brain. Med Image Anal. 2008;12:26–41. doi: 10.1016/j.media.2007.06.004. [DOI] [PMC free article] [PubMed] [Google Scholar]
- 65.Dinov ID, Mega MS, Thompson PM, Woods RP, Sumners DL, Sowell EL, Toga AW. Quantitative comparison and analysis of brain image registration using frequency-adaptive wavelet shrinkage. IEEE Trans Int Technol Biomed. 2002;6:73–85. doi: 10.1109/4233.992165. [DOI] [PubMed] [Google Scholar]
- 66.Andronache A, von Siebenthal M, Szekely G, Cattin P. Non-rigid registration of multi-modal images using both mutual information and cross-correlation. Med Image Anal. 2008;12:3–15. doi: 10.1016/j.media.2007.06.005. [DOI] [PubMed] [Google Scholar]
- 67.Pluim JP, Maintz JB, Viergever MA. Mutual-information-based registration of medical images: A survey. IEEE Trans Med Imaging. 2003;22:986–1004. doi: 10.1109/TMI.2003.815867. [DOI] [PubMed] [Google Scholar]
- 68.Wells WM, 3rd, Viola P, Atsumi H, Nakajima S, Kikinis R. Multi-modal volume registration by maximization of mutual information. Med Image Anal. 1996;1:35–51. doi: 10.1016/s1361-8415(01)80004-9. [DOI] [PubMed] [Google Scholar]
- 69.Rogelj P, Kovacic S. Local similarity measures for multimodal image matching. First Intl Workshop on Image and Signal Processing and Analysis; Pula, Croatia. 2000. pp. 81–86. [Google Scholar]
- 70.Studholme C, Drapaca C, Iordanova B, Cardenas V. Deformation-based mapping of volume change from serial brain MRI in the presence of local tissue contrast change. IEEE Trans Med Imaging. 2006;25:626–639. doi: 10.1109/TMI.2006.872745. [DOI] [PubMed] [Google Scholar]
- 71.Studholme C, Hills D, Hawkes D. An overlap invariant entropy measure of 3D medical image alignment. Pattern Recognition. 1999;32:71–86. [Google Scholar]
- 72.Klein A, Andersson J, Ardekani BA, Ashburner J, Avants B, Chiang MC, Christensen GE, Collins DL, Gee J, Hellier P, Song JH, Jenkinson M, Lepage C, Rueckert D, Thompson P, Vercauteren T, Woods RP, Mann JJ, Parsey RV. Evaluation of 14 nonlinear deformation algorithms applied to human brain MRI registration. Neuroimage. 2009;46:786–802. doi: 10.1016/j.neuroimage.2008.12.037. [DOI] [PMC free article] [PubMed] [Google Scholar]
- 73.Dice LR. Measures of the amount of ecologic association between species. Ecology. 1945;26:297–302. [Google Scholar]
- 74.Shattuck DW, Sandor-Leahy SR, Schaper KA, Rottenberg DA, Leahy RM. Magnetic resonance image tissue classification using a partial volume model. NeuroImage. 2001;13:856–876. doi: 10.1006/nimg.2000.0730. [DOI] [PubMed] [Google Scholar]
- 75.Shattuck DW, Gautam G, Mirza M, Narr KL, Toga AW. Online resource for validation of brain segmentation methods. Neuroimage. 2008;45:431–439. doi: 10.1016/j.neuroimage.2008.10.066. [DOI] [PMC free article] [PubMed] [Google Scholar]
- 76.Tohka J, Dinov ID, Shattuck DW, Toga AW. Brain MRI tissue classification based on local Markov random fields. Magn Reson Imaging. 2010;28:557–573. doi: 10.1016/j.mri.2009.12.012. [DOI] [PMC free article] [PubMed] [Google Scholar]
- 77.Van Leemput K, Maes F, Vandermeulen D, Suetens P. Automated model-based tissue classification of MR images of the brain. IEEE Trans Med Imaging. 1999;18:897–908. doi: 10.1109/42.811270. [DOI] [PubMed] [Google Scholar]
- 78.Tohka J, Krestyannikov E, Dinov ID, Graham AM, Shattuck DW, Ruotsalainen U, Toga AW. Genetic algorithms for finite mixture model based voxel classification in neuroimaging. IEEE Trans Med Imaging. 2007;26:696–711. doi: 10.1109/TMI.2007.895453. [DOI] [PMC free article] [PubMed] [Google Scholar]
- 79.West J, Fitzpatrick JM, Wang MY, Dawant BM, Maurer CR, Jr, Kessler RM, Maciunas RJ, Barillot C, Lemoine D, Collignon A, Maes F, Suetens P, Vandermeulen D, van den Elsen PA, Napel S, Sumanaweera TS, Harkness B, Hemler PF, Hill DL, Hawkes DJ, Studholme C, Maintz JB, Viergever MA, Malandain G, Woods RP, et al. Comparison and evaluation of retrospective intermodality brain image registration techniques. J Comput Assist Tomogr. 1997;21:554–566. doi: 10.1097/00004728-199707000-00007. [DOI] [PubMed] [Google Scholar]
- 80.Ashburner J, Friston KJ. Voxel-based morphometry–the methods. Neuroimage. 2000;11:805–821. doi: 10.1006/nimg.2000.0582. [DOI] [PubMed] [Google Scholar]
- 81.Khullar S, Michael AM, Cahill ND, Kiehl KA, Pearlson G, Baum SA, Calhoun VD. ICA-fNORM: Spatial normalization of fMRI data using intrinsic group-ICA networks. Front Syst Neurosci. 2011;5:93. doi: 10.3389/fnsys.2011.00093. [DOI] [PMC free article] [PubMed] [Google Scholar]
- 82.Sabuncu MR, Singer BD, Conroy B, Bryan RE, Ramadge PJ, Haxby JV. Function-based intersubject alignment of human cortical anatomy. Cereb Cortex. 2010;20:130–140. doi: 10.1093/cercor/bhp085. [DOI] [PMC free article] [PubMed] [Google Scholar]
- 83.Saxe R, Brett M, Kanwisher N. Divide and conquer: A defense of functional localizers. Neuroimage. 2006;30:1088–1099. doi: 10.1016/j.neuroimage.2005.12.062. [DOI] [PubMed] [Google Scholar]
- 84.Kubota T, Ushijima Y, Okuyama C, Nishimura T. A region-of-interest template for three-dimensional stereotactic surface projection images: Initial application to the analysis of Alzheimer’s disease and mild cognitive impairment. Nucl Med Commun. 2006;27:37–44. doi: 10.1097/01.mnm.0000188220.99580.88. [DOI] [PubMed] [Google Scholar]
- 85.Hammers A, Allom R, Koepp MJ, Free SL, Myers R, Lemieux L, Mitchell TN, Brooks DJ, Duncan JS. Three-dimensional maximum probability atlas of the human brain, with particular reference to the temporal lobe. Hum Brain Mapp. 2003;19:224–247. doi: 10.1002/hbm.10123. [DOI] [PMC free article] [PubMed] [Google Scholar]
- 86.Hammers A, Koepp MJ, Free SL, Brett M, Richardson MP, Labbe C, Cunningham VJ, Brooks DJ, Duncan J. Implementation and application of a brain template for multiple volumes of interest. Hum Brain Mapp. 2002;15:165–174. doi: 10.1002/hbm.10016. [DOI] [PMC free article] [PubMed] [Google Scholar]
- 87.Grachev ID, Berdichevsky D, Rauch SL, Heckers S, Kennedy DN, Caviness VS, Alpert NM. A method for assessing the accuracy of intersubject registration of the human brain using anatomic landmarks. Neuroimage. 1999;9:250–268. doi: 10.1006/nimg.1998.0397. [DOI] [PubMed] [Google Scholar]
- 88.Huang CM, Lee SH, Hsiao IT, Kuan WC, Wai YY, Ko HJ, Wan YL, Hsu YY, Liu HL. Study-specific EPI template improves group analysis in functional MRI of young and older adults. J Neurosci Methods. 2010;189:257–266. doi: 10.1016/j.jneumeth.2010.03.021. [DOI] [PubMed] [Google Scholar]
- 89.Good CD, Johnsrude IS, Ashburner J, Henson RN, Friston KJ, Frackowiak RS. A voxel-based morphometric study of ageing in 465 normal adult human brains. Neuroimage. 2001;14:21–36. doi: 10.1006/nimg.2001.0786. [DOI] [PubMed] [Google Scholar]
- 90.Wang J, Wang L, Zang Y, Yang H, Tang H, Gong Q, Chen Z, Zhu C, He Y. Parcellation-dependent small-world brain functional networks: A resting-state fMRI study. Hum Brain Mapp. 2009;30:1511–1523. doi: 10.1002/hbm.20623. [DOI] [PMC free article] [PubMed] [Google Scholar]
- 91.Leow AD, Klunder AD, Jack CR, Jr, Toga AW, Dale AM, Bernstein MA, Britson PJ, Gunter JL, Ward CP, Whitwell JL, Borowski BJ, Fleisher AS, Fox NC, Harvey D, Kornak J, Schuff N, Studholme C, Alexander GE, Weiner MW, Thompson PM. Longitudinal stability of MRI for mapping brain change using tensor-based morphometry. Neuroimage. 2006;31:627–640. doi: 10.1016/j.neuroimage.2005.12.013. [DOI] [PMC free article] [PubMed] [Google Scholar]
- 92.Lepore N, Brun C, Pennec X, Chou YY, Lopez OL, Aizen-stein HJ, Becker JT, Toga AW, Thompson PM. Mean template for tensor-based morphometry using deformation tensors. Med Image Comput Comput Assist Interv. 2007;10:826–833. doi: 10.1007/978-3-540-75759-7_100. [DOI] [PubMed] [Google Scholar]
- 93.Lepore N, Brun C, Chou YY, Chiang MC, Dutton RA, Hayashi KM, Luders E, Lopez OL, Aizenstein HJ, Toga AW, Becker JT, Thompson PM. Generalized tensor-based morphometry of HIV/AIDS using multivariate statistics on deformation tensors. IEEE Trans Med Imaging. 2008;27:129–141. doi: 10.1109/TMI.2007.906091. [DOI] [PMC free article] [PubMed] [Google Scholar]
- 94.Chung MK, Worsley KJ, Paus T, Cherif C, Collins DL, Giedd JN, Rapoport JL, Evans AC. A unified statistical approach to deformation-based morphometry. Neuroimage. 2001;14:595–606. doi: 10.1006/nimg.2001.0862. [DOI] [PubMed] [Google Scholar]
- 95.Ho AJ, Stein JL, Hua X, Lee S, Hibar DP, Leow AD, Dinov ID, Toga AW, Saykin AJ, Shen L, Foroud T, Pankratz N, Huentelman MJ, Craig DW, Gerber JD, Allen AN, Corneveaux JJ, Stephan DA, DeCarli CS, DeChairo BM, Potkin SG, Jack CR, Jr, Weiner MW, Raji CA, Lopez OL, Becker JT, Carmichael OT, Thompson PM. A commonly carried allele of the obesity-related FTO gene is associated with reduced brain volume in the healthy elderly. Proc Natl Acad Sci U S A. 2010;107:8404–8409. doi: 10.1073/pnas.0910878107. [DOI] [PMC free article] [PubMed] [Google Scholar]
- 96.Hua X, Leow AD, Parikshak N, Lee S, Chiang MC, Toga AW, Jack CR, Jr, Weiner MW, Thompson PM. Tensor-based morphometry as a neuroimaging biomarker for Alzheimer’s disease: An MRI study of 676 AD, MCI, and normal subjects. Neuroimage. 2008;43:458–469. doi: 10.1016/j.neuroimage.2008.07.013. [DOI] [PMC free article] [PubMed] [Google Scholar]
- 97.Teipel SJ, Born C, Ewers M, Bokde AL, Reiser MF, Moller HJ, Hampel H. Multivariate deformation-based analysis of brain atrophy to predict Alzheimer’s disease in mild cognitive impairment. Neuroimage. 2007;38:13–24. doi: 10.1016/j.neuroimage.2007.07.008. [DOI] [PubMed] [Google Scholar]
- 98.Koikkalainen J, Lotjonen J, Thurfjell L, Rueckert D, Waldemar G, Soininen H. Multi-template tensor-based morphometry: Application to analysis of Alzheimer’s disease. Neuroimage. 2011;56:1134–1144. doi: 10.1016/j.neuroimage.2011.03.029. [DOI] [PMC free article] [PubMed] [Google Scholar]
- 99.Jones DK, Griffin LD, Alexander DC, Catani M, Horsfield MA, Howard R, Williams SC. Spatial normalization and averaging of diffusion tensor MRI data sets. NeuroImage. 2002;17:592–617. [PubMed] [Google Scholar]
- 100.Oishi K, Mori S, Donohue PK, Ernst T, Anderson L, Buchthal S, Faria A, Jiang H, Li X, Miller MI, van Zijl PC, Chang L. Multi-contrast human neonatal brain atlas: Application to normal neonate development analysis. NeuroImage. 2011;56:8–20. doi: 10.1016/j.neuroimage.2011.01.051. [DOI] [PMC free article] [PubMed] [Google Scholar]
- 101.Hasan KM, Walimuni IS, Abid H, Datta S, Wolinsky JS, Narayana PA. Human brain atlas-based multimodal MRI analysis of volumetry, diffusimetry, relaxometry and lesion distribution in multiple sclerosis patients and healthy adult controls: Implications for understanding the pathogenesis of multiple sclerosis and consolidation of quantitative MRI results in MS. J Neurol Sci. 2012;313:99–109. doi: 10.1016/j.jns.2011.09.015. [DOI] [PMC free article] [PubMed] [Google Scholar]
- 102.Alexander DC, Pierpaoli C, Basser PJ, Gee JC. Spatial transformations of diffusion tensor magnetic resonance images. IEEE Trans Med Imaging. 2001;20:1131–1139. doi: 10.1109/42.963816. [DOI] [PubMed] [Google Scholar]
- 103.Zhang S, Peng H, Dawe RJ, Arfanakis K. Enhanced ICBM diffusion tensor template of the human brain. NeuroImage. 2011;54:974–984. doi: 10.1016/j.neuroimage.2010.09.008. [DOI] [PMC free article] [PubMed] [Google Scholar]
- 104.Mandal PK, Tripathi M, Sugunan S. Brain oxidative stress: Detection and mapping of anti-oxidant marker ‘Glutathione’ in different brain regions of healthy male/female, MCI and Alzheimer patients using non-invasive magnetic resonance spectroscopy. Biochem Biophys Res Commun. 2012;417:43–48. doi: 10.1016/j.bbrc.2011.11.047. [DOI] [PubMed] [Google Scholar]
- 105.Mandal PK, Akolkar H. A new experimental approach and signal processing scheme for the detection and quantitation of (3)(1)P brain neurochemicals from in vivo MRS studies using dual tuned (1H/(31P) head coil. Biochem Biophys Res Commun. 2011;412:302–306. doi: 10.1016/j.bbrc.2011.07.088. [DOI] [PubMed] [Google Scholar]
- 106.Mandal PK, Akolkar H, Tripathi M. Mapping of hippocampal pH and neurochemicals from in vivo multi-voxel 31P experiments in healthy normal young male/female, mild cognitive impairment, and Alzheimer’s disease. J Alzheimer Dis. 2012 doi: 10.3233/JAD-2012-120166. [DOI] [PubMed]
- 107.Mandal PK. Magnetic resonance spectroscopy (MRS) and its application in Alzheimer’s disease. Concepts Magn Reson A. 2007;30A:40–64. [Google Scholar]
- 108.Bonekamp D, Horska A, Jacobs MA, Arslanoglu A, Barker PB. Fast method for brain image segmentation: Application to proton magnetic resonance spectroscopic imaging. Magn Reson Med. 2005;54:1268–1272. doi: 10.1002/mrm.20657. [DOI] [PubMed] [Google Scholar]
- 109.Mega MS, Dinov ID, Mazziotta JC, Manese M, Thompson PM, Lindshield C, Moussai J, Tran N, Olsen K, Zoumalan CI, Woods RP, Toga AW. Automated brain tissue assessment in the elderly and demented population: Construction and validation of a sub-volume probabilistic brain atlas. NeuroImage. 2005;26:1009–1018. doi: 10.1016/j.neuroimage.2005.03.031. [DOI] [PubMed] [Google Scholar]
- 110.Kim J, Avants B, Patel S, Whyte J, Coslett BH, Pluta J, Detre JA, Gee JC. Structural consequences of diffuse traumatic brain injury: A large deformation tensor-based morphometry study. Neuroimage. 2008;39:1014–1026. doi: 10.1016/j.neuroimage.2007.10.005. [DOI] [PMC free article] [PubMed] [Google Scholar]
- 111.Dinov ID, Van Horn JD, Lozev KM, Magsipoc R, Petrosyan P, Liu Z, Mackenzie-Graham A, Eggert P, Parker DS, Toga AW. Efficient, distributed and interactive neuroimaging data analysis using the LONI pipeline. Front Neuroinform. 2009;3:22. doi: 10.3389/neuro.11.022.2009. [DOI] [PMC free article] [PubMed] [Google Scholar]
- 112.Xu Y, McArthur DL, Alger JR, Etchepare M, Hovda DA, Glenn TC, Huang S, Dinov I, Vespa PM. Early non-ischemic oxidative metabolic dysfunction leads to chronic brain atrophy in traumatic brain injury. J Cereb Blood Flow Metab. 2010;30:883–894. doi: 10.1038/jcbfm.2009.263. [DOI] [PMC free article] [PubMed] [Google Scholar]
- 113.Vespa PM, McArthur DL, Xu Y, Eliseo M, Etchepare M, Dinov I, Alger J, Glenn TP, Hovda D. Nonconvulsive seizures after traumatic brain injury are associated with hippocampal atrophy. Neurology. 2010;75:792–798. doi: 10.1212/WNL.0b013e3181f07334. [DOI] [PMC free article] [PubMed] [Google Scholar]
- 114.Studholme C, Cardenas V, Blumenfeld R, Schuff N, Rosen HJ, Miller B, Weiner M. Deformation tensor morphometry of semantic dementia with quantitative validation. NeuroImage. 2004;21:1387–1398. doi: 10.1016/j.neuroimage.2003.12.009. [DOI] [PubMed] [Google Scholar]
- 115.Hagler DJ, Jr, Ahmadi ME, Kuperman J, Holland D, McDonald CR, Halgren E, Dale AM. Automated white-matter tractography using a probabilistic diffusion tensor atlas: Application to temporal lobe epilepsy. Hum Brain Mapp. 2009;30:1535–1547. doi: 10.1002/hbm.20619. [DOI] [PMC free article] [PubMed] [Google Scholar]
- 116.Broser P, Vargha-Khadem F, Clark CA. Robust subdivision of the thalamus in children based on probability distribution functions calculated from probabilistic tractography. NeuroImage. 2011;57:403–415. doi: 10.1016/j.neuroimage.2011.04.054. [DOI] [PubMed] [Google Scholar]
- 117.Evans AC, Janke AL, Collins DL, Baillet S. Brain templates and atlases. NeuroImage. 2012 doi: 10.1016/j.neuroimage.2012.01.024. [DOI] [PubMed] [Google Scholar]
- 118.Svarer C, Madsen K, Hasselbalch SG, Pinborg LH, Haugbol S, Frokjaer VG, Holm S, Paulson OB, Knudsen GM. MR-based automatic delineation of volumes of interest in human brain PET images using probability maps. Neuroimage. 2005;24:969–979. doi: 10.1016/j.neuroimage.2004.10.017. [DOI] [PubMed] [Google Scholar]
- 119.Myronenko A, Song X. Intensity-based image registration by minimizing residual complexity. IEEE Trans Med Imaging. 2010;29:1882–1891. doi: 10.1109/TMI.2010.2053043. [DOI] [PubMed] [Google Scholar]


