

Abstract
Objective
This study was undertaken to evaluate the influence of preterm birth and other factors on cerebral cortical maturation.
Methods
We have evaluated the effects of preterm birth on cortical folding by applying cortical cartography methods to a cohort of 52 preterm infants (<31 weeks gestation, mild or no injury on conventional magnetic resonance imaging) and 12 term-born control infants. All infants were evaluated at term-equivalent postmenstrual age.
Results
Preterm infants had lower values for the global measures of gyrification index (GI; 2.06 ± 0.07 vs 1.80 ± 0.12, p < 0.001; control vs preterm) and cortical surface area (CSA; 316 ± 24 cm2 vs 257 ± 40 cm2, p < 0.001). Regional analysis of sulcal depth and cortical shape showed the greatest impact of preterm birth on the insula, superior temporal sulcus, and ventral portions of the pre- and postcentral sulci in both hemispheres. Although CSA and GI are related, CSA was more sensitive to antenatal and postnatal factors than GI. Both measures were lower in preterm infants of lower birth weight standard deviation scores and smaller occipitofrontal circumference at time of scan, whereas CSA alone was lower in association with smaller occipitofrontal circumference at birth. CSA was also lower in infants with higher critical illness in the first 24 hours of life, exposure to postnatal steroids, and prolonged endotracheal intubation.
Interpretation
Preterm birth disrupts cortical development in a regionally specific fashion with abnormalities evident by term-equivalent postmenstrual age. This disruption is influenced by both antenatal growth and postnatal course.
There has been a steady increase in the survival rates of very preterm infants. In many countries the majority of infants born at 24 weeks gestation or greater survive, but morbidity among these survivors is high.1 Approximately one-third have difficulties in school, and roughly 10% are diagnosed with cerebral palsy.2,3 Advances in magnetic resonance imaging (MRI) have enabled investigators to characterize premature infant brain development in vivo4 in an effort to identify the alterations in brain development underlying the high incidence of significant disabilities. For example, volumetric MRI studies conducted in school-age, preterm-born children have reported reduced volumes of the corpus callosum,4,5 hippocampus,6 basal ganglia,7 and amygdala7 as well as enlarged lateral ventricles.6 A functional MRI study has demonstrated impairments in network development, including abnormalities in thalamocortical connections.8
To date, relatively few studies have directly tested for abnormalities of cortical folding associated with these neurodevelopmental challenges. During the last trimester of gestation, the cerebral cortex undergoes a period of rapid expansion and folding,9 which may be disrupted by preterm birth and the challenges associated with living in the neonatal intensive care unit environment. In support of this, preterm infants have been shown to have reduced overall cortical surface area and folding.10,11 The current study was undertaken to identify the impact of preterm birth on regional patterns as well as global measures of cortical folding.
Subjects and Methods
Subjects
Fifty-two infants (27 males, 25 females) born at <31 weeks gestation, hereafter referred to as “preterm” infants, were recruited from St Louis Children's Hospital. Additionally, 12 term-born infants (7 male, 5 female, mean gestational age = 39 weeks) from uncomplicated pregnancies, hereafter referred to as “control” infants, were recruited from Barnes-Jewish Hospital in St Louis, Missouri to serve as a healthy, term-born control group. Six of these were part of a previously reported term control group.12 To meet inclusion criteria, control infants had no maternal history of major medical or psychiatric illness, no maternal medication treatment or substance abuse history during the pregnancy, gestation ≥ 38 weeks, prenatal care (>5 visits), 5-minute Apgar score ≥ 8, no admission to a neonatal or special care nursing unit, and no risk for neurological abnormality (no antenatal cerebral abnormality detected by fetal ultrasound, no concerns for chromosomal abnormality or congenital or acquired infection, and no neonatal encephalopathy). All procedures were approved by the institutional review board, and parents or legal guardians provided informed, written consent.
Mri
All infants underwent MRI scanning at a postmenstrual age (PMA) of 36 to 41 weeks; the average PMA did not differ significantly between groups (Table1). Infants were not sedated for scanning. They were transported to the scanner shortly after feeding and restrained using a vacuum-fix bag.13 Images were obtained using a turbo spin echo T2-weighted sequence (repetition time = 8,500 milliseconds; echo time = 160 milliseconds; voxel size = 1 × 1 × 1 mm3) on a Siemens (Erlangen, Germany) 3T Trio scanner. Images were not used if they had significant movement artifact or abnormality.
Table 1.
Characteristics of Subjects
| Clinical Characteristics | Preterm Infants, n = 52 | Term Control Infants, n = 12 |
|---|---|---|
| Gestational age at birth, mean wk (SD) | 27 (2) | 39 (1) |
| Postmenstrual age at MRI, mean wk (SD) | 38 (1) | 39 (1) |
| Head circumference at time of scan, mean cm (SD) | 32.8 (1.7) | 34.2 (1.1) |
| Male, No. [%] | 27 [52] | 7 [58] |
| Caucasian, African American, Asian, No. [%] | 29 [56], 22 [42], 1 [2] | 5 [42], 7 [58], 0 [0] |
| Birth weight, mean g (SD) | 940 (247) | 3,498 (378) |
| IUGR, No. [%] | 3 [6] | |
| Postnatal steroid therapy, No. [%] | 15 [29] | |
| Confirmed sepsis, No. [%] | 13 [25] | |
| Patent ductus arteriosus, No. [%] | 24 [46] | |
| Length of endotracheal ventilation, median days {IQR} | 2 {1–12} | |
| CRIB, median {IQR} | 4 {1–7} | |
| Total parenteral nutrition, median days {IQR} | 16 {10–29} | |
| Cystic white matter lesions, No. [%] | 0 [0] | |
| Focal punctate white matter signal abnormality, No. [%] | 9 [17] | |
| Delayed myelination, No. [%] | 19 [36] | |
| Any thinning of the corpus callosum, No. [%] | 33 [63] | |
| Any dilatation of the lateral ventricles, No. [%] | 38 [73] | |
| Reduced WM volume, No. [%] | 37 [71] | |
| Intraventricular hemorrhage (grades 1 and 2), No. [%] | 14 [27] |
Clinical Characteristics of the 52 preterm infants and 12 healthy term controls are listed. None of the preterm infants had significant brain injury at the time of MRI.
CRIB = Clinical Risk Index Score for Babies; IQR = interquartile range; IUGR = intrauterine growth restriction; MRI = magnetic resonance imaging; SD = standard deviation; WM = white matter.
MRI Analysis and Processing
Qualitative analysis of white matter abnormalities was performed by a neonatologist (T.E.I.) blinded to the infant's clinical history.14 T2-weighted images were processed, and cortical segmentations were generated at the midthickness of the cortex using previously documented methods.12,15 These segmentations were then manually edited by analysts trained in neonatal neuroanatomy. One individual (D.A.) blinded to subject group reviewed all segmentations and provided feedback for further editing as needed to minimize inter-rater inconsistencies.
Cortical surface reconstructions, including midthickness, inflated, flat, and spherical surfaces, were generated for each hemisphere using methods previously reported.12 Additionally, a cerebral hull surface was generated.16 The folding measures of cortical surface area (CSA) and gyrification index (GI) were generated for each hemisphere using the surfaces in the individual's native space after alignment along the anterior commissure–posterior commissure (AC–PC) axis. The GI is the ratio of the area of the midthickness cortical surface to the surface area of the cerebral hull. For each subject, the average of the left and right hemispheres (for both GI and CSA) was used for analysis.
Registration
All individual cortical midthickness surfaces were registered to an updated version of the PALS-term12 atlas.12 The surface-based registration was performed using the Core Six landmarks, a set of highly consistent surface landmarks that are readily identifiable in the population under study. These landmarks, consisting of the central sulcus, sylvian fissure, anterior portion of the superior temporal gyrus, calcarine sulcus, and dorsal and ventral portions of the medial wall, were drawn on smoothed or flattened surfaces using information visible in other surface configurations (midthickness, inflated) as well as the segmentation and MRI volumes. Registration was performed using previously documented methods16 and allowed for direct comparison of corresponding locations across individual surfaces. Average AC–PC midthickness surfaces for each group were generated by averaging the standard-mesh midthickness surfaces within each group.
Data Analysis
Global Statistical Analysis
Global statistical analyses were performed using SPSS (IBM, Armonk, NY) to compare the GI and CSA values between the preterm and control infant groups by using an independent t test. Within the preterm infants, a group analysis was performed to examine the effects of the following clinical characteristics on GI and CSA values: gestational age at birth, sex, race, birth weight (BW), BW standard deviation score (SDS), intrauterine growth restriction (IUGR; defined as BW SDS < −2), change in BW SDS between birth and scan, birth occipitofrontal head circumference (OFC), birth OFC SDS, OFC at time of scan, postnatal steroid therapy, confirmed sepsis, patent ductus arteriosus confirmed by echocardiography, length of endotracheal ventilation (ETV), Clinical Risk Index Score for Babies (CRIB), and time of treatment with total parenteral nutrition (TPN). This was performed using individual linear regression analyses controlling for PMA at MRI.
Sulcal Depth Analysis
At each node on each average midthickness surface, the depth was calculated by measuring the distance between that node and the nearest node on the cerebral hull surface. Analyses were performed using methods similar to those previously reported,12 with the difference of the use of a 2-sampled t test instead of a paired t test. Permutation analyses (5,000 iterations) were applied to threshold for statistically significant group differences using the threshold-free cluster enhancement method12 and p < 0.025 to account for multiple comparisons for 2 hemispheres. The location of each statistically significant cluster was visualized on group-averaged midthickness and inflated cortical surfaces. To estimate the architectonic area associated with regions of interest, the Brodmann areal boundaries from the 74k-vertex version of the human Conte69 atlas were registered to the PALS-term12 atlas using interatlas methods described previously.17
Coordinate Distance Analysis
For each hemisphere, the mean AC–PC midthickness surfaces for both groups (term control and preterm) were averaged to generate an unbiased surface target whose size is midway between the mean dimensions of the 2 groups. An affine transformation was computed using caret_command surface affine regression to minimize the mean square error between each individual's transformed surface and this atlas target. The resulting affine-transformed individual surfaces were input into a 1-way coordinate analysis of variance to determine whether there were regionally significant coordinate differences between the groups.18 For visualization purposes, average midthickness surfaces were computed for each group using the midthickness surfaces that had been normalized to the common target (mean of the group mean midthickness surfaces). The Euclidean distance between these normalized mean midthickness surfaces was computed, and the directional components (dx, dy, and dz) were assigned a color (red, green, and blue, respectively).
Results
Subjects
Clinical characteristics of the 52 preterm infants and 12 control infants are listed in Table1. Preterm infants with extensive cerebellar hemorrhage, grade III or IV intraventricular hemorrhage (on routine clinical cranial ultrasound), cystic periventricular leukomalacia, or noncystic but extensive signal abnormality in the white matter on MRI were excluded from this study. As shown in Table1, some preterm infants had white matter abnormalities, none of which were severe.14
Global Measures
Figure 1 shows average sulcal depth maps for preterm and control infants. On qualitative inspection, the maps from preterm infants show fewer and shallower sulci. Quantitative differences in GI and CSA are plotted in Figure 2. Preterm infants had lower GIs (control 2.06 ± 0.07 vs preterm 1.80 ± 0.12, p < 0.001) and CSAs (control 316 ± 24 cm2 vs preterm 257 ± 40 cm2, p < 0.001) compared to term controls. Note the greater variability in both GI and CSA for preterm infants as compared with term control infants.
Figure 1.
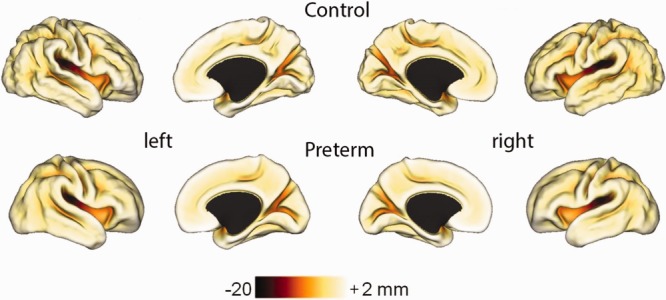
Average left and right midthickness cortical surfaces for term controls and preterm infants with average sulcal depth maps overlaid. The color bar shows the scale of the sulcal depths in millimeters.
Figure 2.
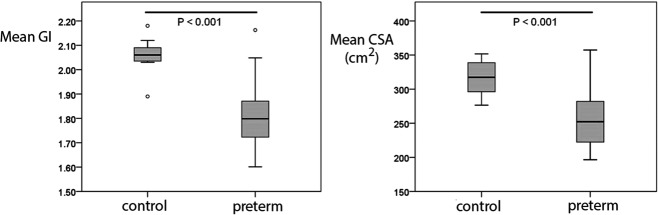
Differences in gyrification index (GI) and cortical surface area (CSA) between preterm and control infants.
Perinatal Factors Predicting Folding
Individual linear regression analyses controlling for PMA at MRI revealed multiple predictors of GI and CSA (Table2). Given 18 tests each for GI and CSA, the probability value for significance after Bonferroni correction for multiple comparisons is 0.003. The 3 predictors of both GI and CSA that passed this criterion were BW SDS and birth OFC SDS, which reflect maturity and in utero growth, and OFC at time of scan, which reflects both in utero and postnatal growth. Several other factors showed an association with CSA and a trend to be associated with GI. These included the antenatal factors of BW, OFC at birth, and 2 postnatal factors reflecting the severity of the clinical course: postnatal steroids and high CRIB scores.
Table 2.
Predictors of GI and CSA in Preterm Infants at Term Equivalent Controlled for PMA at MRI
| Predictors | Mean GI |
Mean CSA |
||
|---|---|---|---|---|
| Standardized Coefficient | p | Standardized Coefficient | p | |
| GA | 0.08 | 0.51 | 0.31 | 0.01a |
| Sex | −0.06 | 0.60 | −0.26 | 0.03b |
| Race | −0.15 | 0.21 | 0.02 | 0.88 |
| BW | 0.30 | 0.012b | 0.50 | <0.0001c |
| BW SDS | 0.36 | 0.002c | 0.36 | 0.002c |
| IUGR | −0.21 | 0.08 | −0.17 | 0.16 |
| Δ SDS, scan–birthd | −0.03 | 0.80 | 0.07 | 0.61 |
| Birth OFC | 0.30 | 0.014b | 0.50 | <0.0001c |
| Birth OFC SDS | 0.46 | <0.0001c | 0.47 | <0.0001c |
| OFC at time of MRI studyd | 0.58 | <0.0001c | 0.78 | <0.0001c |
| Postnatal steroid therapy | −0.30 | 0.01a | −0.43 | <0.0001c |
| Confirmed sepsis | −0.12 | 0.34 | −0.21 | 0.09b |
| PDA | −0.04 | 0.75 | −0.21 | 0.08b |
| Length of ETV | −0.12 | 0.36 | −0.30 | 0.02b |
| Upper quartile, >12 days | −0.17 | 0.18 | −0.39 | 0.001c |
| CRIB | −0.30 | 0.01a | −0.43 | <0.0001c |
| Total parenteral nutrition | −0.09 | 0.46 | −0.25 | 0.04b |
| Focal punctate white matter signal abnormality on MRI | −0.06 | 0.64 | −0.04 | 0.78 |
p = 0.01
p < 0.05
p < 0.003.
n=47 (data not available for all subjects).
BW = birth weight; CRIB = Clinical Risk Index Score for Babies; CSA = cortical surface area; ETV = endotracheal ventilation; GA = gestational age; GI = gyrification index; IUGR = intrauterine growth restriction; MRI = magnetic resonance imaging; OFC = occipitofrontal head circumference; PDA = patent ductus arteriosus; PMA = postmenstrual age; SDS = standard deviation score.
Other factors were associated with CSA alone. The antenatal factors of decreasing gestational age and female sex showed a trend toward association with lower CSA. The postnatal factor of prolonged endotracheal intubation was associated with lower CSA. The time on total parenteral nutrition, confirmed sepsis, and endotracheal intubation showed trends toward lower CSA.
Sulcal Depth Analysis
Significant sulcal depth differences were identified in several regions of both the left and right hemispheres, including the insula, superior temporal sulcus, and ventral portion of the pre- and postcentral sulci, as illustrated in t statistic maps (Fig 3). Additional differences in the dorsal portion of the postcentral sulcus and posterior region of the cingulate sulcus were identified in the right hemisphere. The precentral sulcus difference was in the ventral anterior premotor cortex, straddling Brodmann areas 44 and 06 (BA44/6), as determined by overlaying Brodmann borders on the t maps. (The border between BA44 and BA6 ran along the fundus of the precentral sulcus when viewed on the PALS-term12 mean AC–PC midthickness surface.) All differences were consistent with the preterm infants having shallower sulci than the control infants.
Figure 3.
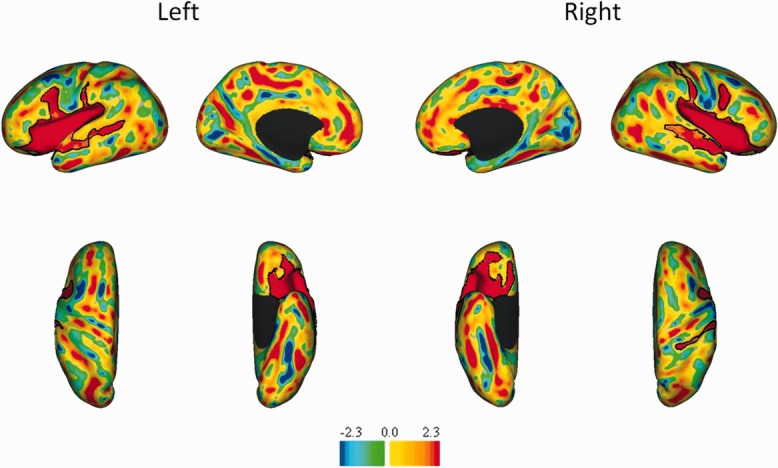
t Statistic maps of sulcal depth differences between control and preterm infants. The top row illustrates lateral and medial views, whereas the second row illustrates ventral and dorsal views for both the left and right hemispheres. The color bar shows the t values, with yellow and red indicating regions where controls have deeper sulci than preterm, whereas blues indicate regions where sulci are deeper in preterm infants. Black contours identify regions of significant (p < 0.025) difference between groups.
To aid with visualizing these shape differences, Figure 4 shows coronal and axial slice views with red and blue contour slices outlining the mean midthickness cortical surfaces of the preterm and control infants, respectively. Qualitatively, differences in sulcal depth can be observed in the insula, the superior temporal sulcus, and BA44/6. Also note the reduced overall folding complexity in the preterm group and the more sharply defined and deeper sulci in control infants. Finally, the lateral surfaces tend to be shifted in a medial direction in preterm infants, which is consistent with the dolichocephaly (disproportionately long and narrow head) associated with preterm birth. Thus, the sulcal depth difference in insular cortex may, at least in part, be related to effects of premature birth on overlying cortical gyri.19
Figure 4.
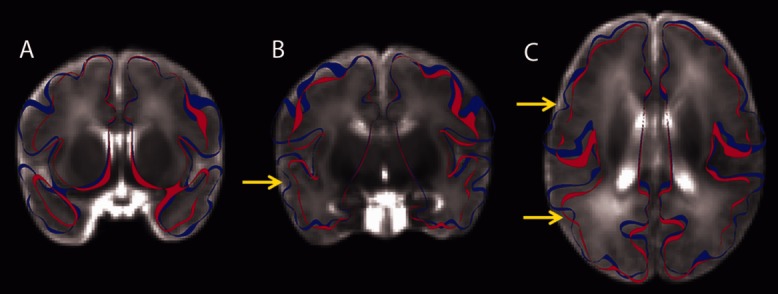
Anatomical slice views (for visualization) of an average T2-weighted image comprised of the 12 control infants used in this study and 20 preterm infants with little or no brain injury. The blue and red ribbons outline the average anterior commissure–posterior commissure midthickness cortical surfaces of the control and preterm infants, respectively. (A) A coronal slice through the insula and temporal lobe. Significant differences in size and shape can be observed. (B) A more posterior coronal slice through the temporal lobe and insula. The yellow arrow identifies the posterior portion of the superior temporal sulcus. (C) A horizontal slice. The more anterior yellow arrow identifies the precentral sulcus. The more posterior yellow arrow identifies the superior temporal sulcus.
Coordinate Distance Analysis
Some differences detected by the sulcal depth analyses may reflect contributions related to scale/shape differences between groups, both the presence of dolichocephaly in preterm brains and term control brains being larger than preterm. The surfaces used for the depth analyses had been aligned to AC–PC space, but were not spatially normalized, and some cortical regions appeared affected more than others (eg, relative sparing of the superior parietal area). Accordingly, a coordinate distance analysis was performed to probe differences unrelated to overall brain dimensions. Widespread differences persisted in both hemispheres after spatial normalization of the surfaces (Fig 5). This suggests that many of the shape differences are local rather than a reflection of generalized differences in overall brain size or shape.
Figure 5.
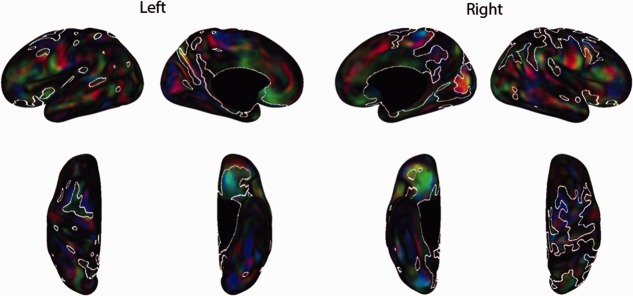
Spatially normalized coordinate distance analysis for preterm and control infants. The top row (lateral and medial views) and bottom row (dorsal and ventral) show red–green–blue (RGB) maps for the left and right hemispheres that illustrate the differences between groups. The RGB maps show the directionality of the differences (red = medial–lateral shift, green = anterior–posterior shift, blue = superior–inferior shift). Because the majority of both hemispheres reach significance, for all maps, white contours encircle regions that were not significantly (p < 0.025) different between groups.
Discussion
This study demonstrates regionally varying disruptions of cortical folding and surface shape in preterm infants at term-equivalent PMA. Both antenatal and neonatal factors were found to influence cortical surface expansion and folding during this critical time. Some of these factors were related to in utero growth, such as birth weight and birth head circumference. There were also associations with the adverse neonatal factors of a high severity of illness in the first 24 hours of life (CRIB score, which was developed to predict mortality in preterm infants), exposure to prolonged ventilation, TPN, postnatal corticosteroids, and OFC at time of scan.
Global Effects
This study confirms global differences in cortical folding between groups for GI and CSA. For example, global folding differences were previously reported in a small sample of 14 prematurely born infants at term-equivalent PMA.10 This finding highlights the dramatic, large-scale differences in cortical folding and surface area present at term-equivalent PMA.
The antenatal factors we found to be associated with disruption of both GI and CSA, birth weight and birth OFC, have previously been related to developmental outcomes in preterm infants. Lower birth weight is well known to be associated with greater risk of cerebral palsy and neurodevelopmental disability.20,21 The association with birth weight was present even for infants who did not have IUGR, although IUGR in premature infants is associated with lower intracranial and cortical gray matter volume as well as developmental deficits.22 By comparison, there are relatively few studies relating birth OFC to developmental outcome, although poor head growth early in life is associated with worse outcome.23 The antenatal factors that trended with CSA alone consisted of gestational age and being female. Younger gestational age at birth is strongly associated with impaired developmental outcome.20,21 Being female, conversely, is typically associated with better outcome.24 It is likely that the smaller CSA values for females reflect genetic predilection rather than brain injury.
Of the postnatal factors associated with disruption of cortical development, lower OFC at time of scan was associated with both lower CSA and lower GI. Whereas the association with CSA is expected (a smaller head is associated with smaller brain and hence smaller CSA), the association with GI suggests that slower combined in utero and ex utero growth is associated with reduced sulcation. The use of postnatal steroids and prolonged ETV were associated with lower CSA alone, although the use of postnatal steroids showed a trend toward lower GI. Both factors are related to more severe respiratory disease, which has been associated with poor outcome in a variety of studies.25,26 Higher CRIB score was associated with lower CSA and a trend toward lower GI, whereas higher number of days on TPN was associated with a trend toward lower CSA alone. Both factors reflect overall severity of illness during the postnatal period, and have also been associated with developmental disabilities.27,28
Although there was overlap in the factors associated with abnormalities in CSA and GI, CSA appears to be more sensitive to both ante- and postnatal factors. These 2 measures are probably related during normal brain development, but they may vary independently of each other. Along these lines, based on a study comparing preterm singletons with preterm twins and preterm IUGR babies, it has been suggested that preterm twins have a concordant reduction in both brain size and folding, whereas singleton preterm IUGR infants have a more pronounced reduction of size than folding.11 In general, scaling a brain to a smaller size without changing overall shape would more strongly affect CSA than GI. This may explain why CSA appears more sensitive to negative ante- and postnatal factors in this study; reducing brain size by slowing brain growth alone may be sufficient to reduce CSA, but would not necessarily reduce GI. It is also plausible that there is a continuum of injury, with milder injury affecting brain size, and thereby CSA, without affecting folding, and thereby GI. More severe injury might affect both. Testing this hypothesis would require further study.
Regional effects
Regions showing significant sulcal depth differences associated with premature birth included the insula, superior temporal sulcus (STS), and BA44/6. The mechanism(s) by which these areas are most sensitive to disruption is not obvious, but it is notable that these areas are known to mature relatively early in comparison with other cortical areas, with a gradation of maturation in which cortex closer to the insula matures earlier than cortex further from the insula.29 However, it has also been observed that primary motor and sensory areas develop earlier than surrounding areas,29,30 and in our data, primary visual cortex does not show prominent abnormalities despite early development. Nevertheless, vulnerability to injury may be related to the maturational stage of the cortex in question. It has also been postulated that cortical folding itself depends upon mechanical tension exerted by axons.31 Although infants with significant white matter abnormalities on T1- or T2-weighted images were excluded from our study, subtle white matter abnormalities were likely present in our population, as they have been demonstrated using diffusion tensor imaging in preterm infants in areas that appear normal using conventional structural images.32 Thus, white matter injury may in some individuals be a contributing factor to the cortical abnormalities observed in this study.
Sulcal depth distance analyses demonstrated significant differences between groups in both STS and BA44/6 bilaterally, whereas the spatially normalized coordinate distance analysis identified both regions in the left hemisphere only. These results suggest asymmetric differences in the size and shape of these regions between the groups. These findings are consistent with studies identifying regionally dependent volumetric differences between preterm and control infants.33,34 Previous studies have found reductions in white matter volume in the left temporal lobe in preterm adolescents33 and strong trends toward reductions in unmyelinated white matter volume in the premotor region defined by Talairach parcellation, which corresponds to BA44.34
Other studies have demonstrated correlations between lower volumes of the temporal lobe and later neurological deficits. A study of preterm children found that temporal lobe gray matter volume was negatively associated with intelligence quotient score,35 and a study of preterm-born adolescents showed that gray matter volume in the middle temporal gyrus was associated with poor executive function and language deficits.36 In the context of these studies, it is not surprising that cortical folding differences were found in these regions in the present study. However, our finding that differences previously reported later in life are already present by term-equivalent PMA suggests that the period in the neonatal intensive care unit may be critical in the establishment of regional abnormalities that persist into adolescence. The functional implications of these shape differences may correlate with cognitive and language performance; neurobehavioral testing of this hypothesis is underway in this cohort.
A limitation of this study is the inclusion of subjects with mild white matter injury. Because these subjects were not excluded from analysis, the presence of injury may have affected both the global and regional surface measures of affected subjects. These subjects were not excluded from analysis so as to show a large, representative sample of very preterm infants.
This study demonstrates the impact of preterm birth on cortical folding. The early emergence of cortical folding abnormalities suggests a potential benefit from optimizing the neonatal intensive care unit period for brain development. Their regional nature offers an opportunity for correlating their patterns with neurodevelopmental outcomes.
Acknowledgments
This research was funded by NIH grants R01 HD05709801 and P30 HD062171, NICHD.
Authorship
E.E. analyzed data, interpreted data, created figures, and wrote the first draft of the manuscript; T.E.I. conceived of the study, obtained funding, supervised data acquisition, supervised data analysis, interpreted data, and supervised writing of the early drafts of the manuscript; D.A. coordinated data acquisition, storage, and analysis; D.L.D. performed data analysis and interpretation; J.H. developed methods used for data analysis and performed some of the analysis; D.V.E. oversaw data analysis and interpretation and edited the manuscript; J.J.N. conceived of the study, obtained funding, supervised data acquisition, supervised data analysis, interpreted data, and edited the manuscript.
Potential Conflicts of Interest
Nothing to report.
References
- 1.Stoll BJ, Hansen NI, Bell EF. Neonatal outcomes of extremely preterm infants from the NICHD Neonatal Research Network. Pediatrics. 2010;126:443–456. doi: 10.1542/peds.2009-2959. [DOI] [PMC free article] [PubMed] [Google Scholar]
- 2.Guellec I, Lapillonne A, Renolleau S. Neurologic outcomes at school age in very preterm infants born with severe or mild growth restriction. Pediatrics. 2011;127:e883–e891. doi: 10.1542/peds.2010-2442. [DOI] [PubMed] [Google Scholar]
- 3.Vincer MJ, Allen AC, Joseph KS. Increasing prevalence of cerebral palsy among very preterm infants: a population-based study. Pediatrics. 2006;118:e1621–e1626. doi: 10.1542/peds.2006-1522. [DOI] [PubMed] [Google Scholar]
- 4.Inder TE, Warfield SK, Wang H. Abnormal cerebral structure is present at term in premature infants. Pediatrics. 2005;115:286–294. doi: 10.1542/peds.2004-0326. [DOI] [PubMed] [Google Scholar]
- 5.Peterson BS. Brain imaging studies of the anatomical and functional consequences of preterm birth for human brain development. Ann N Y Acad Sci. 2003;1008:219–237. doi: 10.1196/annals.1301.023. [DOI] [PubMed] [Google Scholar]
- 6.Nosarti C, Al-Asady MH, Frangou S. Adolescents who were born very preterm have decreased brain volumes. Brain. 2002;125(pt 7):1616–1623. doi: 10.1093/brain/awf157. [DOI] [PubMed] [Google Scholar]
- 7.Peterson BS, Vohr B, Staib LH. Regional brain volume abnormalities and long-term cognitive outcome in preterm infants. JAMA. 2000;284:1939–1947. doi: 10.1001/jama.284.15.1939. [DOI] [PubMed] [Google Scholar]
- 8.Smyser CD, Inder TE, Shimony JS. Longitudinal analysis of neural network development in preterm infants. Cereb Cortex. 2010;20:2852–2862. doi: 10.1093/cercor/bhq035. [DOI] [PMC free article] [PubMed] [Google Scholar]
- 9.Dubois J, Benders M, Cachia A. Mapping the early cortical folding process in the preterm newborn brain. Cereb Cortex. 2008;18:1444–1454. doi: 10.1093/cercor/bhm180. [DOI] [PubMed] [Google Scholar]
- 10.Ajayi-Obe M, Saeed N, Cowan FM. Reduced development of cerebral cortex in extremely preterm infants. Lancet. 2000;356:1162–1163. doi: 10.1016/s0140-6736(00)02761-6. [DOI] [PubMed] [Google Scholar]
- 11.Dubois J, Benders M, Borradori-Tolsa C. Primary cortical folding in the human newborn: an early marker of later functional development. Brain. 2008;131(pt 8):2028–2041. doi: 10.1093/brain/awn137. [DOI] [PMC free article] [PubMed] [Google Scholar]
- 12.Hill J, Dierker D, Neil J. A surface-based analysis of hemispheric asymmetries and folding of cerebral cortex in term-born human infants. J Neurosci. 2010;30:2268–2276. doi: 10.1523/JNEUROSCI.4682-09.2010. [DOI] [PMC free article] [PubMed] [Google Scholar]
- 13.Mathur AM, Neil JJ, McKinstry RC, Inder TE. Transport, monitoring, and successful brain MR imaging in unsedated neonates. Pediatr Radiol. 2008;38:260–264. doi: 10.1007/s00247-007-0705-9. [DOI] [PubMed] [Google Scholar]
- 14.Kidokoro H, Neil J, Inder T. A new MRI assessment tool to define brain abnormalities in very preterm infants at term. AJNR Am J Neuroradiol. 2013;34:2208–2214. doi: 10.3174/ajnr.A3521. [DOI] [PMC free article] [PubMed] [Google Scholar]
- 15.Van Essen DC, Drury HA, Dickson J. An integrated software suite for surface-based analyses of cerebral cortex. J Am Med Inform Assoc. 2001;8:443–459. doi: 10.1136/jamia.2001.0080443. [DOI] [PMC free article] [PubMed] [Google Scholar]
- 16.Van Essen DC. A Population-Average, Landmark- and Surface-based (PALS) atlas of human cerebral cortex. Neuroimage. 2005;28:635–662. doi: 10.1016/j.neuroimage.2005.06.058. [DOI] [PubMed] [Google Scholar]
- 17.Van Essen DC, Glasser MF, Dierker DL. Parcellations and hemispheric asymmetries of human cerebral cortex analyzed on surface-based atlases. Cereb Cortex. 2012;22:2241–2262. doi: 10.1093/cercor/bhr291. [DOI] [PMC free article] [PubMed] [Google Scholar]
- 18.Dierker DL, Feczko E, Pruett JR., Jr Analysis of Cortical Shape in Children with Simplex Autism. Cereb Cortex. 2013 doi: 10.1093/cercor/bht294. et al. Oct 27. [Epub ahead of print] [DOI] [PMC free article] [PubMed] [Google Scholar]
- 19.Nordahl CW, Dierker D, Mostafavi I. Cortical folding abnormalities in autism revealed by surface-based morphometry. J Neurosci. 2007;27:11725–11735. doi: 10.1523/JNEUROSCI.0777-07.2007. [DOI] [PMC free article] [PubMed] [Google Scholar]
- 20.Allen MC. Neurodevelopmental outcomes of preterm infants. Curr Opin Neurol. 2008;21:123–128. doi: 10.1097/WCO.0b013e3282f88bb4. [DOI] [PubMed] [Google Scholar]
- 21.Bhutta AT, Cleves MA, Casey PH. Cognitive and behavioral outcomes of school-aged children who were born preterm: a meta-analysis. JAMA. 2002;288:728–737. doi: 10.1001/jama.288.6.728. [DOI] [PubMed] [Google Scholar]
- 22.Tolsa CB, Zimine S, Warfield SK. Early alteration of structural and functional brain development in premature infants born with intrauterine growth restriction. Pediatr Res. 2004;56:132–138. doi: 10.1203/01.PDR.0000128983.54614.7E. [DOI] [PubMed] [Google Scholar]
- 23.Leppanen M, Lapinleimu H, Lind A. Antenatal and postnatal growth and 5-year cognitive outcome in very preterm infants. Pediatrics. 2014;133:63–70. doi: 10.1542/peds.2013-1187. [DOI] [PubMed] [Google Scholar]
- 24.Hintz SR, Kendrick DE, Vohr BR. Gender differences in neurodevelopmental outcomes among extremely preterm, extremely-low-birthweight infants. Acta Paediatr. 2006;95:1239–1248. doi: 10.1080/08035250600599727. [DOI] [PubMed] [Google Scholar]
- 25.Katz-Salamon M, Gerner EM, Jonsson B, Lagercrantz H. Early motor and mental development in very preterm infants with chronic lung disease. Arch Dis Child Fetal Neonatal Ed. 2000;83:F1–F6. doi: 10.1136/fn.83.1.F1. [DOI] [PMC free article] [PubMed] [Google Scholar]
- 26.Natarajan G, Pappas A, Shankaran S. Outcomes of extremely low birth weight infants with bronchopulmonary dysplasia: impact of the physiologic definition. Early Hum Dev. 2012;88:509–515. doi: 10.1016/j.earlhumdev.2011.12.013. [DOI] [PMC free article] [PubMed] [Google Scholar]
- 27.Embleton ND, Morgan C, King C. Balancing the risks and benefits of parenteral nutrition for preterm infants: can we define the optimal composition? Arch Dis Child Fetal Neonatal Ed. 2014 doi: 10.1136/archdischild-2013-304061. Jun 12. [Epub ahead of print] [DOI] [PubMed] [Google Scholar]
- 28.Lodha A, Sauve R, Chen S. Clinical Risk Index for Babies score for the prediction of neurodevelopmental outcomes at 3 years of age in infants of very low birthweight. Dev Med Child Neurol. 2009;51:895–900. doi: 10.1111/j.1469-8749.2009.03284.x. [DOI] [PubMed] [Google Scholar]
- 29.Sidman RL, Rakic P. Development of the human central nervous system. In: Haymaker W, Adams RD, editors. Histology and histopathology of the nervous system. Springfield, IL: C.C. Thomas; 1982. pp. 3–145. In:, eds. [Google Scholar]
- 30.Conel JL. The cortex of the newborn. Cambridge, MA: Harvard University Press; 1939. [Google Scholar]
- 31.Van Essen DC. A tension-based theory of morphogenesis and compact wiring in the central nervous system. Nature. 1997;385:313–318. doi: 10.1038/385313a0. [DOI] [PubMed] [Google Scholar]
- 32.Huppi PS, Murphy B, Maier SE. Microstructural brain development after perinatal cerebral white matter injury assessed by diffusion tensor magnetic resonance imaging. Pediatrics. 2001;107:455–460. doi: 10.1542/peds.107.3.455. [DOI] [PubMed] [Google Scholar]
- 33.Fraello D, Maller-Kesselman J, Vohr B. Consequence of preterm birth in early adolescence: the role of language on auditory short-term memory. J Child Neurol. 2011;26:738–742. doi: 10.1177/0883073810391904. [DOI] [PMC free article] [PubMed] [Google Scholar]
- 34.Thompson DK, Warfield SK, Carlin JB. Perinatal risk factors altering regional brain structure in the preterm infant. Brain. 2007;130(pt 3):667–677. doi: 10.1093/brain/awl277. [DOI] [PubMed] [Google Scholar]
- 35.Soria-Pastor S, Padilla N, Zubiaurre-Elorza L. Decreased regional brain volume and cognitive impairment in preterm children at low risk. Pediatrics. 2009;124:e1161–e1170. doi: 10.1542/peds.2009-0244. [DOI] [PubMed] [Google Scholar]
- 36.Nosarti C, Giouroukou E, Healy E. Grey and white matter distribution in very preterm adolescents mediates neurodevelopmental outcome. Brain. 2008;131(pt 1):205–217. doi: 10.1093/brain/awm282. [DOI] [PubMed] [Google Scholar]